International Journal of Scientific & Engineering Research, Volume 5, Issue 6, June-2014 652
ISSN 2229-5518
Vickers hardness and Specific wear resistance of
E glass reinforced poly methyl methacrylate
Merin Mathew, Kamalakanth Shenoy, Ravishankar K.S.
Abstract—Poly methyl methacrylate (PMMA) is one of the most widely accepted biomaterial in prosthetic dentistry due to its acceptable advantages. However the conventional PMMA used are far from being ideal because of their inferior mechanical properties. So the present study is to determine the Vickers Hardness and specific wear rate of the silane treated E glass fiber reinforced PMMA. Vickers Hardness number and specific wear rate of PMMA denture base can be determined by varying the weight percentage and aspect ratio of glass fiber. To measure the Vickers hardness, specimens prepared using a standard rectangular mold of 62mm length, 10 mm breadth and 2.5 mm thickness. Vickers Hardness number measured using Vickers hardness test apparatus having square based diamond pyramid as indenter. For wear analysis, specimens prepared using a standard cylindrical mold of 8mm diameter and 25mm length. Specific wear rate measured after measuring the weight loss in the pin on disc method by Wear and Friction Monitor TR-20ICL. Microstructure of the abraded surface observed through Trinocular inverted metallurgical microscope model Metji M1004. Detailed statistical analysis performed using One-way Analysis of Variance (ANOVA), Tukey-Kramer Multiple Comparisons Test. E glass reinforced PMMA shown superior Vickers hardness number compare to control and the specific wear rate for the reinforced groups were less compare to control.
Index Terms— Poly methyl methacrylate. PMMA, specific wear, Silane treated E glass fiber, Vickers hardness.
—————————— ——————————
1 INTRODUCTION
ardness is the mechanical property of a material that enables the material to resist plastic deformation pre- dominantly by penetration, indentation, scratching, abrasion etc.[1] Hardness provides a possible indication of the abrasiveness of the dental material which is the characteristic of the ease of finishing the material as it is resistant to in - service scratching during cleansing or handling.[2] Hardness testing methods have become one of the most popular tools in mechanical testing because of their relatively straightforward, fast and sufficiently repeatable performance.[3] Poly methyl methacrylate is so well received biomaterial by dental profes- sion due to its acceptable advantages. However the mechani- cal performances of these materials are not ideal.[4] So in or- der to enhance the mechanical characteristics of the conven- tional PMMA, surface treated e glass fibers incorporated with the PMMA matrix and a polymer composite is prepared. Hardness testing is one of the effective and relatively simple methods in understanding the mechanical behavior of these
reinforced PMMA.
2 AIM
To determine hardness and specific wear resistance of PMMA material by varying the weight percentage of glass fiber. (2.5wt%, 5 wt%, 10 wt %), To determine hardness and specific wear resistance of PMMA material by varying the length/ thickness ratio of glass fiber.( 3mm/ 20μm, 6mm/
20μm, 12mm/ 20μm) and Comparison of the above and un-
————————————————
• Merin Mathew is cirrently Lecturer at Dept.of Dental materials mahe
Institute of Dental Sciences & Hospital, Chalakkara, Mahe.
• Dr. Kamalakanth Shenoy is currently HOD., Dept.of Prosthodontics,
Yenepoya Dental College, Mangalore.
• Dr. Ravishankar K.S is currently ASST. Professor, Dept. of Metallurgical
& Materials Engineering, National institute of Technology, Karnataka, Mangalore.
derstand the optimum property of the PMMA material using the correct weight percentage and aspect ratio.
3 MATERIALS AND METHODS
3.1 Materials
Modelling wax, dental stone type ІІІ gypsum product, type ІІ gypsum product, silane treated E glass fibers, heat pol- ymerizing PMMA powder and monomer liquid, separating medium.
3.2 Methods
3.2.1. Preparation of gypsum moulds to obtain the acrylic specimen for hardness testing
Wax pattern (62mm X 10mm X 2.5mm) is prepared using modelling wax and invested in the dental flask in the conven- tional manner using dental stone and model plaster. After 1 hour the invested flask kept for dewaxing, then any waxy res- idue removed by washing the mould by hot water and then cleaned using soap solution, allowed to dry, thin layer of sepa- rating medium is applied in the mould space, allowed to dry. The mould was then ready to be used for the preparation of acrylic specimen.[5]
3.2.2. Preparation of gypsum moulds to obtain the acrylic specimen for wear analysis
Wax pattern (8mm diameter, 25mm length) is prepared us- ing modeling wax and invested in the dental flask in the con- ventional manner using dental stone and model plaster. After
1 hour the invested flask kept for dewaxing, then any waxy residue removed by washing the mould by hot water and then cleaned using soap solution, allowed to dry, thin layer of sepa- rating medium is applied in the mould space, allowed to dry. The mould was then ready to be used for the preparation of acrylic specimen
3.2.3. Preparation of PMMA resin specimen:
3.2.3.1. Control group:
IJSER © 2014 http://www.ijser.org
International Journal of Scientific & Engineering Research, Volume 5, Issue 6, June-2014 653
ISSN 2229-5518
Control group test specimen made with conventional heat polymerized PMMA resin (DPI heat cure) polymer and mon- omer (2.4gm: 1ml) mixed and allowed to reach dough con- sistency. Dough is kneaded and then packed into the mould, flask is closed and a pressure of 1400 psi is given and bench cured for 30 minutes in hydraulic press apparatus. Then the flask is clamped and transferred it into the water bath. Tem- perature of the water bath elevated slowly to 72 °c, and main- tained for 90 minutes. Then the temperature of the water bath elevated to 100°c and maintained for 60 minutes. After com- pletion of polymerization cycle, the flask is allowed to cool in same water bath to room temperature, and the acrylic resin specimens are retrieved after deflasking. The specimen ob- tained were finished and polished in the conventional man- ner.[5]
3.2.3.2. Reinforced group:
Silane treated E glass fibers of varying length and concen-
tration is taken and impregnated in the measured monomer for 5 minutes, then the polymer powder is weighed and mixed with monomer and E glass fiber and allowed to reach dough consistency. Then it is packed and a pressure of 1400 PSI is
given and bench cured for 30 minutes in hydraulic press appa- ratus. Then the flask is clamped and transferred it into the wa- ter bath. Temperature of the water bath elevated slowly to 72
°c, and maintained for 90 minutes. Then the temperature of the water bath elevated to 100°c and maintained for 60 minutes. After completion of polymerization cycle, the flask is allowed to cool in the same water bath to room temperature, and the acrylic resin specimens are retrieved after deflasking. Specimens obtained were finished and polished in the conven- tional manner.[5]
3.2.4. Hardness testing:
Hardness was measured using Vickers hardness test appa-
ratus. It has a square based diamond pyramid as indenter. The
value of the load (50gm) and the time duration (10 seconds)
that is to be applied was set. The test specimen was held firm-
ly in position and lens were arranged to get the image clearly
at its focal length, then the indentation made using set param-
eters. Indentations focused and the measuring lines were
made to interact at two diagonally opposite corner. Readings
were taken by pressing the read button. Similarly the lens was
rotated and the measurement of diagonally opposite corner was measured.
3.2.5. Wear analysis:
Specific wear rate was measured using pin on disc method
by Wear and Friction Monitor TR-20ICL. Weight of the speci-
men was measured and considered as initial weight
W1.specimen was inserted into the holder and made sure that
the end surface of the specimen and disc surface was parallel
to each other. Holder was adjusted to get the desirable wear
track radius (D=60mm). Load was given on the hang attached
to the apparatus (300gm). Specimen securely tightened to the
holder. By using the controller attached to the device the
speed of rotation (200 rpm) and the time duration for the rota- tion (10 minutes) were selected. Then the data recorded con- troller device was switched on. Once the rotation completed after set duration 10 minutes, the weight of the specimen
measured W2. The procedure was repeated and the weight
measured as W3. Weight loss W1-W2 and W2-W3 measured and average weight loss measured as ∆W. The experiment was repeated for 500 gm, 1000gm load. The load was varied in order to understand the effect of load on the specific wear. Specific wear rate was obtained from the formula:
Specific Wear rate = ∆W / (load in Newton * sliding dis-
tance) gm/ Nm
Where ∆W = average weight loss
Sliding distance S = velocity m/sec*time sec
Sliding velocity (V) = (¶ D N)/(60*1000) m/sec
D= wear track diameter selected (60mm)
¶ = 3.14
N = speed of the rotating disc (rpm) (200)
The surface after wear was observed through Trinocular
inverted metallurgical microscope model Metji M1004
Figure 1: Abraded surface of the control specimen ob- served at 50X magnification
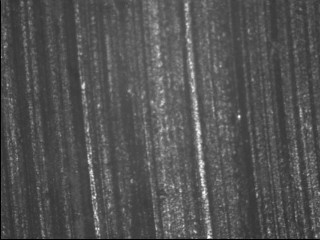
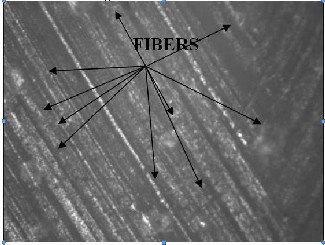
Figure 2: Abraded surface of the reinforced specimen ob- served at 50X magnification
4 RESULTS
•All modified groups shown significant increase in the Vick-
IJSER © 2014 http://www.ijser.org
International Journal of Scientific & Engineering Research, Volume 5, Issue 6, June-2014 654
ISSN 2229-5518
ers hardness number compared to control group having no fiber.(Table 1)
•Comparing different fiber weight with same fiber length there was significant increase in the Vickers hardness num- ber.(Figure 3)
•Comparing different fiber length with same fiber weight per- centage there was no significance in the Vickers Hardness number.(Figure 3)
•Under all given loads, specific wear rate was more for the control group when compare with other reinforced group. (Table 2)
•As the load increases from 300 gm to 1000gm there was sig- nificant increase in the wear rate of the control group.(Table 2)
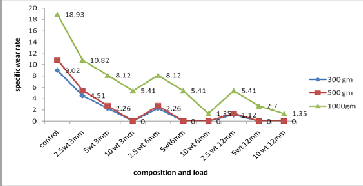
•As the fiber concentration increases, specific wear rate ob- served was less. (Figure 4)
5 DISCUSSION
Vickers hardness test was developed in 1921by Robert L. Smith and George E. Sandland. The advantage of using this method is that this test can be used for all materials and has
the widest scale among the hardness tests and the result will be more accurate. The hardness number is determined by the load over the surface area of the indentation and not the area normal to the force, and is therefore not a pressure. Unit of hardness measured by this test is Vickers Pyramid number (HV) or Diamond Pyramid hardness (DPH) [6] Vickers hard- ness test is highly depend on the surface homogeneity, the operator’s perception and mainly on the elastic recovery of the material. [7] So in order to overcome these problems, the read- ings were taken on well polished samples immediately after the indentation obtained.
Hardness is the resistance of a material against plastic de- formation when the load is applied.[8] The greater the re- sistance to permanent deformation, the greater will be the hardness. so the hardness measurement of poly methyl meth- acrylate based prosthesis is important in such a way that those prosthesis having low hardness are tend to be scratched in the oral environment while brushing, chewing, cleaning etc. as a

Table 1 : VHN- Vickers hardness number when 50 gm applied for 10 seconds

Sl no. Control specimen
3mm long E glass fiber 6mm long E glass fiber 12mm long E glass fiber

2.5 fiber wt%
5 fiber wt%
10 fiber wt%
2.5 fiber wt%
5 fiber wt%
10 fiber wt%
2.5 fiber wt%
5 fiber wt%
10 fiber wt%
1 20.4 25 27 30.9 26.1 28.1 31 25.4 28.7 33.1
2 19.4 26.4 29 32.7 26.8 27.8 32.5 26 27.2 32.8
3 19.4 24 28.9 31.9 26 27.2 33 25.9 28.1 33.6
4 20.2 26.8 27.4 33 26.6 29 31.2 25.6 27 33
5 20.1 24.7 29.7 31.2 24.2 27.4 31.8 25 28.9 32.9
6 19.9 25.2 28 32.8 25.4 27.6 32.6 25.8 27.8 33.2


Mean 19.9 25.35 28.333 32.083 25.85 27.85 32.016 25.616 27.95 33.1 stdev 0.419 1.0578 1.0385 0.8886 0.946 0.6442 0.811 0.371 0.7714 0.28284

Table 2.Specific wear rate of the tested samples at different loads
control 2.5 wt

3mm
5 wt
3mm
10 wt
3mm
2.5 wt
6mm
5 wt
6mm
10 wt
6mm
2.5 wt
12mm
5 wt
12mm
10 wt
12mm
∆w load 300 gm 0.001 0.0005 0.00025 0 0.00025 0 0 0.000125 0 0
Specific wear rate (x 10-7

g/NM)
9.02 4.51 2.26 0 2.26 0 0 1.12 0 0
∆w load 500gm 0.002 0.001 0.0005 0 0.0005 0 0 0.00025 0 0
Specific wear rate (x 10-7

g/NM)
10.83 5.4 2.7 0 2.7 0 0 1.35 0 0
∆w load 1000 gm 0.007 0.004 0.003 0.002 0.003 0.002 0.0005 0.002 0.001 0.0005
Specific wear rate (x 10-7

g/NM)
18.93 10.82 8.11 5.41 8.11 5.41 1.35 5.41 2.7 1.35
Key: ∆w = average weight loss of specimen after wear test( w1- w2, w2-w3) result surface become rough and chance of plaque accumula- tion, pigmentation and these will lead to compromise the aes- thetics, hygiene and moreover the minute cracks or flaws on the surface will act as the initiator for crack propagation and material’s fracture. So the hardness property is directly related to the service life of PMMA based materials.[9]
Hardness of the PMMA based materials directly related to
the amount of residual monomer present after processing.
Unreacted monomer will act as plasticizer and weaken the matrix. Heat cured PMMA can perform better in this aspect that the residual monomer content is less when compare to PMMA polymerized through other mechanisms. There is an increase in the hardness of the heat cured PMMA when glass fibers added to it. [10] So the present study demonstrates the effect of silane treated E glass fiber weight percentage and aspect ratio on the Vickers harness number of PMMA. Inor-
IJSER © 2014 http://www.ijser.org
International Journal of Scientific & Engineering Research, Volume 5, Issue 6, June-2014 655
ISSN 2229-5518
ganic materials like glass fibers have poor compatibility with the fiber matrix interface. Silane coupling agents can be used to improve the adhesion of these inorganic glass fibers to the polymeric matrix and in addition coupling agent aid in pro- tecting fiber surface and prevent inhibition of polymerization by the solid surface. [11] The results suggest that there is sig- nificant increase in the hardness number when the fiber weight percentage is more and at the same time there is no much variation depends on the aspect ratio of the fiber; that may be due to the fact that hardness is a surface mechanical property and the micro hardness tests demonstrates the ability of the material to resist surface plastic deformation in a limited area.
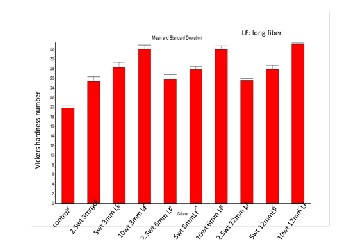
Figure 3. Vickers hardness number of tested samples
Figure 4. specific wear rate of the tested samples at different loads
Wear rate of the PMMA material is also important in addi- tion with the hardness as it determines the longevity of the materials inside the oral cavity. [12] Wear rate and the hard- ness are related property, when the wear rate is more hard- ness is less. [13] Generally two different mechanisms of wear occur in polymers, namely cohesive and interfacial wear pro- cesses. The cohesive wear such as abrasion wear, fatigue wear and fretting mainly depend on the mechanical properties of the interacting material. On the other hand the interfacial wear such as transfer wear, chemical wear and corrosive wear de- pends on the chemistry of the surface involved. The cohesive
abrasion wear, the two- body and three- body abrasion wear are the most common wear encountered in polymer compo- sites. This is highly depending on the hardness of the materi- als in contact, applied load and sliding distance and the geom- etry of the abrasive particle. [14] In the present study the wear rate of the prepared polymer composites were calculated un- der different loads and under different applied loads there was significant difference in the wear rate of control specimen with no fiber in it. And there was no much variation in the wear rate of the reinforced groups indicating the fiber rein- forced varieties are more resistant to abrasive wear than the control.
6 CONCLUSION
•Fiber reinforcement results in improved hardness.
•As the concentration of the fiber increases, Vickers hardness
number also increases, but aspect ratio did not affect much on
the hardness number.
•Specific wear rate observed was less for the reinforced
groups compared to control group.
•As the load applied increases, wear rate also increases.
REFERENCES
[1] Site reference: http://www.gordonengland.co.uk
[2] Farideh Bahrani,Anahita Safari, Mahroo Vojdani, Ghasem Karampoor, Comparison of hardness and surface roughness of two denture bases pol- ymerized by different methods, World journal of Dentistry, April- June
2012;3(2):171-175
[3] Ralf Lach,Gyeong-Man Kim, Rameshwar Adhikari, Goerg H. Michler and
Wolfgang Grellmann, Indentation Methods for Characterising the Mechan- ical and Fracture Behaviour of Polymer Nanocomposites, Nepal Journal of Science and Technology Vol. 13, No. 2 (2012) 115-122.
[4] R. Rodford, The development of high impact strength denture-base materi-
als, Journal of dentistry, October 1986, volume 14, issue.5 pages 214-217
[5] Sanjiv Rajender Dagar, Ashok J Pakhan, RU Thombare, Bhagwandas K
Motwani Evaluation of flexural strength and impact strength of heat pol-
ymerized PMMA denture base resin reinforced with glass and nylon fibers. Journal of Indian Prosthodontic Society 2008,pages:98-104.
[6] R.L. Smith & G.E. Sandland, An Accurate Method of Determining the Hardness of Metals, with Particular Reference to Those of a High Degree of Hardness, Proceedings of the Institution of Mechanical Engineers, Vol. I,
1922, p 623–641.
[7] Abdullah Saleh , AlJamhan, In-vitro wear and hardness of new conven-
tional glass ionomer Cement coated with nano- filled resin, Indiana Univer- sity School of Dentistry, May 2011
[8] Myth Buster 1/4: Wear and Hardness, 2 April 2013, www.thermaspray.co.za
[9] Morgan TD, Wilson M, Effect of surface roughness and type of denture
acrylic on biofilm formation by streptococcus oralis in a constant depth film formentor,Journal of Applied Microbiology 2001 Jul: 91(1):47-53
[10] Ana Paula Farina et al, Evaluation of Vickers hardness of different types of acrylic denture base resins with and without glass fiber reinforcement, Gerodontology 2012 vol.29, no.2, E155- E160.
[11] Hatsuo Ishida, introduction to polymer composite processing. Chapter 5,
NSF Center for Molecular and Microstructure of Composites (CMMC) De-
partment of Mascromolecular Science
[12] Gagan Khanna, IN Aparna, Comparison of micro hardness of three differ-
ent type of acrylic artificial denture teeth:an invitro study, Journal of Orofa- cial Research July – September 2013;3(3):181-185
[13] S. Luyckx, A Love, The relationship between the abrasion resistance and
the hardness of WC-Co alloys, The Journal of The South African Institute of
Mining and Metallurgy, nov 2004, pages.579-582.
IJSER © 2014 http://www.ijser.org
International Journal of Scientific & Engineering Research, Volume 5, Issue 6, June-2014
ISSN 2229-5518
[14] Giulio Malucelli and Francesco Marino, abrasion resistan:e of polymer nanocomposites- a review.www.intechopen.com
656
IJSER lb)2014
http://www.ijserorq