The research paper published by IJSER journal is about The Modeling of a Hybrid Wind-Microturbine Generation System 1
ISSN 2229-5518
The Modeling of a Hybrid Wind-Microturbine
Generation System
G. Ofualagba, S.O. Otuagoma
Abstract— Anhybrid (wind-microturbine) generation system is presented in this paper. A brief description of the power electronic interface is given, through which the out-put of the each generating unit is passed before they are connected to a common load. Also, a microturbine generation system (MTG) is considered as the backup generator, to meet the energy requirements when wind e nergy is not sufficient. In the last section of this paper, a hybrid configuration comprising of a WECS and a MTG system interconnected through a power electronics interface is simulated. The power electronic controls presented have the ability to manage the real and reactive power components at prescribed level. The system response under different load conditions and the load management ability of the power electronics are shown through simulations studies carried out in MATLAB/Simulink.
Index Terms—Generation, hybrid, inverter, microturbine, modeling, power electronics interface, reactive power.
—————————— ——————————
In this paper, power management of a hybrid (wind- microturbine) generation system is presented. A brief descrip- tion of the power electronic interface is given, through which the output of the each generating unit is passed before they are connected to a common load.
Two major problems have to be addressed when employ- ing non-dispatchable distributed generation sources, such as wind (the renewable source of energy considered in this the- sis), for electric power generation. The first issue is the un- predictable nature of wind and the subsequent need for standby energy systems to ensure continuity of supply. The second issue is the usage of induction generator as an elec- trical generator. While these machines are well suited for va- riable speed nature of wind turbines, they can not operate without reactive power support from the network to which they are connected. Therefore, the ability to provide a reliable supply to the load depends on successful integration of the renewable resources (wind energy, in this case) with existing nonrenewable sources of energy; addressing the above men- tioned concerns.
In this paper, a microturbine generation system (MTG) is considered as the backup generator, to meet the energy re- quirements when wind energy is not sufficient. have a hybrid system consisting of a wind energy conversion system (WECS) and a microturbine supplementing each other. Such a system could also be referred as a virtualpower plant and could be operated either in grid-connected mode (not dis- cussed in this paper) or in a stand-alone (isolated) mode. Hy- brid systems in general are influenced byfactors like input (wind) and load conditions, which may affect their voltage andfrequency, necessitating the use of power electronics to control and maintain thesesystem variables at desired values.
————————————————
• S. O. Otuagoma is a lecturer at the Department of Electrical/Electronics and
Computer Engineering, Delta State University, Oleh Campus, Delta State,
Nigeria.
The power electronics interface used in this paper is taken from [1] and has been adapted for the system under consider- ation.In the last section of this paper, a hybrid configuration comprising of a WECS and a MTG system interconnected through a power electronics interface is simulated. The power electronic controls presented have the ability to manage the real and reactive power components at prescribed level. The system response under different load conditions and the load management ability of the power electronics are shown through simulations studies carried out in MAT- LAB/Simulink.
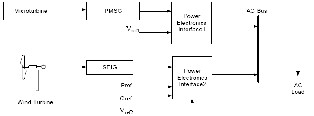
A hybrid generation system consisting of a 370kW WECS and a 400kW MTG system along with the power electronics interfacing is presented in this section. Although a hybrid plant may use other combinations of energy sources, the combination of wind generation and MTG systems are particularly complimentary [1], [2]. Wind power generation is high on capital cost and low on operational cost; Once installed there no ongoing fuel costs and the maintenance costs are also very low. On the other hand, gas turbine generation is low on capital cost and high on operational cost compared to wind turbine due to its need for fuel and maintenance. This combination is also environmentally friendly in that the emission of greenhouse gases from the microturbine is very low compared to the conventional fossil fuel steam turbines. Figure 1 shows the block diagram of the proposed system.
IJSER © 2012 http://www.ijser.org
The research paper published by IJSER journal is about The Modeling of a Hybrid Wind-Microturbine Generation System 2
ISSN 2229-5518

Fig 1. Block diagram of the hybrid generation system.
The hybrid system, shown in Figure 1, consists of models for WECS, MTG, and power electronics interfacing connected to an AC bus which supplies an AC load. In the following paragraph, a brief description of the power electronics interfacing [3] is given.
In order to realize a hybrid system, the output voltage and frequency of each component should be maintained at a predetermined level so that the interconnection between the different components of the hybrid system can be achieved. This is made possible by employing power electronics interface which has the ability to control the system output variables such as voltage, frequency, active and reactive power to keep or bring them to match their reference values after a disturbance. In the hybrid configuration considered, the WECS and the MTG system each have their own dq transformed [4] power electronics interface and the control logic is the same in both cases. The power electronics interface comprises of a rectifier and voltage source inverter. A pulse width modulation (PWM) controller was used to control the inverter in order to satisfy the voltage regulation as well as to achieve real and reactive power control [3]. A brief description of each sub system of this block is given in the following sections.
The power electronics interface used has the ability to control the real and reactive power by controlling the inverter output voltage, angle and frequency [3]. This is realized by converting AC power output from the generator in to DC and then in to AC. A 3-phase uncontrolled rectifier made up of six bridge connected diodes has been used to rectify the generator output from AC to DC. A voltage source inverter (VSI) is then employed to convert the DC output from the rectifier to AC. Control of voltage source inverter is achieved by means of two control loops namely, the inner current control and the outer voltage regulator loop. The overall system along with its control strategies is shown in Figure 2.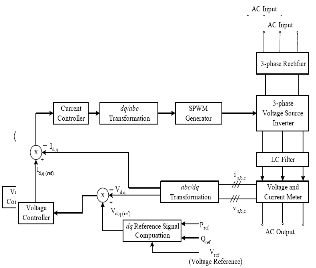
Fig 2. Block diagram of the power electronics interfacing [9].
The “abc/dq Transformation” block takes the time varying currents and voltages (in abc coordinates) from the voltage and current measurement devices and converts them into dq (time-invariant) values. The voltage controller takes the error signals between the actual output in dq frame (Vd,q) and the reference voltage (Vd,q(ref)) and generates the current reference signals (Id,q(ref)) for the current controller loop. The current controller produces the dq control signals, which are converted back to the control signals in abc coordinates through the “dq/abc Transformation” block. These control signals are used generate the gating pulses for the inverter to control its output voltage, using sinusoidal pulse-width modulation (SPWM) generator. In the following paragraphs the control principle of the power electronics interfacing along with the control loops are presented.
![]()
Consider a circuit having a sending end voltage ofVs δ and receiving end voltage equal to V∟00connected through a coupling impedance of (R+jX), as shown in Figure 3.
Fig 3.Power flow between two points.
The real and reactive power transferred between the source and load end are [3]:![]()
![]()
IJSER © 2012 http://www.ijser.org
The research paper published by IJSER journal is about The Modeling of a Hybrid Wind-Microturbine Generation System 3
ISSN 2229-5518
Where Z![]() andθz=tan-1 (X/R)
andθz=tan-1 (X/R)
From (equation 1) and (equation 2) it is clear that the real and reactive powers delivered are completely determined by the amplitude and angle of the sending voltage source, i.e. the output voltage of the inverter. On the other hand, if the desired values of real and reactive power are given, the values ofVsand δ can be determined from (equation 3) and (equation 4):![]()
![]()
The corresponding dq0 component values of Vs in (equation 3) can be obtained through abc/dq transformation. In Figure 2, the “dq Reference Signal Computation” block uses (equation 3) and (equation 4) to calculate the magnitude and angle of the filtered output voltages of the inverter and then convert them into dq voltage referencesignals using abc/dq transformation.
The DC power output from the uncontrolled rectifier is converted to AC by a 3-phase voltage source inverter, and delivered to a load as shown in Figure 4. It also shows the connection to the AC load bus through LC filters and coupling inductors [3].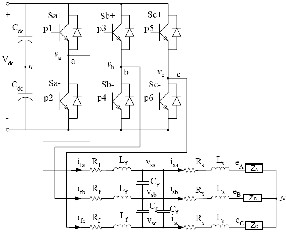
Fig 4. Three-phase DC/AC voltage source inverter.
In the Figure 4, R, L and C denote resistance, inductance and capacitance values. ZA denotes the load impedance of phase A. The subscripts f and s denote filter and coupling inductor parameters respectively. N is the common reference point and n is a virtual neutral point. Vdc is the DC bus voltage. The output phase potentials of the inverter, va, vb and vc, can be obtained as va= van+vn, vb=vbn+vn, vc= vcn + vn, where van, vbn and vcn, the inverter output voltages between each phase and its virtual neutral point n. The voltage of phase A at the receiving end (load end) is given byeA.
Current control forms the inner control loop of the overall control system and is designed to respond faster than the voltage control loop so that the two control loops can be designed independently. As a result, when dealing with the inner loop, we take the voltage control loop as a constant input (i.e., Id,q(ref)is constant in Figure 2). The current controller employed is a PI controller and the parameters used are obtained from [3]. The block diagram of the current controller is shown in Figure 5.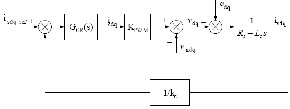
Fig 5. Block diagram of the current control loop for the inverter.
![]()
![]()
![]()
In Figure 5,GCR(S) = ![]() is the current regulator,Icdq
is the current regulator,Icdq
![]()
![]()
is dqcomponent of the current regulator output, KPWMis the overall gain of the PWM generator for the inverter, is
the equivalent admittance of the combination of LC filter, power transformer, coupling inductor and transmission line, and 1/kc is the current transducer ratio. vndqis thedqcomponent of the virtual neutral point voltage1.

A PI controller is employed to implement voltage controller. As discussed above, this controller forms the outer loop in Figure 2 and is slower compared to the inner current control loop [3]. This facilitates the approximation of the current control loop (in Figure 2) as a simple lag block when analyzing the voltage controller. The block diagram of the voltage controller is shown in the Figure6: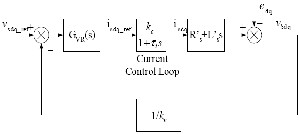
Fig 6. Block diagram of the voltage control loop for the inverter.
![]()
![]()
![]()
![]()
In Figure 6,GVR(S) = ![]() is the voltage regulator, is the lag approximation for the inner current
is the voltage regulator, is the lag approximation for the inner current
![]()
loop,( + s)is the equivalent impedance of the combination
IJSER © 2012 http://www.ijser.org
The research paper published by IJSER journal is about The Modeling of a Hybrid Wind-Microturbine Generation System 4
ISSN 2229-5518
of the power transformer, coupling inductor and transmission line, and 1/kv is the voltage transducer ratio.
The parameters of the current and voltage controllers are as follows [3].
TABLE 1
PARAMETER OF THE CONTROLLERS FOR 3-PHASE VSI
Kci | Kcp | Kvi | Kvp |
250 | 2.5 | 25 | 0.25 |
A model for the hybrid wind-microturbine generation system, shown in Figure 1, is built in the MATLAB/Simulink. This is achieved by integrating the dynamic models of the WECS and the MTG system through the power electronics interfacing. The maximum power output from the WECS is
370kW and that of the MTG system is 400kW. So, the hybrid system is capable of supplying 400kW at any time of the day irrespective of prevailing wind conditions. Simulation parameters used for the WECS can be found in [6] and [7], and the MTG system parameters are given in [8]. The following paragraph explains the control principle behind the power management of the hybrid generation system. Simulation results for the hybrid generation system under different wind and load conditions follows next.
The power referencePref, (Figure 1), for the WECS power electronics interfacing is obtained by using the wind turbine simulations results in [6]. Figure 8 gives the power output of the wind turbine for different wind velocities. This can be represented in the form of a look-up table whose input is wind velocity, and output is the power reference (Pref). The reactive power referenceQreffor the WECS is kept constant at zero as the SEIG of the WECS is assumed to be operating on unity power factor. The voltage references Vref1 and Vref2for the MTG system and WECS (Figure 1) are kept constant at
1p.u.in order to maintain AC bus voltage (at 1.p.u.). As a
result, whenever there is not enough power output from the
wind turbine, to meet the load requirement, thevoltage at the
load terminals tends to drop from 1 per-unit. The power electronicsinterface connected to the MTG system counters this drop by increasing the power outputfrom the
microturbine and thereby maintaining the load voltage at a constant value of 1per-unit. Since the output voltage levels of the PMSG and SEIG are different, a transformer with 1:2 turns ratio is used in between the inverter outputand the AC load (inside the power electronics interface2), to increase the output voltageof the SEIG to an acceptable level.
For the following simulation results, all values are referred to a base power rating of1MVA and a base voltage rating of 2400 volts. The speed reference for the microturbineis kept constant at 1 per-unit. Initially the wind turbine is not connected to the hybridsystem and the MTG system is supplying the total load demand. At t=10 seconds, theWECS is connected to the MTG system. Although with the help of power electronicinterfacing it is possible to get some
reactive power output from the WECS, in this study,it is assumed that the reactive power contribution from the WECS is zero. Accordingly,Qref(in Figure 1) is kept constant at zero for all simulations. Different wind and loadconditions are applied, and results are presented in the following paragraphs. Simulationresults of the hybrid generation system including responses of the subsystems, for thefirst case, are given with a brief discussion of each result. Power and voltage outputs ofthe hybrid generation system are presented for remaining case studies.
The wind velocity remained constant at 9m/s, until t=15 seconds and then starts ramping up reaching a final value of
12m/s at t=16 seconds. This change in the wind velocity is shown in Figure 7. As said above, MTG system is supplying the total load demand of (0.4+j0.2) per-unit until the WECS is connected to the MTG system at t=10 seconds.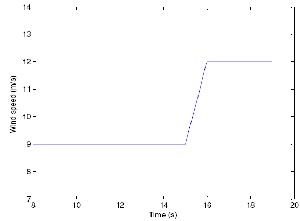
Fig 7. W ind input to the hybrid generation system.
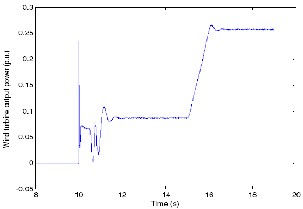
The real power outputs of the MTG system and the WECS for the above mentioned wind and load conditions are shown in Figures 8 and 9, respectively.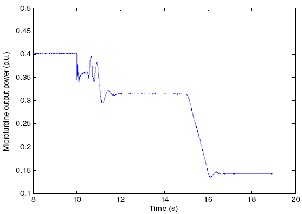
Fig 8. MTG system real power output variations with wind.
IJSER © 2012 http://www.ijser.org
The research paper published by IJSER journal is about The Modeling of a Hybrid Wind-Microturbine Generation System 5
ISSN 2229-5518
electronics interfacing, it is possible to extract reactive power from the WECS also).
Fig 9.W ECS real power output variations with wind.
Figure 8, shows that the MTG system alone is capable of supplying the total real power requirement of the load (400 kW) before the WECS is connected to the hybrid generation system. At t=10 seconds, the WECS is connected to the hybrid system and the real power output from the MTG drops which corresponds to an increase in the WECS output power. From the [6] simulations, it is known that the wind turbine output for a wind velocity of 9 m/s is about 85 kW. This will be the output of the look-up table which is fed to the power electronics interface2 as Pref in p.u. (85kW=0.085 p.u.). Figure
9 shows the output power produced by the WECS which is about 0.085 p.u. (85 kW). Since the load power requirement is
0.4 p.u. (400 kW) the remaining 0.315 p.u. is produced by the
MTG system to maintain the AC bus (load) voltage at 1 per-
unit. As the wind velocity changes from 9 m/s to 12 m/s,
between t=15 and 16 seconds, the wind turbine is capable of producing more power. Correspondingly,Pref(Figure 1) to the power electronics interface2 is also increased to 0.275 p.u. [6].
Observe that the output from the MTG system decreases from
315 kW (0.315 p.u.) at t=15 seconds to 0.14 p.u. around t=16.5
seconds. During the same time the WECS output increases
from 0.085 p.u. to 0.26 p.u. (Figure 9). From Figures 8 and 9, it
can be observed that at any point of time the real power requirement of the AC load connected to the hybrid
generation system is satisfied. Note that, the difference betweenthe reference powerand the output power of the WECS is more pronounced at higherpower output. This is expected; as the output power increases correspondingly powerlosses in the interfacing components between the hybrid generation system and the load(e.g. the transmission line and the power electronic interfacing) are also increased.
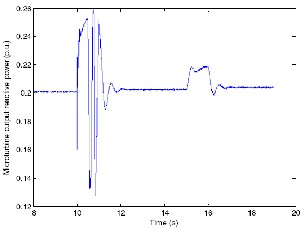
Figures 10 and 11 show the output reactive power variations of the MTG andWECS, respectively, for the given wind conditions shown in Figure 7. It was noted in [7], that the SEIG (of the WECS) fails to self-excite if the reactive power provided by the excitation capacitor is not sufficient to satisfy the combined reactive power requirement of the induction generator and inductive component of the AC load (if there is any). Consequently, in the hybrid generation system, the reactive power requirements are met by the MTG system and the SEIG supplies the active power whenever there is sufficient wind (with the presence of power
Fig 10. MTG system output reactive power variations with wind.
Figure 10 shows that the MTG system meets the reactive power needed by the AC load (0.2 p.u.). The reactive power output from the WECS (Figure 11), as explained in the above paragraph, remained at zero (followedQref=0) following a disturbance in the wind after short transient periods.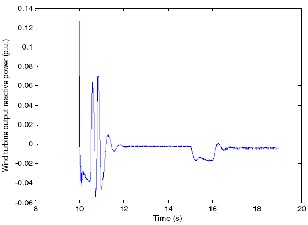
Fig 11.W ECS output reactive power variations with wind.
IJSER © 2012 http://www.ijser.org
The research paper published by IJSER journal is about The Modeling of a Hybrid Wind-Microturbine Generation System 6
ISSN 2229-5518
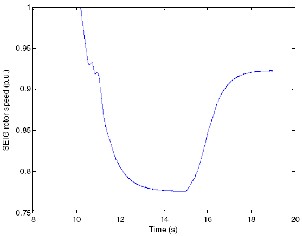
Fig 12.Fuel demand signal of the microturbine.
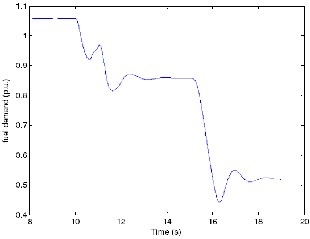
Figure 12 shows fuel consumed by the microturbine for the applied load conditions. It can be observed that the fuel demand signal is slightly higher than 1.p.u. when operating at full load. This is possible as the microturbine tries to meet the losses associated with power electronics interface. The fuel demand signal is about 0.85 p.u. at 0.315 p.u. load and drops to 0.52 p.u. after t=15 seconds, as the power produced by the WECS increases with increased wind velocity.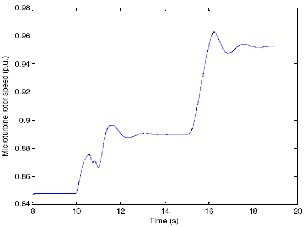
Figures 13 and 14 show the rotor speed variations of the microturbine and theSEIG, respectively.
Fig 14.SEIG rotor speed variations.
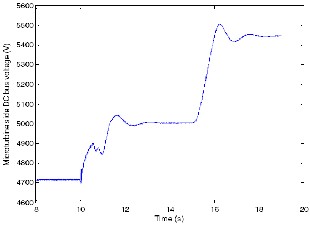
Figure 15 shows the variation of the DC bus voltage at the output of the 3-phase rectifier on the MTG side (Figure 2). The DC bus voltage increases form 4720 volts to 5000 volts as the load demand reduces from full load (0.4 p.u.) to 0.315 per- unit. Also, it can be seen that as the microturbine rotor speed (Figure 13) increases form 0.92 p.u. to 0.95 p.u., the DC bus voltage increases from 5000 volts at 0.315 p.u. load to 5450 volts at a decreased load demand of 0.14 p.u.
Fig 13.Microturbine rotor speed variations.
The microturbine rotor speed (Figure 13) has a value of
0.85 p.u. (1 p.u.= 70000rpm) at full load and increases as the
load demand on the MTG system decreases.
Correspondingly, the speed of the SEIG (Figure 14) during
same time period is 1 p.u. (base speed =1500 rpm) as it is rotating freely under no-load conditions. At t=10 seconds, the
WECS is connected to the hybrid generation system. As a result, the WECS starts supplying the AC load and the rotor speed drops from 1.p.u. to 0.775 per-unit. As the wind input increases from 9 m/s to 12 m/s (Figure 7), turning the wind turbine blades at a faster rate and as a result, the rotor speed increases to 0.92 per-unit. This rise in rotor speed results in increased power output (Figure 9), which causes a further decrease in the power requirement from the MTG system. As a result the microturbine rotor speed increases to 0.95 p.u. (Figure 13).
Fig 15.Variation of DC bus voltage on the MTG side.
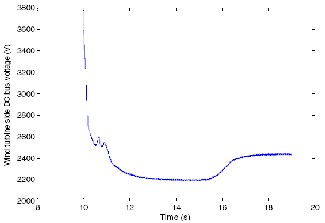
Fig 16.Variation of the DC bus voltage on the W ECS side.
IJSER © 2012 http://www.ijser.org
The research paper published by IJSER journal is about The Modeling of a Hybrid Wind-Microturbine Generation System 7
ISSN 2229-5518
Figure 16 shows the variation of the DC bus voltage on the WECS side of the hybrid generation system (Figure 1). The DC bus voltage decreases form 3800 volts to 2200 volts when the load demand increases from no-load to 0.085 p.u. with a rotor speed equal to 0.775 p.u. (Figure 14). At t=15 seconds, with an increase in the wind speed then rotor speed increases and correspondingly (the output voltage and thereby) the DC bus voltage of the WECS increases to 2450 volts. Unlike microturbine, here we can see that the voltage is greatly dependent on rotor speed, which is in turn based on the wind speed, and the load.
Figures 17 and 18 show the voltage levels of the hybrid generation system at the output terminals of power electronics interface1 and power electronics interface2, respectively (Figure 1).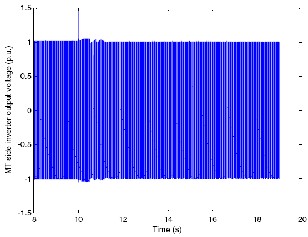
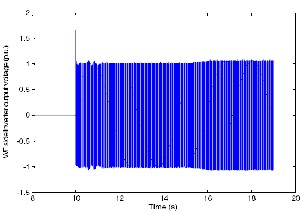
Fig 17.MTG side inverter output voltage.
is connected to the system at t=10 seconds. After t=10 seconds, the voltage and frequency levels remained the same irrespective of the variations in the DC bus voltages (Figures
15 and 16), rotor speeds (Figures 13 and 14), except that the WECS side inverter is slightly higher than 1 p.u. at higher power output (at wind velocity of 12m/s).
The wind velocity remained constant at 14m/s, until t=14 seconds and decreased to a final value of 12m/s at t=15 seconds. This change in wind velocity is shown in Figure 19. To begin with the MTG system is supplying the total load demand of (0.4+j0.2) per-unit. At t=10 seconds the WECS is connected to the MTG system.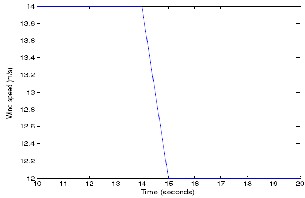
Fig 19. W ind input to the hybrid generation system.
The real power outputs of the MTG system and the WECS for the above mentioned wind and load conditions are shown in Figures 20 and 21, respectively. These figures demonstrate the ability of the MTG system acting as a backup generator for the WECS, as explained in the following paragraph.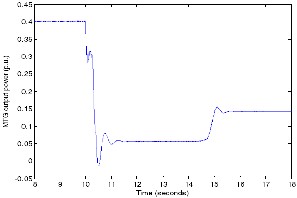
Fig 18. W ECS side inverter output voltage.
The above figures show that the output voltages at the terminals of the 3-phase inverters of the MTG system and the WECS are maintained at the same level of 1.p.u. at all times, with the exception of small disturbances during load switching. This demonstrates the ability of the power electronics interfacing (Figure 2) to maintain the inverter output voltage at the prescribed levels of voltage and frequency (60Hz). Figure 17 shows the voltage level on the MTG side, along with the transients when it is connected to the WECS. Figure 18 voltage level, on the WECS side, when it
IJSER © 2012
Fig 20. MTG system real power output variations with wind.
http://www.ijser.org
The research paper published by IJSER journal is about The Modeling of a Hybrid Wind-Microturbine Generation System 8
ISSN 2229-5518
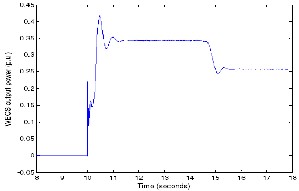
Fig21. W ECS real power output variations with wind.
Figure 20, shows the decrease in real power output of the MTG system from 400kW to about 50 kW when WECS starts supplying the load at t=10 seconds. At a wind velocity of
14m/s the wind turbine has the capability to produce its rated output, 370 kW. Considering the losses, associated with the wind turbine, SEIG and the power electronic interfacing, the net output at the SEIG output terminals is about 350 kW. So, together the MTG and the WECS supply 400 kW power to the load with most of the load demand met by the WECS. At t=15 seconds, with reduced wind input, the output of the WECS falls to about 260 kW and the MTG picks up the remaining load of 140 kW.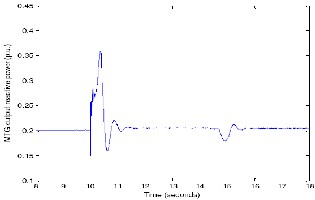
Fig 22.MTG system reactive power variations with wind.
Figure 22 shows the reactive power supplied by the MTG system to the load. It can be observed from the figure that the entire reactive power is supplied by the MTG system as the reactive power output from the WECS follows its reference value which is zero (Figure 23). The MTG system output shows a transient when the WECS is connected, but otherwise remains fairly constant.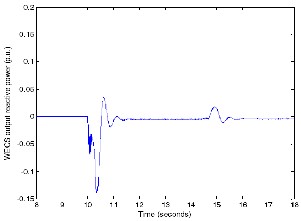
Fig 23. W ECS reactive power variations with wind.
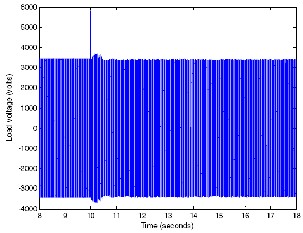
Fig 24.Voltage at the load terminals.
Figure 24, shows the voltage at the AC load terminals. It can be observed that the voltage matches well with the voltage reference (2400 volts RMS), and remained constant, except for a switching transient at t=10 seconds.
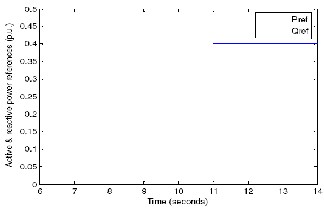
In this case, the input wind velocity remained constant at
9.3 m/s and the load demand changed from (0.25+j0.1) per-
unit to (0.4+j0.2) per-unit at t=11 seconds, as shown in Figure
25. Initially, the MTG system is supplying the total load
demand; the WECS is connected in parallel to the MTG
system at t=10 seconds. The step change in load is applied at
t=11 seconds, without giving much time for the wind turbine output to reach a steady state value.
IJSER © 2012 http://www.ijser.org
The research paper published by IJSER journal is about The Modeling of a Hybrid Wind-Microturbine Generation System 9
ISSN 2229-5518
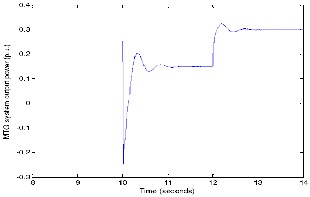
kW to 400 kW at t=11 seconds, the microturbine picks up the additional load and its output reaches a final value of 300 kW. During the same period, as the wind velocity remained constant, the WECS output remained constant (Figure 27) at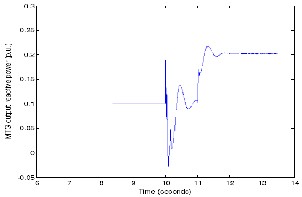
100 kW.
Fig 25. Load demand of the hybrid generation system.
The real power outputs of the MTG system and the WECS for the above mentioned wind and load conditions are shown in Figures 26 and 27, respectively. These figures demonstrate the ability of the hybrid system in power management, as explained in the following paragraph.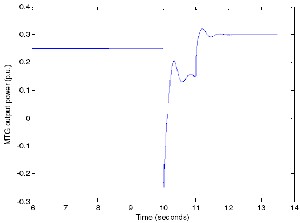
Fig 26.MTG system real power output variations with load.
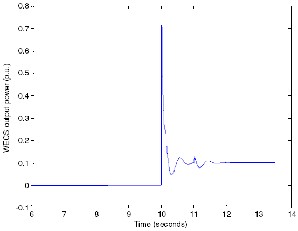
Fig 27. W ECS real power output variations with load.
Figure 26, shows the decrease in real power output of the MTG system from 250kW to about 150 kW when WECS starts supplying the load at t=10 seconds. At the wind velocity of
9.3m/s, the wind turbine has the capability to produce an output power of 100kW. As load demand increases from 250
Fig 28.MTG system reactive power variations with load.
Figure 28 shows the reactive power supplied by the MTG system to the load. TheMTG system reactive power outputremains constant at 0.1 p.u. until t=11 seconds,except for the transients at the instants of switching of WECS and load, and then rises to0.2 p.u. to pick up the reactive power demand of the load. The WECS output reactive power output (Figure 29) reaches its reference value equal to zero after the load switching transients.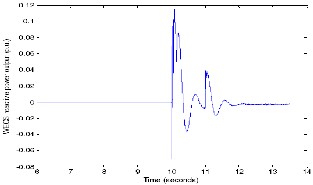
Fig 29. W ECS reactive power variations with load.
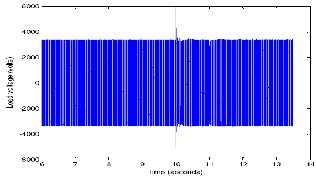
Fig 30.Voltage at the load terminals.
Figure 30, shows the voltage at the AC load terminals, which is at its reference value of 2400 volts (RMS),
IJSER © 2012 http://www.ijser.org
The research paper published by IJSER journal is about The Modeling of a Hybrid Wind-Microturbine Generation System 10
ISSN 2229-5518
irrespective of the changing load conditions except for a switching transient at t=10 seconds.
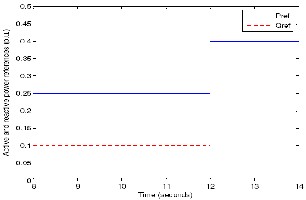
This case is similar to the case 3 except that the wind turbine output is allowed to reach a steady state value, before applying additional load on the hybrid generation system. The input wind velocity remained constant at 9.3 m/s and there is a step increase in the load demand at t=12 seconds as shown in Figure 31.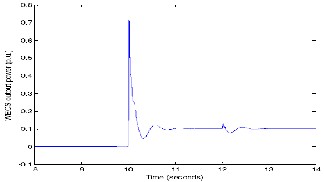
Fig 32.MTG system real power output variations with load.
Fig 31. Load demand of the hybrid generation system.
The real power outputs of the MTG system and the WECS for the above mentioned wind and load conditions are shown in Figures 32 and 33, respectively.
Figure 32, shows the decrease in real power output of the MTG system from 250kW to about 150 kW when WECS starts supplying the load at t=10 seconds as the wind turbine output at the wind velocity of 9.3m/s is 100 kW. As load demand increases from250 kW to 400 kW at t=12 seconds, the microturbine picks up the additional load and itsoutput reaches a final value of 300 kW. During the same period, as the wind velocityremained constant, the WECS output remained constant (Figure 33) at 100 kW.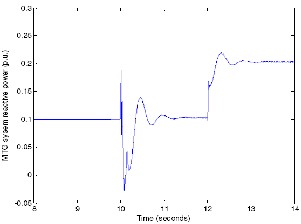
Fig 34.MTG system reactive power variations with load.
Figures 34 and 35 show the reactive power supplied by the MTG system and the WECS, respectively. These figures show that the MTG system contributes the total reactive power requirements of the load, and the WECS (Figure 35)
Fig33. W ECS real power output variations with load.
follows its reactive power reference which is set at zero. The MTG system reactive output remains constant at 0.1 p.u. until t=12 seconds, except for the transients at the instants of switching of WECS and load, and then rises to 0.2 p.u. following the load demand.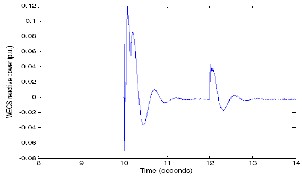
Fig 35.W ECS reactive power variations with load.
IJSER © 2012 http://www.ijser.org
The research paper published by IJSER journal is about The Modeling of a Hybrid Wind-Microturbine Generation System 11
ISSN 2229-5518
Microturbine Power Generation System”masters thesis in electrical engineer- ing, Montana State University, Bozeman, Chap 5, July 2005.
Fig 36.Voltage at the load terminals.
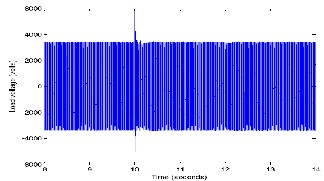
Figure 36, shows the AC load terminal voltage in volts. The voltage at the load terminals matches well with its reference value of 2400 volts (RMS), irrespective of the applied load conditions, except for the switching transient at t=10 seconds.
A Simulink based computer simulation model of a hybrid generation system comprised of a wind energy conversion system and a microturbine generation system is presented. This model is used to evaluate the performance of the proposed stand-alone hybrid generation system with varying wind speeds and different load conditions. A dq-transformed power electronic controller is employed to regulate the output voltage and frequency throughout the period of operation. Simulation results indicate that the proposed model has the ability to meet both real and reactive power requirements of the load, maintaining prescribed values of voltage and frequency, with the help of the power electronic controls.
[1] M.F.Gillie and W.E.Leithead “Operation and regulation of a wind and gas
virtual power plant,” in 17th intl. conf. Electricity Dist., Barcelona, May 2003.
[2] MATLAB/Simulink SimPowerSystems Documentation. Available:
[3] http://www.mathworks.com
[4] C. Wang, M. H. Nehrir and H.Gao, “Control of PEM Fuel Cell Distributed Generation Systems,” IEEE Transactions on Energy Conversion, Vol 21, No.2, June 2006.
[5] Paul.C.Krause, Oleg Wasynczuk and Scott D. Sudhoff, Analysis of Electric
Machinery, IEEE Press, 1994, ch. 3-4.
[6] J. D. Glover, M.S. Sarma, Power System Analysis and Design, 3rd Edition, Wadsworth Group. Brooks/Cole, 2002.
[7] G. Ofualagba and E.U. Ubeku, “Wind Energy Conversion System-Wind Turbine Modeling” Proceedings of IEEE Power & Energy Society 2008 Gen- eral Meeting, pp 1-8, Pittsburgh, July 2008.
[8] G. Ofualagba and E.U. Ubeku “The Analysis and Modeling of a Self-Excited
Induction Generator Driven by a Variable Speed Wind-Turbine” Published in the Book-Fundamental and advanced topics in wind power, InTech, Croa- tia, chap 11, pp249-268, June 2011.
[9] G. Ofualagba“ The Modeling and Simulation of a Microturbine Generation System” International Journal of Scientific & Engineering Research., Vol. 3, Issue 2, Feb. 2012.
[10] S. R. Guda, “Modeling and Power Management of a Hybrid Wind-
IJSER © 2012 http://www.ijser.org
International Journal of Scientific & Engineering Research Volume 3, Issue 6, June-2012 12
ISSN 2229-5518
IJSER ©2012 http //www IJSer org