.The " incidence matrix " I(G) is the n x m matrix in which the entry in row i and and column j is 1 if vertex i is incident with edge j and 0 otherwise.
A graph on sphere S2 is defined as
International Journal of Scientific & Engineering Research, Volume 5, Issue 7, July-2014 1588
ISSN 2229-5518
S. Nada (1) , E. El-Shafey (2)
Abstract: In this paper, we will introduce new type of graphs on the sphere and explain the properties of this graph. The incidence and adjacent matrices will be defined for this graph. Some differences between this new graph and the normal graph will be discussed.
Keywords: Adjacency, Graph, incidence, matrix, sphere
—————————— ——————————
An abstract graph G is a diagram consisting of a finite non- empty set of the elements called vertices denoted by V(G) together with a set of unordered pairs these elements called edges and denoted by E(G) . The set of vertices of the graph G is called the vertex set of G and the list of edges is called the edge list of G [2, 3]. Let v and w be
two vertices of a graph, if v and w are joined by an edge e, then v and w are said to be adjacent. Also, v and w are said to be incident with e, and e is said to be incident with v and w. [1 , 4 , 5].
If G be a graph without loops, with n- vertices labeled
matrix in which the entry in row i and column j is the number which denotes the adjacent of a vertex v i with vertex v j . let G be a graph without loops, with n-vertices labeled 1,2,3,…..,n and m- edges labeled 1,2,3,…...,m
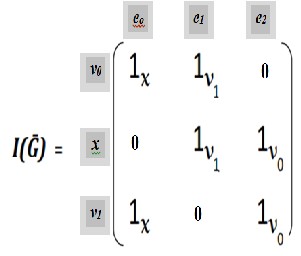
.The " incidence matrix " I(G) is the n x m matrix in which the entry in row i and and column j is 1 if vertex i is incident with edge j and 0 otherwise.
A graph on sphere S2 is defined as ![]() where
where ![]() is a set of vertices on a geodesic, Ē is the set of edges e i є Ē, ei determined by three vertices in one specific direction clockwise or anti-clockwise.
is a set of vertices on a geodesic, Ē is the set of edges e i є Ē, ei determined by three vertices in one specific direction clockwise or anti-clockwise.
Now, we will get more close to some kinds of graphs on spheres and see some of their properties . Also the matrices which represent this new graph . Let us start with the following definition:
A graph G = ( V(G) , E(G) ) consists of two finite sets:
V(G), the vertex set of the graph , often denoted by just V ,
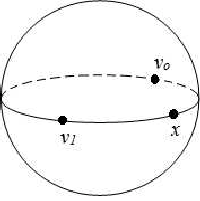
.Such that each edge e in E is assigned by three vertices in clockwise direction. SeeFig.(1).
i.e eo = {vo , x ,v1 }, e1 ={ x ,v1 ,vo }, e2 ={v1 ,vo , x}
Fig.(1) represent the new graph Ḡ where the vertex set V(Ḡ) is the set ( vo , x , v1 ) and the edge-list E(Ḡ) consists of the pairs (vo v 1 )x , ( xvo ) v1 , ( v1 x )v0 where (vo v1 )x denote the edge between the two vertices vo , v1 along x . And, ( x vo )v1 denote the edge between the two vertices x
,vo along v1 and so on.
![]()
![]()
V(Ḡ)= {vo , x , v1 }
and
E(Ḡ)={eRoR= (vRoR , x ,vR1R ), eR1R=( x ,vR1R,vRoR), eR2R=(vR1 R,vRoR , x ) }
= { eRoR= ( vRoRvR1R )Rx R, eR1R= ( x vRoR )Rv1R , eR2R= ( vR1R, x )RvoR}
which is a nonempty set of elements called vertices, and
={ eo
, e1 , e2 }
E(G), the edge set of the graph, often denoted by just E,
which is a possibly empty set of elements called edges
R R R R R R
IJSER © 2014 http://www.ijser.org
International Journal of Scientific & Engineering Research, Volume 5, Issue 7, July-2014 1589
ISSN 2229-5518
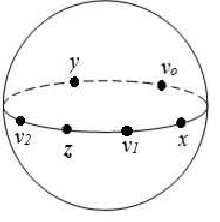
Our work should be either in clockwise direction or anticlockwise direction one way is isomorphic, hence
There is an isomorphism between the clockwise movement in any simple graph on a sphere and anticlockwise movement.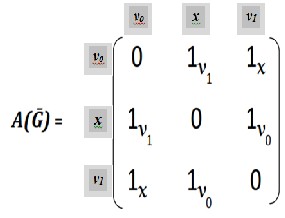
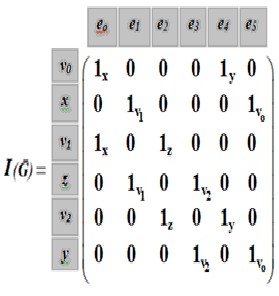
V(Ḡ) = {vo , x , v1 , z , v2 , y}
and
E(Ḡ) ={eo = {vo , x ,v1 }, e1 ={ x ,v1 , z }, e2 = { v1 , z , v2 },
e3 = { z , v2 , y }, e4 = { v2 , y , vo } , e5 = { y , vo , x }}
E(Ḡ) = { eo =( vo v1 ) x , e1 = ( x z ) v1 , e2 =(v1 v2 )z , e3 = ( z y )v2 ,
e4 =( v2 vo )y , e5 = ( y x ) vo }
={ eo , e1 ,e2 , e3 , e4 , e5 }
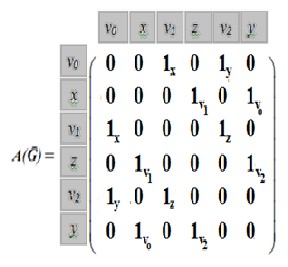
 and the adjacency will be in the form:
![]()
ns the two vertices are the ends of the edge
where 1a the two vertices are the ends of the edge along vertex a.
IJSER © 2014 http://www.ijser.org
International Journal of Scientific & Engineering Research, Volume 5, Issue 7, July-2014 1590
ISSN 2229-5518
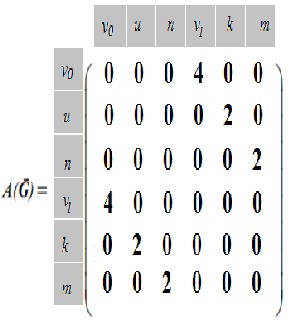
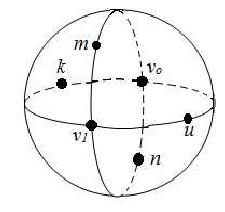
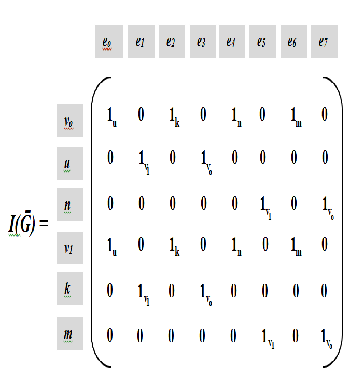
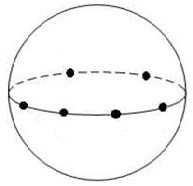
Fig. 3 Consist of two great circles intersect by two vertices vo and v1 and u, n, k, m are the via vertices.
V(Ḡ) = {vo , u, n, v1 , k , m}
![]()
![]()
E(Ḡ)= { ( vo , u , v1 ), ( u , v1 , k), ( v1 , k ,vo ), ( k , vo , u ),
( vo , n , v1 ),( n , v1 , m), ( v1 , m , vo ), (m, vo , n ) }
= {eo , e1 , e2 , e3 , e4 , e5 , e6 , e7 }
IJSER © 2014 http://www.ijser.org
International Journal of Scientific & Engineering Research, Volume 5, Issue 7, July-2014 1591
ISSN 2229-5518
An edge of a graph that joins a vertex to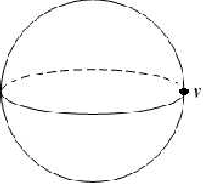
It self is called a loop. See Fig.(3.2.a)
• It is a graph which contains only isolated nodes “Vertices ”, i.e. the set of edges in a null graph is empty. See Fig.(3.1.a).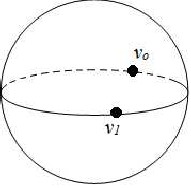
• We may have null graphs either with two points or more . i.e. E = ɸ See Fig.(3.1.b).
• It’s possible to draw infinite number of loops on the sphere
.All loops are isomorphic in geometric sense.
• In similar normal graph it is possible to draw infinite
number of loops at a single point .
• In two different points on the sphere we can draw two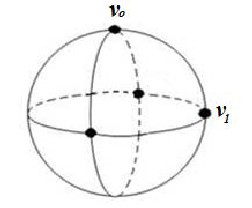
loops and these two loops intersect in exactly two points or no. See Fig.(3.2.b)
IJSER © 2014 http://www.ijser.org
International Journal of Scientific & Engineering Research, Volume 5, Issue 7, July-2014 1592
ISSN 2229-5518
• An edge in the new graph is the curve passing through three vertices.
• There is only one great circle can pass through two certain points on the surface of the sphere.
• Any two great circles intersect in two points.
• Multigraph cannot be applied on the surface of the sphere,
because only one great circle can pass through two certain
points.
• The largest circle in the sphere is called a great circle.
• The radius or (diameter) of the great circle is the radius or
(diameter) of the sphere.
• Every great circle divides the sphere into two equal parts called hemispheres.
• A section in a sphere,S2, is a S1 curve and in case the radius
of the section S1 is the same of the radius of the sphere,S2 . Then this section is a great circle .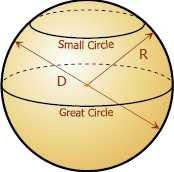
• Sections of the sphere that do not contain a diameter are called small circles. See Fig (5.1)
Simple graphs can be drawn on small circles and in these cases isomorphism transforms these graphs into great circles.
Now we defined the new graph it is the graph on the elliptic geometry by using the projection we can make a comparison between the graph on the sphere and the normal graph by using the Stereographic projection.![]()
V (X, Y, Z ) v (x, y, 0)
Let S 2 denote the unit sphere X 2+Y 2+Z 2 = 1 in the R3
and let N= (0, 0, 1) denote the “north pole” of S 2.
Given a point P ∈ S 2, other than N , then the line connecting N and P intersects the Xy - plane at a point P`.
![]()
The stereographic projection is the map:
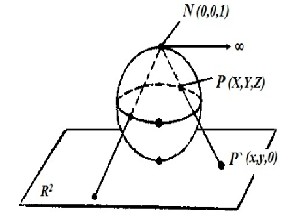
The fact that the points P, P' and N all lie on one line can be expressed by the fact that
( X ,Y ,Z -1) = t ( x , y ,1) (1)
for some non-zero real number t .
Here P = ( X ,Y , Z ) , N ( 0, 0, 1 ) and P' ( x , y , 0 ) the sphere of radius 1 with center at the origin is given by :
G ={( X ,Y ,Z ) X 2 + Y 2 + Z 2 =1 } (2)
An arbitrary plane in three-space is given by :
AX + BY + CZ + D = 0 (3)
for some arbitrary choice of the constants A , B , C and D. Thus a circle on the unit sphere is any set of points whose coordinates simultaneously satisfy equations (2) and (3). The idea of the proof is that one can use equations (2) and (1) to write X as a function of t and x , Y as a function of t and , y and Z as a function of t and to simplify equation (3) to an equation in x and y . Since the equation in x and y
IJSER © 2014 http://www.ijser.org
International Journal of Scientific & Engineering Research, Volume 5, Issue 7, July-2014 1593
ISSN 2229-5518
so obtained is clearly the equation of a circle in the xy ـ plan, the projection of the intersection of (2) and (3) is a circle.
(𝑪 + 𝑫)𝑸 + 𝟐𝑨𝒙 + 𝟐𝑩𝒚 + 𝑫 − 𝑪 = 𝟎
Equation (1) says that X = tx , Y = ty , and 1- Z = t .
𝑸 = 𝒙𝟐
+ 𝒚𝟐![]()
set 𝑸 = 𝟏+𝒛
𝟏−𝒛
and verify that
![]()
![]()
𝒛 = 𝑸−𝟏 , 𝟏 + 𝑸 = 𝟐
(𝑪 + 𝑫)( 𝒙𝟐 + 𝒚𝟐 ) + 𝟐𝑨𝒙 + 𝟐𝑩𝒚 + 𝑫 − 𝑪 = 𝟎 (4)
𝑸+𝟏 𝒕
and 𝑸 = 𝒙𝟐 + 𝒚𝟐
If P lies on the plane,
𝑨𝑿 + 𝑩𝒀 + 𝑪𝒁 + 𝑫 = 𝟎
![]()
𝑨𝒕𝒙 + 𝑩𝒕𝒚 + 𝑪 𝑸−𝟏 + 𝑫 = 𝟎
𝑸+𝟏
to the normal graph by stereographic projection.
[1] Wilson R.J.: Watkins J.J.: Graph, an introductory approach, a first course in discrete mathematics. Jon Wiley and
Sons Inc, Canada, 1990.
[2] Giblin P.J.: Graphs, surfaces and homology, an introduction to
![]()
𝟐𝐀𝐱
𝐐 + 𝟏
𝟐𝐁𝐲![]()
+
𝐐 + 𝟏
+ 𝐂![]()
𝐐 − 𝟏
𝐐 + 𝟏
+ 𝐃 = 0
algebraic topology. Champman and Hall Ltd, London 1977.
[3] Wilson R.J.; Introduction to graph theory. Oliver and Boyed,
𝟐𝑨𝒙 + 𝟐𝑩𝒚 + 𝑪( 𝑸 − 𝟏) + 𝑫(𝑸 + 𝟏) = 𝟎
Since the coefficients of the 𝒙𝟐 and the 𝒚𝟐 terms are the
same, this is the equation of a circle in the plane.
This shows that the new graph in which the edge is determined by three vertices turned
Edinburgh 1972.
[4] El-Ghoul M, Adel Sh. : retraction of the new graph , Journal of
Applied Science Research in Pakistan 2009
[5] White A.T.: Graphs. :groups and surfaces. Amsterdam, North- Holland Publishing Company 1973.
IJSER © 2014 http://www.ijser.org