International Journal of Scientific & Engineering Research Volume 4, Issue3, March-2013 1
ISSN 2229-5518
Surface and Sub surface runoff estimation by us- ing RS & GIS – A case study of Srikakulam coastal belt. A.P
Dr.G.VenkataRao, P.Kalpana, P.V.V.Satyanayana
Abstract— Land Use/Land Cover has become crucial basis work to carry out the prediction to the dynamical change of the land use prevention to natural disaster, environmental protection, land management and planning. At the same time it provides one of the basic inputs for the production more complex information on other themes (soil erosion, pollutant emission into the air by the vegetation, runoff etc.). This study is a step forward towards having a better planning of environmental policy as well as better Land Use/Land resources management. The study area (Gara Mandal, Srikakulam District) of 70 sq km was selected for investigation. In the Land Use/Land Cover map, several major units such as; Built-up Area, Roads, Hills, Agricultural Lands, Streams, Tanks, Sand Features, Salt pan Areas have been recognized. From the generated areas, the surface runoff volume was calculated by empirical relation and 15 year’s rainfall data of the study area. It concluded that the volume of rainfall water infiltrates in to the aquifer is 59.23% and the remaining 40.76% of water is surface runoff.
Index Terms— land use/ land cover, surface runoff, remote sensing, catchment area, environmental protection, GIS
—————————— ——————————
1 INTRODUCTION
Water is the most important natural resource and is vital for all life on earth. The well-being and the development of our society are dependent on the availability of water. This most precious resource is sometimes scarce, sometimes abun- dant and is always very unevenly distributed, both in space and time. For instance, Europe and Asia together have only
27% of world’s fresh water though they accommodate about
76% of the world’s population.
The oceans which cover 71% of the surface area of earth and which have an average depth of 3.8 km hold as large as 97% of the earth’s water, while 2% is-frozen in ice caps [1-2]. The deep ground water accounts for 0.31%. This 99.31% of water is of no use to man. The’ remaining 0.69% which is of the order of 4.374 x 10⁶ km3 represents the fresh water resources with which the man has to dea.Surprisingly, at any given instant of time rivers and lakes hold only 3% of fresh water (or 0.0093% of total wa-
————————————————
Dr G. Venkata rao,Department of Civil Engineering, GMR Institute of Tech- nology, GMR Nagar- Rajam-India, E-mail: venkataraocbit@gmail.com
P.Kalpana, Department of Chemical Engineering, GMR Institute of Technolo- gy, Andhra Pradesh-India, E-mail: kalpanamtech@yahoo.com
P.V.V.Satyanarayana, Department of Civil Engineering , Andhara Universi- ty College of Engineering, , Andhra Pradesh-India,)
ter) and atmosphere holds only 0.3% of fresh water (or
0’.00093% of total water).
The global annual precipitation [ 3,4 ]and evaporation are estimated to be equal and each being of the order of 100 cm. Therefore the global average annual precipitation volume (based on surface area of 510 x 106km3 of the earth whose mean radius is 6370 km) works out to 510000 km3. The average moisture available in the atmosphere at any time is only 12900 km3. This implies that the entire atmospheric moisture must be replaced approximately 40 times every year. Interpreted in another way, the average residence period of the moisture in the atmosphere is only slightly more than 9 days.
STUDY AREA
Srikakulam district is one of the important districts of Andhra Pradesh bordering Orissa on one side and Bay of Bengal on other side. Srikakulam is a classical tourist destination having Buddhist locations at Salihundam and Danthapuram, Pilgrim Centers like Srikurmam, Srimukhalingam, Arasaval- li, Ravivalasa etc besides beach locations like Barua and Kalin- gapatnam. Srikakulam is part of Kalinga Dynasty having rich historical background. People from Eastern states of India like Orissa, West Bengal may love to visit these places.
IJSER © 2013 http://www.ijser.org
International Journal of Scientific & Engineering Research Volume 4, Issue3, March-2013 2
ISSN 2229-5518
Srikakulam is situated in north of AP. In the olden days some part of this district were ruled by Chedidianasti kings, Satava- hana kings and Golkonda novabs. Srikakulam district was formed on August 15th, 1950. Srikakulam is also known to many as Uttarandhra and Kalingandhra. Srikakulam, the northernmost district in the Andhra Pradesh, was a part of Vishakapatnam District till it was bifurcated in 1950. Srikaku- lam town, the headquarters of the district, is located on the east bank of the River Nagavali.
The district is long 192kms. This is higher than the other dis-
tricts. Cold climate also is more when compared to other dis- tricts. Summer is from February to June middle. Then south- west monsoon enters and continues till the middle of October. The weather is pleasant from December to February.
Study area is selected around 70 sq. kms along the
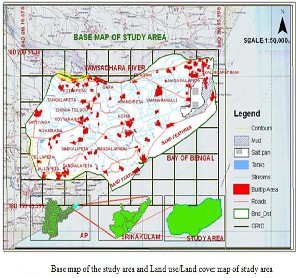
coastal belt of Srikakulam between 180 20’51” and 18015’49” Latitudes and 840 0’16.67” and 840 7’59” Longitudes, this area is located in between two rivers, i.e. Vamsadhara and Nagaval- li as shown in Figure 1
Figure.1
RUNOFF ESTIMATION Mean Annual Rainfall
Mean annual rainfall is usually calculated by taking the simply average of total rainfall of several consecutive years. Great variations are recorded in the annual rainfall at the same station, and a rainfall record for considerable no of years is necessary tom get reliable estimate of mean annual rainfall at any place. The greater is the number of years considered, the more correct will be the mean value so obtained. From the study of rainfall records of a large number of different places extending over many years, it has been found that 35years rainfall records are required for reliable estimate of the mean
annual rainfall of any place.
Run-off Coefficient
In the present study the runoff estimation was calculated by using the Run-off formulae and tables. The run-off and the rainfall can be inter-related by run-off coefficient, by the ex- pression.
R = k P
Where R =run-off in cm, P = rainfall in cm, k =run-off coeffi- cient.
The run-off coefficient naturally depends upon all the factors
which affect the [5-7] run-off. This method is used only for small water, control project, and should be avoided for the analysis of major storms.
Estimation of Surfaces areas using GIS Software. Production of GIS output
The digitized eight layers from satellite digital image have been imported to Arc Info as coverage [8,9]. Each layer has been edited, cleaned and topology was created. Later each layer was projected to polyconic projection. Then land use land cover of study area was prepared I Arc GIS at scale
1:50000.
RESULTS
Observe the rain fall intensity variation from year to year
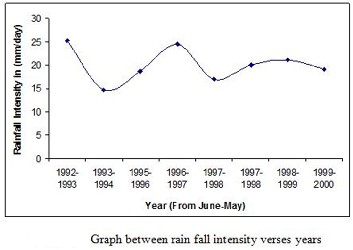
The Rainey days, rain fall depth and the rain fall in- tensity is tabulated in Table 1 and Graph 1 is prepared be- tween the rain fall intensity in the y-axis and the years in the x-axis as shown in figure 2.0
IJSER © 2013 http://www.ijser.org
International Journal of Scientific & Engineering Research Volume 4, Issue3, March-2013 3
ISSN 2229-5518
Figure-2

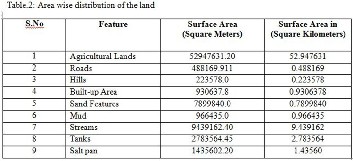
Determination of ground surfaces features
Determine the surface areas of Agricultural Lands, Roads, Hills, Built-up Area, Sand Features, Mud, streams and tanks by using the 1965 topo sheets of Survey of India. The study revealed that these eight categories of land together occupied area of 70.00sq.Km. area wise distribution of the land under each one of the seven categories and percentage of each class or category are given in Table 2. From the observations it is clear that Agricultural Land occupies around 75% of total study area. And streams occupy around 13.5% of total study area. And remaining areas occupies around 1% of total study area.
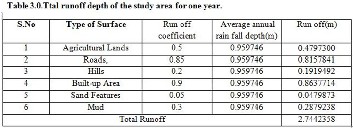
Run off calculations
The total runoff depth is estimated by using the run off coeffi- cient values of different payment and Average annual rain fall depth of the selected area of coastal of srikakulam and is pre- sented in Table 3.
Run off (m) = Run off coefficient x rain fall depth (m)
The total runoff depth of the study area is estimated as
2.7442358m.
Estimation of runoff volume in the study area.
The run off volume is estimated by using surface area and run off depth and are presented in Table 4.
Run off volume = surface area x run off depth
The run off volume in the study area is estimated at
27385602.73 m3

Volume of water infiltrate in to the ground
The volume of water infiltrate in to the ground estimated by sustracting the runoff volume from rain fall volume.
Infiltrate in to the ground = total volume of Runoff - total vol- ume of Runoff
67182220.0 - 67182220.0 = 39796617.27 m3.
Volume of water infiltrate in to the ground (Neglecting evapo- ration losses and Minor losses) is estimated at 39796617.27 m3.
Conclusions
From the observations of Land use and Land cover, it is identi- fied that Agricultural Land occupies around 75% of total study area. And streams occupy around 13.5% of total study area, Tanks having an area of around 3.85% of the study area, And remaining features i.e. Roads, Hills, Built-up Area, Sand Fea- tures, Mud and salt pan having an area of around 1% of total study area.
The surface runoff volume is 27385602.73 m3 and the total rain fall volume in the study area is 67182220.0 m3. Finally the Volume of water Infiltrates in to the Aquifer is
39796617.27 m3.
ACKNOWLEDGEMENT
The Authors (investigators of the project) are thankful to the Department of Science and Technology (DST), Ministry of Sci- ence & Technology, New Delhi, Government of India, for granting necessary financial assistances to carry out this re- search project work.
REFERENCES
IJSER © 2013 http://www.ijser.org
International Journal of Scientific & Engineering Research Volume 4, Issue3, March-2013 4
ISSN 2229-5518
[1] Dunin, F. “Infiltration: Its simulation for field conditions.” Facets of hydrology, J.
C. Rodda, ed., Wiley, New York, 199–227, 1976.
[2] Espinoza, R. D. “Infiltration.” Groundwater engineering handbook, J. W. Delleur, ed., CRC LLC, Boca Raton, Fla, 1999.
[3] Ayrol, D. E., and Parlange., J.-Y. “Vertical infiltration into a layered soil.” Soil
Sci. Soc. Am. Proc., 37, 673–676, 1973.
[4] Rao, K.V., Bhattacharya, A.K. and Mishra, K., Runoff estimation by curve number method- case studies, Journal of Soil and Water Conservation. 40 :1-7 ,
1996.
[5] Espinoza, R. D. “Infiltration.” Groundwater engineering handbook, J. W.
Delleur, ed., CRC LLC, Boca Raton, Fla, 1999.
[6] Field R., Masters H. and Singer, M., An Overview of Porous Pavement
Rsearch, Water Resources Bulletin. Vol. 18 no. 2, pp. 265-270, 1982.
[7] Pratt C.J., Wilson S. and Cooper P. Source controle using constructed pervi- ous surfaces hydraulic, structural and water quality performance issues. CIRIA C582, 2002.
[8] Smith D.R. Evaluation of concrete grid pavements in the United States, Proc.
2nd Int. Conf. on Concrete Block Paving, Delft, pp. 330-336, 1984.
[9] Sharma, D. and Kumar, V. Application of SCS model with GIS data base for estimation of runoff in an arid watershed. Journal of Soil and Water Conserva- tion: 30 (2) :141-145, 2002.
IJSER © 2013 http://www.ijser.org