International Journal of Scientific & Engineering Research, Volume 5, Issue 5, May-2014 1373
ISSN 2229-5518
Study a Model Close to the Actual Cycle
Of Internal Combustion Engines M. Hamdy.A1, O. M. E. Abdel-Hafez, Hany A. Mohamed and A. M. Nassib Mechanical engineering Department, Faculty of Engineering, Assuit University
1 m.hamdy02009@gmail.com
Abstract— Using simulating models for internal combustion engine cycles is appreciable method for predicting the engines performance for saving the time and the effort. Fuel air ratio and gas variable specific heats are taken into account in the present work. Irreversibilities resulted from nonisentropic compression and expansion processes and heat loss through the cylinder wall are also taken into account in the present model. Finite difference method is applied for estimating the states through the heat addition process and compression and expansion strokes. Computer program is designed for the model includes all the above conditions and the cycle parameters. Experimental test was carried out on a single cylinder constant speed diesel engine to verify the obtained results using the present model. The obtained results show a good agreement with the corresponding data recorded from the experimental tests. Other Comparisons are done with the corresponding results of an actual engine model results which published for gasoline and diesel engines. The obtained results from the model show a good agreement with the corresponding data in researches. The effect of the cycle parameters (inlet air temperature, inlet air pressure, air fuel ratio, compression ratio, and compression and expansion efficiencies) on the power output and thermal efficiency are studied. It is shown that the power and thermal efficiency increase with the increase of compression and expansion efficiencies, inlet air pressure and compression ratio. For gasoline engine cycle the optimum value of compression ratio is around10 to be prevented from detonation, and for diesel the optimum value is around 20. W ith increasing air fuel ratio the power output increase then decrease and the thermal efficiency increases, so the optimum value of air fuel ratio for gasoline engine cycle is around 13 and for diesel around 15. W ith increasing the inlet air temperature the power output and thermal efficiency are decreased. The Specific Fuel Consumption decreases with increasing power for the two cycles. The benefit from the research is that optimum parameters for operating are predicted by the model. The obtained results would be more realistic and implemented on the performance evaluation of the internal combustion engine.
Keywords: Otto, Diesel, Dual, Irreversible, Combustion, Performance, heat transfer
—————————— ——————————
Most studies of the internal combustion engines use air- standard power cycle model to perform their thermodynamics analyses. Such models are used in order to show the effect of varying engine parameters and conditions on the performance, this type of analyses provide exceedingly generous predictions of the performance for the heat engines. In order to provide a more reasonable estimation of the performance potential of a real cycle, one should take the main irreversibilities and the heat losses into account to be more
————————————————
• M. Hamdy.A is currently pursuing masters degree program in mechanical power engineering in Assuit University, Egypt,.
E-mail: m.hamdy02009@gmail.com
• O. M. E. Abdel-Hafez , professor in mechanical engineering
,Assuit University, Egypt. E-mail: omrhafz@aun.edu.com
• H. A. Mohamed , professor in mechanical engineering ,Assuit
University, Egypt. E-mail: hah@aun.edu.com
• A. M. Nassib, assistant professor in mechanical engineering
,Assuit University, Egypt. E-mail: amnassib@yahoo.com
close to practice. Heat transfer losses through the cylinder wall were considered by[1]. Also the effect of heat transfer losses and compression and expansion efficiencies on the performance were studied [2 -4]. Zhao et al. [5] studied the influence of the multi-irreversibilities mainly resulting from the adiabatic processes, finite time processes and heat loss through the cylinder wall on the performance of the cycle. In the studies of air-standard power cycles [1-4]the working fluid was only assumed to be air. In [1-3] the air was assumed as the working fluid as an ideal gas with constant specific heats. Many researchers studied the performance of air standard power cycles by assuming variable specific heats as [4, 6, 7]. The influence of the compression and expansion efficiencies, variable heat capacities, heat loss and other parameters on the performance of the cycle are studied in[8]. An irreversible Dual cycle model which is more closed to practice is established in [9]. In the irreversible Otto cycle model, the non- linear relation between the specific heat of the working fluid
and its temperature, the friction loss computed according to
IJSER © 2014 http://www.ijser.org
International Journal of Scientific & Engineering Research, Volume 5, Issue 5, May-2014 1374
ISSN 2229-5518
NOMENCLATURE | |
Alphabetic symbols a Moles of gas at the end of process b Moles of gas at the beginning of process C v Specific heat at constant volume(J/kmol.K) E(T) Internal energy( J/kmol) ∆h Enthalpy(J/kmol) M Number of moles of mixture nRl RNumber of moles of specimen l P Pressure(Pa) PR m RMean effective pressure (Pa) P΄ Dimensionless power output QR gained RActual heat released (J) ∆𝑄𝑐𝑜𝑚𝑏𝑢𝑠𝑡𝑖𝑜𝑛 Total heat released by combustion(J) QR vs RHeat of reaction(J/kmol) R General gas constant(J/kmol.K) r Crank radius(m) T Temperature(K) TRo RAverage cylinder wall temperature(K) V Stroke volume(m3) Rs R W Work done (J/kmol) X Carbon atoms in fuel | XB Mass fraction burned Y Hydrogen atoms in fuel z Number of moles of fuel |
Alphabetic symbols a Moles of gas at the end of process b Moles of gas at the beginning of process C v Specific heat at constant volume(J/kmol.K) E(T) Internal energy( J/kmol) ∆h Enthalpy(J/kmol) M Number of moles of mixture nRl RNumber of moles of specimen l P Pressure(Pa) PR m RMean effective pressure (Pa) P΄ Dimensionless power output QR gained RActual heat released (J) ∆𝑄𝑐𝑜𝑚𝑏𝑢𝑠𝑡𝑖𝑜𝑛 Total heat released by combustion(J) QR vs RHeat of reaction(J/kmol) R General gas constant(J/kmol.K) r Crank radius(m) T Temperature(K) TRo RAverage cylinder wall temperature(K) V Stroke volume(m3) Rs R W Work done (J/kmol) X Carbon atoms in fuel | Greek symbols β Constant related to heat transfer (J/ K) ηRcomp RCompression efficiency(%) ηRexp RExpansion efficiency(%) ηRth RThermal efficiency(%) Ѳ Crank angle |
Alphabetic symbols a Moles of gas at the end of process b Moles of gas at the beginning of process C v Specific heat at constant volume(J/kmol.K) E(T) Internal energy( J/kmol) ∆h Enthalpy(J/kmol) M Number of moles of mixture nRl RNumber of moles of specimen l P Pressure(Pa) PR m RMean effective pressure (Pa) P΄ Dimensionless power output QR gained RActual heat released (J) ∆𝑄𝑐𝑜𝑚𝑏𝑢𝑠𝑡𝑖𝑜𝑛 Total heat released by combustion(J) QR vs RHeat of reaction(J/kmol) R General gas constant(J/kmol.K) r Crank radius(m) T Temperature(K) TRo RAverage cylinder wall temperature(K) V Stroke volume(m3) Rs R W Work done (J/kmol) X Carbon atoms in fuel | Abbreviations (A/F) Actual air fuel ratio (A/F)Rst RStoichiometric air fuel ratio B.D.C Bottom dead center DSFC Dimensionless specific fuel consumption RPM Revolution per minute T.D.C Top dead center |
the mean velocity of the piston, the internal irreversibility
described by using the compression and expansion efficiencies and the heat transfer loss are described in[10]. Taking the real mixture of air and fuel will be more realistic.
In the present study the effects of irreversibilities resulting from compression and expansion efficiencies and heat transfer loss through cylinder walls are taken into account. Also mixture of air and fuel with variable specific heats are considered for the present study. Finite difference method is applied for estimating the performance parameters. Computer program is designed for studying the effect of various parameters on the performance characteristics of the internal combustion engines under different operating conditions. The results are verified with an experimental work and published results.
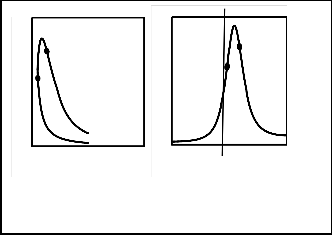
The actual internal combustion engine models are used to perform thermodynamics analysis for the internal combustion engines as shown in Fig. 1.The internal combustion engine cycle can be approximated into three processes. The first is a compression process (1-2), when the piston moves from the bottom dead center, B.D.C, to the starting of combustion process, implements a compression stroke. The second process, at which combustion is occurred, is equivalent the heat additions in
heat engines after the starting point of combustion (point
2) passing through the top dead center ,B.D.C, reaches to the end point of combustion point(3). Then expansion (3-
4) will be occurred when the piston moves to the B.D.C,
producing the expansion stroke process. The last process is the exhaust stroke, which is equivalent to the heat
rejection in the heat engine.
IJSER © 2014 http://www.ijser.org
International Journal of Scientific & Engineering Research, Volume 5, Issue 5, May-2014 1375
ISSN 2229-5518

Qcombustion - iWi+1 = E(T i+1)- E(Ti) + iQi+1 (1)
3 Where i Qi+1 , i Wi+1 ,E(T) and Qcombustion are heat
3 transfer loss, work done, internal energy, and heat of reaction,
2
Considering a pure air is compressed from B.D.C to T.D.C
4 4 with no fuel burn. Equation (1) becomes:
1
1
volume,V
B.D.C
Crank ange,Ѳ
T.D.C
-iWi+1 = E (T i+1) - E (Ti) +iQi+1 (2)
Fig: 1. P-V and P-Ѳ schematically diagram for the internal
Due to small difference in the P through each element, the
work term can be approximately estimated from:
RiRWRi+1 actual = (RPR i + RPR i+1)
![]()
(𝑉𝑖+1−𝑉𝑖)
2𝜂𝑐
R (3)
The piston is moved from the bottom dead center, B.D.C,
to the top dead center, T.D.C, making compression stroke. To calculate the changes in the pressure P and temperature T states through the compression stroke, the stroke volume is subdivided into a number of intervals with every crank angle as in Fig. 2. A smaller increment in the interval volume gives a more accurate calculation. The subscripts i and i+1 are used to define the states at the beginning and the end of the volume element.
The cylinder volume can calculated at every crank angle from the relation [11]
V=VC + AREA*(rcosѲ +l2-r2 sin2 Ѳ)1/2
Where ηc is the compression efficiency.
At the beginning of the compression stroke the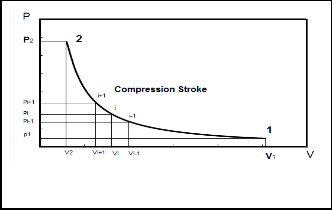
cylinder wall has a high temperature compared with the inlet air temperature then the air temperature is gradually increased to a temperature higher than the wall temperature before the end of the compression stroke. So very small amount of heat transfer loss is expected through the compression stroke and thusiQi+1 can be neglected.
Fig. 2. P-V schematically diagram of the compression stroke.
Where V, VC, l, r, AREA and Ѳ are the cylinder volum e atany crank angle, clearance volume, connecting rod length, crank radius, cylinder area and crank angle.
At the beginning and end of each interval, the first law of thermodynamics is applied.
Then equation (2) becomes:
E(T Ri+1R) - E(TRiR)+ (PRiR + P Ri+1R)
![]()
𝑉𝑖+1−𝑉𝑖
2𝜂𝑐
= 0 (4)
IJSER © 2014 http://www.ijser.org
International Journal of Scientific & Engineering Research, Volume 5, Issue 5, May-2014 1376
ISSN 2229-5518
In this expression the initial conditions at subscript i,
l=s
j=7
is known but P i+1 and Ti+1areunknown. Then If T i+1 is known, the E(T i+1) can be calculated. Firstly, applying the
equation of state on states i and i+1:
E(T)= R � nl [(∑j=1 Ul,j Tj ) − T]
l=1
(7)
l=s
j=7
dE (T)
R � Jnl [(∑j=1 Ul,jTj−1)−1]
𝑃𝑖+1 =
![]()
𝑉𝑖
𝑉𝑖+1
![]()
𝑑𝑖+1
* 𝑑𝑖
*𝑃𝑖 (5)
![]()
Cv (T) =
dT
l=1
j=N
�l=1 nl
(8)
Equations (4), (5) can’t be solved analytically, so numerical solution must be applied, and the numerical method may be the Newton-Raphson method as shown:![]()
(T i+1 ) n =(T i+1 )n-1 – f(E)n−1
f′(E)n−1
Where n-1, n are the previous trail and the current trail of
temperature.
Where f(E)from equation (4) :
𝑉𝑖+1−𝑉𝑖
The coefficients Ul,J are given by Benson and Whitehose[12],Where nl and N are the number of moles of gas l and number of mixture specimens , respectively.
Then Ti+1 and Pi+1are calculated from equations (4) and
(5) respectively. Also E(T)and Cv (T)are calculated from
equations (7) and( 8) respectively. These calculations are
repeated until the change in bothTi+1 and Pi+1 values are too
small.
And the previous steps for all the intervals are applied on the compression process.![]()
f(E)= E(T i+1) - E(Ti)+ (Pi + P i+1)
![]()
𝑑𝑑(𝐸 )
f ’(E)=
= 0
2𝜂𝑐𝑜𝑚𝑝
𝑑𝑑
![]()
f ’(E 𝑑 𝐸(𝑑)𝑖+1
When the ignition begins the combustion process is
𝑑𝑑
dE(T)i
subdivided into number of intervals of crank angle according
to the combustion duration, the beginning of the interval is, i,![]()
Since
dT
= 0, the work term is not very sensitive toT i+1
and the end is, i+1.
As shown below in equations (7), (8) that:
dE(T)i+1
Since the volume is constant, no work is done, dW= 0, the first law for the combustion period becomes:![]()
f ’(E) =
dT
=M * Cv (T)i+1
Since the volume is constant, no work is done, dW= 0, the
Where M is the number of moles of mixtures
So
first law for the combustion period becomes:
(T i+1 )n =(T i+1 ) n-1 –![]()
f(E)n−1
M ∗ Cv (Ti+1 )n−1
-P (V
i+1
–Vi ) = E (T
i+1
) -E(Ti ) - ∆Q
𝑐𝑜𝑚𝑏𝑢𝑠𝑡𝑖𝑜𝑛
+ ∆Q
𝑙𝑜𝑠𝑠
(9)
Ti+1 is estimated for the first trail by assuming an isentropic change from the state conditions at Ti as![]()
Ti+1 = Ti (
![]()
)k−1 =Ti (
)R/Cvi
(6)
Where ∆Q𝑐𝑜𝑚𝑏𝑢𝑠𝑡𝑖𝑜𝑛 R
and ∆Q𝑙𝑜𝑠𝑠
are heat of combustion in
Vi+1
Vi+1
interval and heat transfer loss.
The internal energies E(T i ), E(T i+1 ) and the specific heats Cv (Ti), Cv(T i+1 ) are calculated from the gas composition and temperatures as in [12].
The last equation is solved by the Newton-Raphson method until it satisfied, as shown:
f(E)n−1
(T i+1 )n =(T i+1 ) n-1 –![]()
f′(E)n−1
IJSER © 2014 http://www.ijser.org
International Journal of Scientific & Engineering Research, Volume 5, Issue 5, May-2014 1377
ISSN 2229-5518
Where n-1, n are the previous trail and the current trail of temperature.
Where f(E)from equation (9) :
f(E)= E(T i+1 )- E(Ti) - ∆Qombustion + ∆Qloss = 0![]()
df(E)
f ’(E)=
dT
f ’(E dE(T)i+1
Thus, a1 = XBi *z*x, a2 = XBi * z*(y/2), a3 = z*(x+y/4)
*((A/F)/(A/F)st - XBi ), a4 =b4, a5 =0
Where XB is mass fraction burned at every crank angle Ѳ and given by a Weibe function and is used to represent the mass
fraction burned versus crank angle:![]()
XB=1-exp[-d(Ѳ−Ѳ𝑜 )g+1]
∆Ѳ
![]()
dT
dE(T)i
∆Qloss
Where Ѳ is the crank angle, Ѳo is the start of combustion, ∆Ѳ is
the total combustion duration, XB changes from zero to 1,d![]()
Since
dT
![]()
= 0,
dT
has very small value so it can be neglected
and g are adjustable parameter. Varying d and g changes the
shape of the curve significantly. Actual mass fraction burned
As shown in equations (7),(8) that:
curves have been fitted with d=5 and g =2[11, 13, 14, 15].
f ’(E) =![]()
dE(T)i+1
dT
=M * Cv (T)i+1
The numbers of moles of gases Mi and Mi+1 before and after combustion interval are given by:
Were M is the number of moles of mixtures
So
Mi=∑l=5 b l , Mi+1 =∑
l=5
l=1 R
(T i+1 )n =(T i+1 )n-1 –
![]()
f(E)
M ∗ Cv (Ti+1)n−1
To get the heat released by combustion at constant volume:
Ti+1 is estimated for the first trail as:![]()
T i+1=T + 1∗z∗Qvs
i M ∗ CvTi
∆Qcombustion= ∆ a1 CO2 + ∆ a2 H2 O– ∆b5 C x Hy - ∆
So the actual heat gained at the process (Qgained) is:
(11)
b3O
The heat of combustion for each interval period can be estimated according to the combustion equation:
∆b5 Cx Hy + ∆ b 3 O2 +∆ b 4 N2 → ∆ a1 CO2 + ∆a2 H 2 O+
∆Qgained = ∆Qcombustion −∆Qloss
∆Qloss=β (T i +T i+1 - 2To)
(12)
∆ a4 N2 (10)
Where ∆, bi and ai are the difference between numbers of moles of this interval and the previous one, number of moles of specimen at the beginning of the interval and number of moles of specimen at the end of the interval.
At the beginning of the combustion interval the numbers of moles are b1 , b2 ,b3 , b4 and b5for substa(n13ce) s CO2 , H2 O, O2 , N2 and CxHy respectively:
Thus, b1 = XBi-1 *z *x, b2 = XBi-1 * z *(y/2), b3 = z*(x+y/4)
Where β, T i ,T i+1 and To are constant related to heat transfer, temperature at the beginning of combustion interval, temperature at the end of combustion interval and average cylinder wall temperature respectively.
And for the general cases β/CV>0 [5, 8], and always β/CV=
0.1[5].
And the final pressure can be given from this relation [11, 16]:
*((A/F)/(A/F)st - XBi-1 ), b4 = 3.76 b3, b5 = (XBi - XBi-1 ) * z![]()
![]()
dQ dV k
=P
![]()
dP 1
+ V
(13)
dt dt k−1
dt k−1
At the end of combustion period, at the temperature T2, the numbers of moles are a1, a2, a3, a4 and a5for substances CO2, H2O, O2, N2 and CxHy respectively:
And k=1.4 – 7.18 ×10⁻⁵ × T[11]
Then Ti+1 and Pi+1 are calculated from equations (9) and
(13) respectively. Also E(T)and Cv(T)are calculated from
IJSER © 2014 http://www.ijser.org
International Journal of Scientific & Engineering Research, Volume 5, Issue 5, May-2014 1378
ISSN 2229-5518
equations 7 and 8 respectively. These calculations are repeated![]()
![]()
dQ dV k
=P
![]()
dP 1
+ V
(16)
until the change in bothTi+1 and Pi+1 values are too small. dt
dt k−1
dt k−1
And the previous steps for all the intervals of combustion duration.
And k=1.4 – 7.18 ×10⁻⁵ × T[11]
And dQ =0 at the expansion stroke.
Equations (14), (15) can’t be solved analytically, so numerical solution must be applied, and the numerical method may be the Newton-Raphson method as shown.![]()
(T ) =(T ) – f(E)n−1
i+1 n i+1 n-1 f′(E)n−1
Where n-1, n are the previous trail and the current trail of temperature.
Where f(E)from equation (15) :
f(E)= E(T i+1 ) - E(T i )+dW= 0
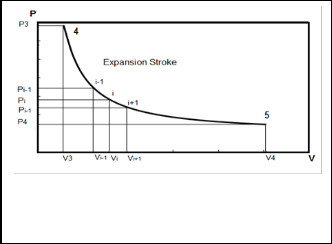
Fig. 3. P-V schematically diagram of the expansion stroke.
f’(E)=![]()
df(E)
dT
f’(E)=![]()
dE(T)i+1
dT
![]()
Sinc dE(T)i
dT
= 0, the work term is not very sensitive to T i+1
As shown in equations (7), (8) that:
f’(E) =![]()
dE(T)i+1
dT
=M ×Cv (T)i+1
During the expansion stroke the composition of the cylinder contents is constant and the calculations are the same as compression stroke but from end of combustion bottom dead center, except for the work.
𝑃𝑖 +𝑃𝑖+1
Where M is the number of moles of mixtures![]()
(T ) =(T ) – f(E)n−1
i+1 n i+1 n-1 M × Cv (Ti+1)n−1
Ti+1 is estimated for the first trail by assuming an isentropic
change from the state conditions at Ti as![]()
dW=PdV=
(𝑉𝑖+1 − 𝑉𝑖 ) ∗ 𝜂𝑒 (14)
T = T ( Vi
k−1
Vi R/Cvi
So equation (2) becomes:![]()
i+1
i )
Vi+1
![]()
=Ti ( )
Vi+1
E(T i+1) - E(Ti)+dW = 0 (15)
In this expression the initial conditions at subscript i,
is known but P i+1 and T i+1 areunknown. Then if T i+1 is known, the E(T i+1 ) can be calculated.
The pressure can be given from the relation [11, 16]
Then Ti+1 and Pi+1are calculated from equations (15) and (16)
respectively. Also E(T) and Cv (T)are calculated from equations
7 and 8 respectively. These calculations are repeated until the
change in both Ti+1 and Pi+1 values are too small.And the
previous steps for all the intervals of the expansion process.
Work and thermal efficiency of the cycle:
IJSER © 2014 http://www.ijser.org
International Journal of Scientific & Engineering Research, Volume 5, Issue 5, May-2014 1379
ISSN 2229-5518
The work done in the cycle is obtained by summing the work
terms for each step in compression and expansion processes and the mean effective pressure is:
MODEL
COMPAR ISON BETWEE N
EXPERIM ENTAL RESULTS AND PRESENT
![]()
W
Pm=
Vs
where Vs is the stroke volume
The comparison shows that the present model is
Power = cycle work* (RPM /60)/2000 Kw
To make the power dimensionless:
P′= Power/ (mair ×Cp×ΔT)
The thermal efficiency is given by:![]()
W
ηth=
Qvs∗ z
Dimensionless specific fuel consumption:![]()
DSFC= 1
P′×(A/F)
WhereP′ is the dimensionless power.
For verification of the model results, comparison is done with the corresponding results of an actual engine. So an experimental test was carried out on a single cylinder diesel engine (Crossly) excited in heat lab of mechanical engineering department, Assuit University. The main specifications of the tested engine are given in Table 1. Table 2 shows a comparison between the experimental results and the corresponding results obtained from computer program for the present model.
TABLE 1
MAIN SPECIFICATIONS OF THE SINGLE CYLINDER DIESEL ENGINE
(CROSSLY)
TABLE 2:
closed to the experimental data and the deviation is small in the indicated mean effective pressure and power. Therefore the proposed model would be accepted. But for thermal efficiency we find that the present model has higher deviation than the indicated mean effective pressure and power. The deviation between these results can be due to many factors such as efficiency of combustion, value of compression and expansion efficiencies, equation used for heat transfer calculations, value of heat transfer coefficient and errors in measuring instruments.
Comparisons also are done with the corresponding
results of an actual engine model results which published in international researches for gasoline and diesel engines [4, 17]. The main specifications of the tested engines are given in
Table 3. Figures 4, 5 show a comparison between P-V
diagrams and Figures 6, 7show a comparison between P-θ of the published researches results and the corresponding results obtained from computer program for the present model for gasoline and diesel engines.
Figures 4, 5, 6, 7 give comparisons between the corresponding results from the present model and the published researches results for gasoline and diesel engines. The comparison shows that the obtained results from the present model are closed to the published data and the deviation is small. Therefore the proposed model would be accepted. But the present model
Cylinder diameter (m) 0.146 | Engine fuel C12H26 |
stroke (m) 0.279 | Stoichiometric Air fuel ratio 15.121 |
Compression ratio 14.19 | |
Normal rating speed (rpm) 475 |
has deviation on some points in the P-V
IJSER © 2014 http://www.ijser.org
International Journal of Scientific & Engineering Research, Volume 5, Issue 5, May-2014 1380
ISSN 2229-5518
MAIN SPECIFICATIONS OF THE OTTO AND DIESEL ENGINES
60
50
40 present model
30 E. Abu-Nada
20 et al[4]
10
0
0 0.0001 0.0002 0.0003 0.0004
V,m3
100
80
60
40
20
0
and P-θ diagrams, and the deviation is the smallest in the
combustion region.
Fig. 4. P-V diagram Comparison for gasoline engine
Fig

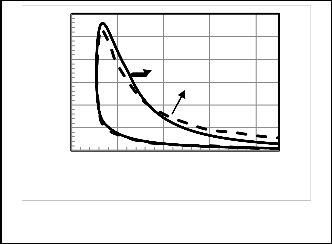
The small deviation between these results can be due
to many factors such as efficiency of combustion, value of compression and expansion efficiencies, equation used for heat transfer calculations, errors in ignition timing, value of heat transfer coefficient and difference in models equations.
TABLE 3:
100
80
60
40
20
0

1
Fi
The proposed model is applied to study the effects of certain parameters on the performance of the internal combustion engines. Using the proposed model, working internal combustion engine cycle types are used under
different operating conditions. A study of results of the two
IJSER © 2014 http://www.ijser.org
International Journal of Scientific & Engineering Research, Volume 5, Issue 5, May-2014 1381
ISSN 2229-5518
engine types is carried out.
The engine performance is presented in a form of relations of the dimensionless power and the thermal efficiency with different parameters. These parameters are inlet air temperature and pressure, heat transfer coefficient, compression and expansion efficiencies,
compression ratio and air fuel ratio and specific fuel consumption. Conditions under which these studies done for diesel and gasoline engines are in table 2 except the focused parameter.
In figure 8 (P-V) diagrams for gasoline and diesel engines
for one state from the model with various compression ratios and the same bore and stroke engine and the same RPM and C10 .8 H18 .7 for diesel and C8 H18 for Otto. In this state air fuel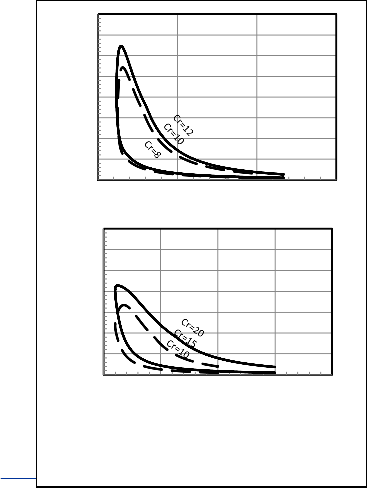
ratios for Otto and diesel are 15, 18 respectively.![]()
![]()
80
70
60 Gasoline Engine
50
40
30
20
10
0
0 4 Cr=V/Vc
8 12
70
![]()
![]() 60
60
50 Diesel Engine
40
30
20
10
0
0 5 10 15 20
IJSER
Fig. 8. P-V diagram of Gasoline and Diesel engines respectively for different compression ratios.
International Journal of Scientific & Engineering Research, Volume 5, Issue 5, May-2014 1382
ISSN 2229-5518
TABLE: 4
CONDITIONS UNDER W HICH THIS STUDY DONE FOR DIESEL AND GASOLINE EXCEPT THE FOCUSED PARAMETER
34.5
34
33.5
33
32.5
32
31.5
300 325 350 375 400
Inlet Air temprature,Tinlet
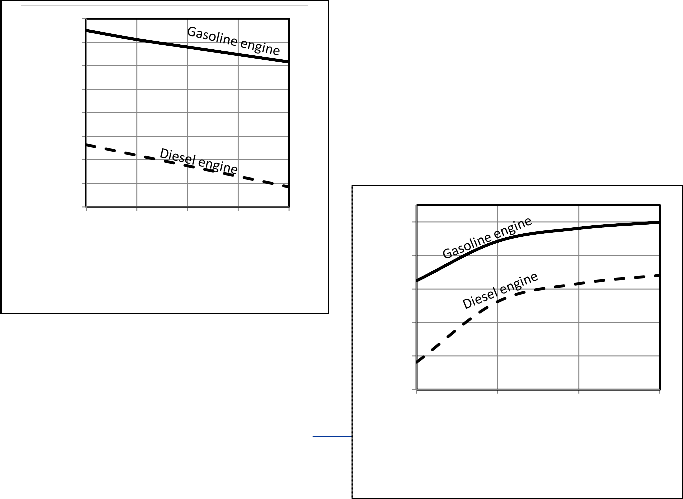
Fig. 10. Effect of inlet air temperature, Tinlet, ˚C, on
thermal efficiency η
Performance
Figures 9, 10 show that when the inlet air temperature increases the power output and thermal efficiency decrease
as in Hou, S.-shyurng[1] as expected.
3.2
3.1
3
2.9
2.8
2.7
2.6
2.5
2.4
300 325 350 375 400
Inlet Air temprature,Tinlet
Performance
3.5
3.3
Fig. 9. Effect of inlet air temperature, Tinlet, ˚C, on
P΄
3.1
2.9
2.7
IJSER ©
2.5
1 2 3 4
Dimensionless Inlet Air pressure,Pinlet
Fig. 11. Effect of inlet air relative pressure, Pinlet, on
power, P΄.
International Journal of Scientific & Engineering Research, Volume 5, Issue 5, May-2014 1383
ISSN 2229-5518
Engine Performance
3.3
3.2
3.1
3
2.9
2.8
2.7
2.6
2.5
0.05 0.1 0.15 0.2
Heat Transfer Coefficient , β/Cv
Fig. 13. Effect of heat transfer coefficient, β, on power,
P΄.
42
40
38
36
34
32
30
1 2 3 4
35
34.5
34
33.5
33
32.5
32
Fig. 12. Effect of inlet air relative pressure, Pinlet,
on thermal efficiency
Figures 11, 12 show that the power output and thermal
31.5
0.05 0.1 0.15 0.2
Heat Transfer Coefficient , β/Cv
efficiency increase with increasing the inlet pressure for the two types as expected [18]. The increasing in thermal efficiency is optimum up to 2 bar. So turbocharging and supercharging is preferred in some cases. So turbo-charging
and supercharging are preferred in some cases.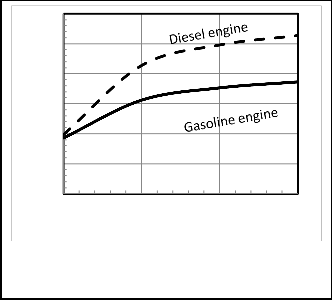
Fig. 14. Effect of heat transfer coefficient, β, on
th l ffi i
IJSER © 2014 http://www.ijser.org
International Journal of Scientific & Engineering Research, Volume 5, Issue 5, May-2014 1384
ISSN 2229-5518
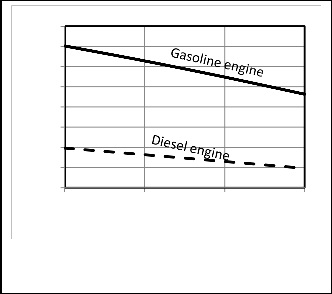
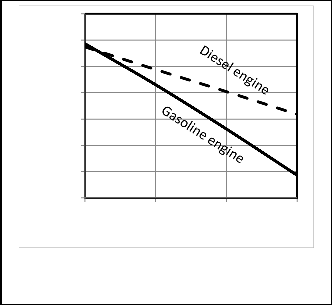
Figures 13, 14 show that the heat transfer coefficient affects the performance of the heat engine. The power and thermal efficiency are decreasing with the increase of heat transfer coefficient. The rate of decreasing of power is larger for Otto cycle than Diesel cycle. This is due to that the Otto cycle has larger maximum cycle temperature, which is consequently increasing the amount of heat loss.
Efficiencies on the Engine Performance
36
35
34
33
32
31
30
29
90 92 94 96 98 100
Compression and Expansion Efficiencies
(ηcomp, ηexp)%
Fig. 16. Effect of Compression and expansion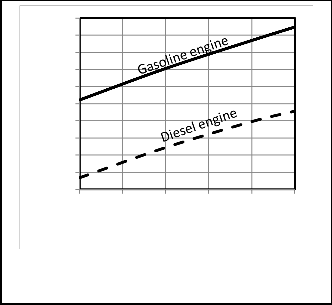
efficiencies, ηcomp,exp , on thermal efficiency ,ηth.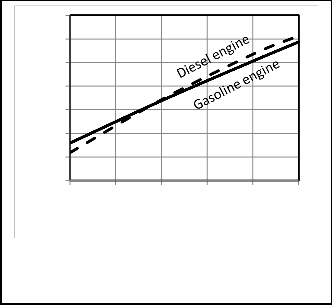
3.3
3.2
3.1
3
2.9
2.8
2.7
2.6
2.5
2.4
2.3
90 92 94 96 98 100
Compression and Expansion Efficiencies
(ηcomp, ηexp)%
Fig. 15. Effect of Compression and expansion
efficiencies, ηcomp,exp , on power, P΄.
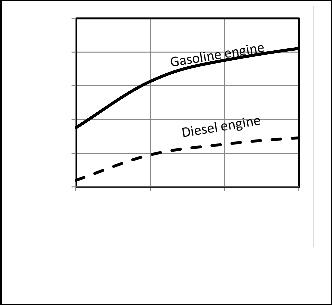
Figures 15, 16 show that the power and thermal efficiency increase with increasing compression and expansion efficiencies for the two types of cycle as expected
Performance
IJSER © 2014 http://www.ijser.org
International Journal of Scientific & Engineering Research, Volume 5, Issue 5, May-2014 1385
ISSN 2229-5518
4.5
4
3.5
3
2.5
2
5 10 15 20
Compression Ratio ,rv
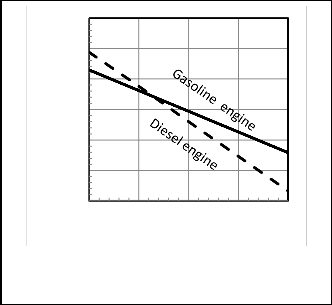
Figures 17, 18 show that with increasing the compression ratio the power output and thermal efficiency increase, but when these values of compression ratio reach high values it increase slowly as shown. For Otto cycle after rv =10 detonation will be done [19]. For diesel cycle, also the power and thermal efficiency increase up to value of compression ratio, rv =20 as
in [19], and the dual cycle is in between. Also, Figure 18 shows
a comparison between ideal thermal efficiency for Otto and diesel cycles, according to the ideal relation of thermal
Fig. 17. Effect of Compression ratio, rv, on power,
efficiency for Otto and diesel, ηotto =1-rv1-γ,
rγ−1
P΄.![]()
ηDiesel =1-rv1-γ*
γ(rc−1)
, where γ,rc are specific heat ratio and
cut-off ratio, and results from the model. It is shown that these values in the ideal cycle are larger than results from model
due to the irreversibilities. And at high values of compression ratios the power output and thermal efficiency decrease as [2,
20].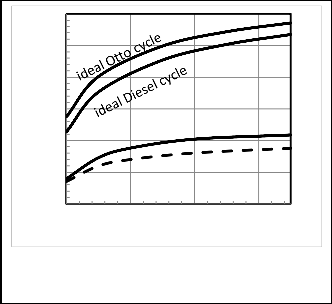
80 4.6 Effect of Air fuel ratio on the Engine Performance
70
60
50
Gasoline engine
40
30 Diesel engine
20
5 15 25 35
3.4
3.2
3
2.8
2.6
2.4
2.2
2
11 13 15 17 19
Air fuel ratio ,A/F
Fig. 18. Effect of Compression ratio, rv, on thermal
efficiency, ηth.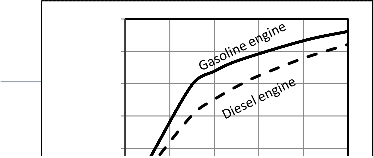
Fig. 19. Effect of Air fuel ratio, A/F, on power P΄.
40
35
IJSER ©
http://www.i 30
25
20
International Journal of Scientific & Engineering Research, Volume 5, Issue 5, May-2014 1386
ISSN 2229-5518
Figure 21 shows that the Specific Fuel Consumption decreases
with increasing power as expected [21, 22].
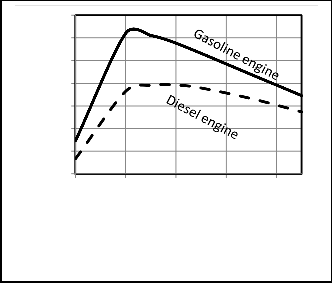
Figure 19, 20 show that the three cycles with increasing air fuel ratio the power output increase to a certain value after which they decrease and the thermal efficiency increase continually as the amount of fuel decrease with increasing the air fuel ratio after this certain value, and for diesel this value is around
15. The optimum value of air fuel ratio for Otto is around 13.
4.7 Effect of Specific Fuel Consumption
An irreversible gas cycle model was done and verification of this model had been done with comparison to experimental results from a single cylinder compression ignition engine. Signed Experimental test was carried out on cylinder constant speed diesel engine to verify the obtained results using the present model. The obtained results show a good agreement with the corresponding data recorded from the experimental tests. Other Comparisons are done with the corresponding results of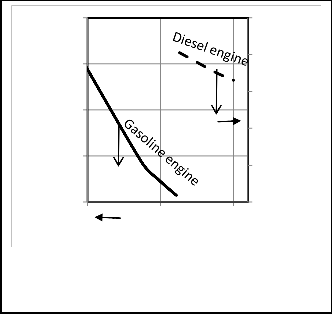
an actual engine model results which published in
0.04
0.035
0.03
0.025
0.02
2 3 4
Dimensionless power,P΄
0.025
0.02
0.015
0.01
0.005
0
international researches for gasoline and diesel engines. Some irreversibilities of internal combustion engine cycles like compression and expansion efficiencies and heat transfer loss had taken into account. Computer program is designed for the proposed model. Effects of some parameters as inlet air temperature, inlet air pressure, heat transfer coefficient, compression ratio, air fuel ratio and compression and expansion efficiencies had studied with numerical examples for the two types of cycles (gasoline and Diesel engines). It is found that the power and thermal efficiency increase with the increase of compression and expansion efficiencies and inlet air pressure. With increasing air fuel ratio the power output
decrease and the thermal efficiency increase to a certain
Fig. 21. Effect of Specific Fuel Consumption, SFC, (kg/ hr), on power, P΄.
value then it decreases, so the optimum value of air fuel ratio for gasoline engine cycle is around 13 and for diesel around 15. With increasing the inlet air temperature and the heat transfer coefficient the power output and thermal efficiency are decreased. With increasing the compression ratio the power output and thermal efficiency increase but for gasoline the optimum value is 10 to be prevent from detonation, and for diesel the optimum value is around
20. The Specific Fuel Consumption decreases with
increasing power.
IJSER © 2014 http://www.ijser.org
International Journal of Scientific & Engineering Research, Volume 5, Issue 5, May-2014 1387
ISSN 2229-5518
[1] S-shyurng.Hou. [2003] “Heat Transfer Effects on the Performance of an Air standard Dual Cycle” Energy Conversion and Management, 45.
[2] J. Chen. [2005] “Optimization Criteria for the Important Parameters of an Irreversible Otto Heat-Engine” Applied Energy 83: 228-238.
[3] Y. Zhao, B.Lin, Y.Zhang, and J. Chen. [2006], “Performance Analysis and Parametric Optimum Design of an Irreversible Diesel Heat Engine” Energy 47: 3383-
3392.
[4] E. Abu-Nada, I. Al-Hinti, A. Al-Sarkhi and B. Akash [2006] " Thermodynamic Modeling of Spark-Ignition Engine: Effect of temperature dependent specific heats "International Communications in Heat and Mass Transfer. 33: 1264-1272.
[5] Y.Zhao and J.Chen.[2006] "An Irreversible Heat Engine Model including Three Typical Thermodynamic Cycles and their Optimum Performance Analysis" International Journal of Thermal Sciences. 46: 605-613.
[6] A. Al-Sarkhi, J.O. Jaber, M. Abu-Qudais , and S.
D.Probert. [2005] "Effects of Friction and Temperature-
dependent Specific-Heat of the Working Fluid on the
Performance of a Diesel Engine "Applied Energy. 83: 153-
165.
[7] Y.Ge, L.Chen, F.Sun and C.Wu.[2004]" Thermodynamic Simulation of Performance of an Otto Cycle with Heat Transfer and Variable Specific Heats of Working Fluid"International Journal of Thermal Sciences. 44: 506-
511.
[8] Y.Zhao andJ.Chen [2007] “Optimum Performance Analysis of an Irreversible Diesel Heat Engine Affected by Variable Heat Capacities of Working Fluid" Energy Conversion and Management. 48: 2595-2603.
[9] YanlinGe, Lingen Chen and Fengrui Sun. [2009] "Finite- time thermodynamic modeling and analysis for an irreversible Dual cycle" Mathematical and Computer Modelling. 50:101-108
[10] Y.Ge, L.Chen and F. Sun.[2007]"Finite-time thermodynamic modeling and analysis of an irreversible Otto-cycle" Applied Energy. 85: 618-624.
fundamentals ’’ first edition, McGrAw-HILL international edition .
[12] Benson and N. D.Whitehose. [2010] "Internal Combustion
Engine" Robert Maxwell, M.C., vol. I,II
[13] J I Ghojel.[ 2010.]” Review of the development and applications of the Wiebe function: a tribute to the contribution of Ivan Wiebe to engine research” International Journal of Engine Research.2: 297-312.
[14] P.A. Lakshminarayanan ,Yogesh V. Aghav. [2010]" Modeling Diesel Combustion " Springer Science + Business Media B.V.
[15] Constantine D. Rakopoulos ,Evangelos G. Giakoumis [2009]“Diesel Engine Transient Operation” Springer- Verlag London.
[16] R.Udayakumar, C. Kasera. [2012]”Combustion Analysis of a Diesel Engine Operating With Performance Improvement Additives “Engineering and Science. 1: 11-
16.
[17] M.Al-Sood, M. Ahmed and Y. M Abdel-Rahim.[2012]” Rapid thermodynamic simulation model for optimum performance of a four-stroke diesel engine” International Journal of Energy and Environmental Engineering. 3: 1-13.
[18] Maher A.R.Sadiq Al-Baghdadi and HarounA.K.Shahad Al-Janabi. [2003]" A prediction study of a spark ignition supercharged hydrogen engine" Energy Conversion and Management.44:3143–3150.
[19] R. Ebrahimi. [2010] "Performance Analysis of a Dual Cycle Engine with Considerations of Pressure Ratio and Cut-Off Ratio" ACTA PHYSICA POLONICA A. 118: 534-539.
[20] Mahmoud Huleihil. [2011] "Effects of Pressure Drops on the Performance Characteristics of Air Standard Otto Cycle" Hindawi Publishing Corporation Physics Research International. 1-7.
[21] H. Sharon, K. Karuppasamy, D.R. Soban Kumar, A.
Sundaresan.[2012]"A test on DI diesel engine fueled with
methyl esters of used palm oil" Renewable Energy. 47:
534-539.
[22] https://www.utexas.edu/research/cem/Green_ship_pag es/electric_load_distribution.html
[11] J.B.Heywood. [1988].’’ internal combustion engine
IJSER © 2014 http://www.ijser.org
International Journal of Scientific & Engineering Research, Volume 5, Issue 5, May-2014 1388
ISSN 2229-5518
IJSER © 2014 http://www.ijser.org
International Journal of Scientific & Engineering Research, Volume 5, Issue 5, May-2014
ISSN 2229-5518
1389
I£ER lb) 2014