International Journal of Scientific & Engineering Research, Volume 4, Issue 7, July-2013 2486
ISSN 2229-5518
Structural, Dielectric and Magnetic Properties of La-M Hexaferrite
Mahadule R# , Arjunwadkar P@ & Mahabole M*
# Department of Applied Physics, SRPCE, Nagpur
@ Department of Physics, Institute of Science, Nagpur
• School of Physical Science, SRTMU, Nanded
Abstract:
The series of samples with chemical composition Cax SryBa1-x-y Fe12-z Laz O19 have been prepared by standard ceramic route. The pellets of 13.18 mm diameter were prepared and sintered at 1430
K in air atmosphere for 72 hr and characterized by using XRD which shows predominant hexagonal magnetoplumbite (M) structure pertaining to space group P63/mmc (No. 194) . The determined mass
density in present ferrite samples was found to vary linearly with sample’s volume, whereas the X-ray density depends on lattice constant and molecular weight of the sample. The computation of porosity has been done by considering bulk and X-ray density of the studied samples. The variations in the values of
lattice parameter were recorded with increasing concentration of La and Ca. The dielectric properties of samples were studied in lower frequency range from 10Hz to 2MHz. The field-dependent magnetic properties of prepared samples were investigated at room temperature.
Keywords: XRD, X-ray density, porosity, Curie temperature
1. Introduction:
Ferrimagnetic oxides or Ferrites as they are usually called, are ceramic ferromagnetic materials which are dark brown or gray in appearance and very hard and brittle in character. In 1952, a new class of ferrites having permanent magnetic properties was discovered. They are called hexagonal ferrites with the formula MFe12 O19 where M is usually barium Ba, strontium Sr, Calcium Ca or Lead Pb. The use of hexaferrites as radar absorbing materials (RAMs) has been widely cited in literature during the last two decades. The crystal structure is complex but it can be described as hexagonal with a unique c axis, which is the easy axis of magnetization in the basic structure. Several studies of the magnetic properties for hexagonal ferrites have been reported [1-4].Li Hong-gui et.al proposed , the increase of La3+ ion in the ferrite samples causes gradual decrease in both specific saturation magnetization (Ms ) and Remanent magnetization (M r ) but an appropriate substitution of ion in Sr hexaferrites causes an increase in magnetic saturation and corcivity which improves hard magnetic property of hexaferrites. In the same way, individual or simultaneous substitution of Ba2+ ions by La3+ can also change the magnetic and dielectric behavior of these materials, allowing their application as RAMs at various frequency. But the combined effect due to substitution of Ca, Sr, Ba hexaferrite to respective properties with rare earth
La3+ ion is the prime focus of present study. Apart from magnetic properties, the effect of frequency,
IJSER © 2013 http://www.ijser.org
International Journal of Scientific & Engineering Research, Volume 4, Issue 7, July-2013 2487
ISSN 2229-5518
temperature and composition on the dielectric behavior offer much valuable information about the localized electric charge carriers which in turn helps to elucidate the mechanisms responsible for charge transport phenomena and dielectric behavior. Various researchers have studied the dielectric and electrical properties of different hexaferrites [5-8]. However, investigations of the substitution effect on the dielectric properties of combined substitution of Ca, Sr, & Ba (CSB) hexaferrite are rare. We selected La3+ ion as partial substitution of Fe3+ because among the lanthenoids La3+ has the largest solubility limit in Ba and Sr hexagonal ferrite as observed by C doroftet & E Rezelscue et al.[9]. Moreover, hexaferrites are of interest not only for their magnetic behavior but also for the dielectric polarization inherent in their structure. In this study, a systematic investigation of the
i. magnetic behavior,
ii. dielectric behavior and
iii. possible polarization mechanisms of rare earth substituted
Cax Sry Ba1-x-y Fe12-z LazO19 (CSBLFO) Hexaferrites were carried out and results are presented here.
2. Experimental Detail :
The synthesis of polycrystalline compounds with chemical formula CaxSryBa 1-x-yFe12-z Laz O19 (CSBFLO) (with x = 0.1, 0.25, 0.4; z = 0.1, 0.2, 0.3 & y = 0.2) was done by using high temperature solid state diffusion reactions. The stoichiometric mixtures of AR grade oxides Fe2O3 , La2O3 , CaO, SrO, and BaO were grounded together in agate mortar in an acetone medium. The synthesis was divided into two
steps:
(i) calcinations at 500 K for 8 h in air followed by mixing and rigorous grinding, and preparation of pellets, and (ii) thermal treatment at 1157 K for 72 hr.
3. Results and Discussion:
3.1 Structural analysis:
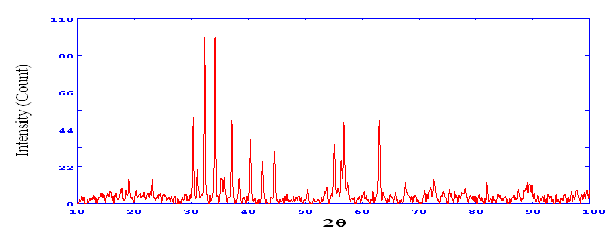
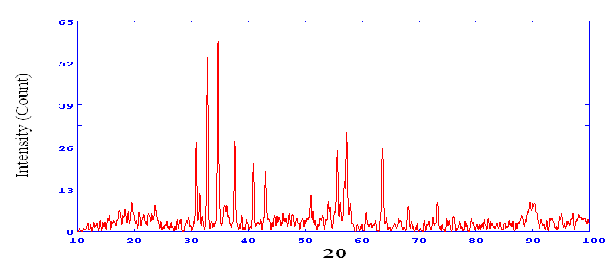
Lattice Constants X-ray diffraction patterns of Cax SryBa 1-x-yFe12-z Laz O19 hexagonal ferrites of three samples under investigation were obtained using Cu-Kα radiation. X-ray Diffraction patterns consist of standard peaks of reflecting planes (006), (107),(114),(201),(108),(220), and (304) corresponding to pure magnetoplumbite phase of hexaferrite family which belongs to the space group P63/mmc (No.194)
referred from standard JCPDS data file. Lattice parameters ‘a’ and ‘c’ were calculated by using
IJSER © 2013 http://www.ijser.org
International Journal of Scientific & Engineering Research, Volume 4, Issue 7, July-2013 2488
ISSN 2229-5518
recommended X-ray diffraction software’s. The variations of lattice constant ‘a’ and ‘c’ of present samples with concentration of rare earth ion revealed that, till La=0.2, ‘a’ remains almost constant and
‘c’ decrease. It may possible, when Sr2+ ions were replaced by La3+ ion of lower radius at 2b or 4f2
octahedral site associates to enlargement in the value of 2b-o2-- 4f2 bond angle. Due to these decrease in lattice constants were observed in hexaferrites. Similar kind of result was observed and explained by D Selfert et.al, C.L.Khobragade et.al, on the basis of replacement of Sr2+ ion by La3+ ion having lower radius which decreases the distance between stacking layer [10-11].
But as the substitution of rare earth ion La becomes greater then 0.2, an abrupt increase in the lattice parameters have been observed (Table1). This increase may attribute to the substitution of divalent cations of higher average ionic radius than Fe2+. Also, substituted rare earth ion La is having greater ionic radius than replaced Fe3+ ion, at preferred octahedral (2a, 2b & 4f2 ) sites among five different sites[12]. It was already coated that the higher concentration of ca>0.25 and rare earth ion La>0.25 causes increase in the impure secondary phases along with α-Fe2 O3 which results in the lower solubility of rare earth ion La in M-structure of hexaferrite. Due to this porosity decreases which may cause individual grain come closer & increase in effective cross-sectional area of grain to grain contact. This results in the greater densification and increases the volume of unit cell and ultimately increasing the lattice constants [11].
Volume of unit cell, bulk density and x-ray density of present samples were calculated using following relations:


Volume of unit cell V = √3 a2c
2
x-ray density Dx =

𝑧 𝑀
𝑁𝐴 𝑉
𝑚
Where M = Molecular weight
Here,

Bulk Mass density DM = Porosity P = 1 - 𝐷𝑀
𝐷𝑋

𝜋 𝑟2 ℎ
Where m= mass of pellet
z is the number of molecules per unit cell
NA is Avogadro’s number,
‘a’ and ‘c’ are the lattice constants obtained from X-ray diffraction analysis and
M is the molecular weight of the sample.
The porosity of the samples was calculated using the relation:

P = (1 - 𝐷𝑀 ) × 100%
𝐷𝑋
IJSER © 2013 http://www.ijser.org
International Journal of Scientific & Engineering Research, Volume 4, Issue 7, July-2013 2489
ISSN 2229-5518
The compositional dependence of the apparent density DM , X-ray density Dx and porosity P are showed in Table 1 for the samples. The increase in density with rare earth content can be attributed to the atomic weight and density of the rare earth ion La (138.9, 6.15 g/ cm3), which are higher than other ions. The replacement of Fe2+ and Fe3+ by divalent ion or La3+ ions in the hexagonal structure leads to a variation in the bonding and consequently interatomic distance and density. The oxygen ions which diffuse through the material during sintering also accelerate the densification of the material. The apparent density of the same sample reflects the same general behavior of the theoretical density Dx . The X-ray density is higher than the apparent density value due to the existence of pores which depends on the sintering condition [13]. This was determined by the method based on Archimedes principle. In the present samples the porosity first increases and then decreases, as the rare earth content increases, reflecting peculiar behavior of density. Hence the occurrence of sudden variation to the higher value of lattice constants can also be due to lower values of X-ray densities for La3+ ions substituted ones.
3.2 Dielectric Measurement :
Dielectric parameters were measured from 10 Hz–2 MHz using a digital LCR-Q meter. The value
of the dielectric constant (ε’) of the compounds is calculated using the formula:

ε’= 𝑪 𝒕 ℇ𝐨𝐀
where,
-12
ℇR 0 = Permittivity of free space equal to 8.854 x 10
C = capacitance of the specimen in cm,
t = thickness of the specimen in cm; and
A= area of the specimen in cm2.
F/m;
The loss tangent (tan δ) is calculated using the relation:
where,
D= the observed dissipation factor,
f = frequency of the applied electric field.
tan δ = Df ,
3.2.1 Compositional variation of dielectric and electric parameters:
IJSER © 2013 http://www.ijser.org
International Journal of Scientific & Engineering Research, Volume 4, Issue 7, July-2013 2490
ISSN 2229-5518
Introduction of rare earth ions to a SrFe12O19 or BaFe12 O19 ferrite increases the value of the dielectric constant. The dielectric constant is increases due to the electronic exchange between Fe2+↔Fe3+ resulting in local displacement of charges to determine the space charge polarization of the ferrites. It is evident from Table 2 that the maximum value of dielectric constant corresponds to sample having rare
earth concentration La=0.2 and such a high value can be explained by considering that it has the maximum number of ferrous ions which are involved in the phenomenon of exchange between Fe2+↔Fe3+ giving rise to maximum space charge polarization.
But as the rare earth concentration crosses La =0.2 , sudden decrease to value of dielectric constant was observed. This may be due to increased grain to grain contact and grain boundaries, results to enlargement in linear densities, and reflects to lower available space in the unit cell for space charge polarization. These attributes to saturation of electronic exchange between Fe2+↔Fe3+ to the corresponding octahedral sites. Hence it may lower down the number of ferrous ion available and interfere to space charge polarization.
Both the dielectric constant and electrical conductivity are basically electrical properties and it has been recognized that the same mechanism viz. exchange of electrons between Fe2+ and Fe3+ is responsible for both the phenomenon. A strong correlation between the conduction mechanism and the dielectric behavior of ferrites has been established by Iwauchi [7] and Rezlescu and Rezlescu [14]. It has been concluded that the electron exchange between Fe2+↔Fe3+ results in the local displacement of charges, which is responsible for polarization in ferrites. But the observed values for conductivity and dielectric constant for higher concentration of rare earth ion La3+ in Table2 suggests some contradiction to the assumption. For higher concentration of rare earth ion along with higher percentage of other divalent ions (Ca, Sr & Ba) causes improvement to secondary phases along with the main phase. Hence value of porosity decreases which corresponds to decreasing grain size and increasing conducting layer of grain boundaries. This effect reflects to lower activation energy which was observed in the present investigating samples with higher concentration of rare earth ion. This showed good agreement with Koops phenomenological theory [8].
3.2.2 Frequency dependence of Dielectric parameter and A.C. conductivity :
The observed variation in dielectric constant with frequency is shown in Fig.2.This concerned with change from negative to positive value of dielectric constant for low frequency, then further decreases and remains constant as frequency shifts to higher value. However, the variation of the dielectric constant with frequency reveals the polarization due to Maxwell-Wagner type space charge
IJSER © 2013 http://www.ijser.org
International Journal of Scientific & Engineering Research, Volume 4, Issue 7, July-2013 2491
ISSN 2229-5518
polarization in agreement with the Koops phenomenological theory [6, 8]. According to these models the dielectric structure is supposed to be composed of the fairly well conducting ferrite grains, separated by a second thin layer of grain boundaries of poorly conducting substances. These grain boundaries could be formed during the sintering process due to the superficial reduction or oxidation of crystallites in the porous materials.
We found that result reflects normal ferromagnetic behavior over the range of frequency with some peculiarity to low frequency range (10-22 Hz). For the purpose concerning this explanation, a simple analysis of data involve in Fig.2 allow us to conclude on the occurrence of a resonance type phenomenon over the higher frequency, but shifting to the lower frequency at room temperature. An author [18] explained similar result to negative value of capacitance concerning low frequency. As it can be concluded from formula provided in section 3.2 that “dielectric constant varies linearly with parallel capacitance” depends on the applied frequency provides a satisfactory support to our result.
The value of a.c.conductivity increases with increasing frequency for all three samples [Fig.3]. This behavior corresponds to normal ferrimagnetic behavior in agreement with the Koops phenomenological theory. Similar result was observed by Anterpreet sing et.al [15] and several investigators [6, 8, 15].
3.3 Magnetic Measurements:
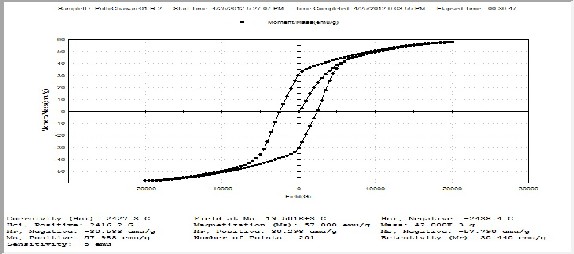
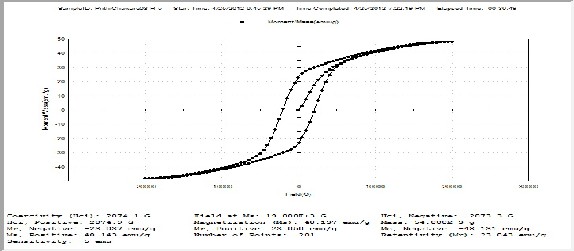
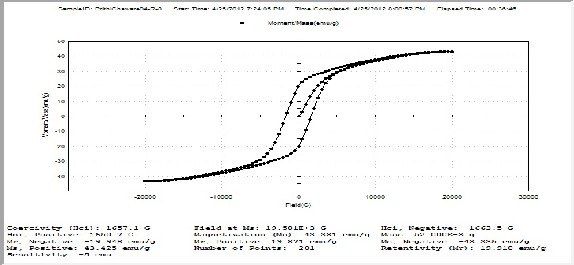
To ascertain the basic nature of present investigating ferrite, samples were characterized for their magnetic behavior by a Vibrating Sample Magnetometer (VSM). For the samples M-H curves were obtained from VSM and from them the saturation magnetic moment, retentivity & coercivity were determined. In general magnetic moment found in the range between 43 to 70emu/g, retentivity between
19 to 30emu/g and the coercivity varies between 1657 to 2427 G for all the samples confirming the good quality of samples (Table2).
M structure hexaferrite contains Fe3+ ions at five different sites including sites 2a, 12k & 2b with
parallel up spin orientation whereas parallel down spin orientation regards to sites 4f1& 4f2 with moment per formula unit of 20 µB (105 emu/g)[17]. And among the two dominant phenomenon’s governing magnetic character of hexaferrites is super exchange interaction which suggests that coupling of magnetic moment of transition metal ion in oxides could takes place through excited state of intervening oxygen ions in sintering process. Another phenomenon known as canting spin structure plays its role when there is the substitution of divalent ion by trivalent ion associates with a valancy change of one Fe3+ per formula unit to Fe2+ which reduces the strength of interaction. This results into the change from collinear
to non collinear in spin structure to different sites which are associated with decrease in Bohr Magneton.
IJSER © 2013 http://www.ijser.org
International Journal of Scientific & Engineering Research, Volume 4, Issue 7, July-2013 2492
ISSN 2229-5518
The observed decrease in saturation magnetic moment, retentivity & coercivity with increase of rare earth ion La for the present samples showed high dependence to super exchange interaction and canting spin structure. This may lead to strengthen the assumption that exchange of Fe3+ to Fe2+ referred to octahedral sites & Fe2+ anisotropy on the octahedral site could be dominant in all hexaferrites.
3.3.1 Curie temperature:
The variation of the Curie temperature T c (K) with composition for all the samples is showed in Table2. It is observed that the Curie temperature T c (K) decreases with increasing concentration of La3+ in each case. This trend can be explained on the basis of the number of magnetic ions present in the two sub-lattices and their mutual contraction. As Fe3+ ions are gradually replaced by rare earth La ions, the number of magnetic ions begins to decrease at both sites, thus leading to a decrease of exchange interaction of the type Fe3+-O2−-Fe3+. As the Curie temperature Tc (K) is determined by the overall strength of the exchange interactions, the weakening of exchange interactions results in a decrease of the Curie temperature as the concentration of La ions is increased [8].
Also the exchange interactions between different magnetic ions are dependent on the concentration of these ions and their magnetic moments. It is therefore expected that a greater amount of energy will be required to offset the effects of exchange interactions in the material having a larger number of magnetic ions. As the magnetic moment of La3+ ion is 2.78μB compared to the magnetic moment of 10μB for the two Fe3+ ions. This concludes that the replacement of Fe3+ ions by La3+ ion, likely to decrease the Curie temperature.
References
1. G. Albanese, Journal of Magn. Magn. Mater. 184 (1998) 337-343.
2. X. Liu, Phys. Status Solidi A 193 (2002) 314-319.
3. X. Liu, Journal of Magn. Magn. Mater. 238 (2002) 207-214.
4. Li Hong-gui, Journal of Trans.Nonferrous.Mel.soc.china, 1003-6326(2001) 03-0447-04.
5. H. Ismael, Journal of Magn. Magn.Mater. 150 (1995) 403-408.
6. D. Ravinder, Material Letters 57 (2003) 4344-4350.
7. K. Iwauchi, Jpn. Journal of Appl. Phys. 10 (1971) 1520-1528
8. C.G. Koops, Phys. Rev. USA 83 [1] (1951) 121-124.
9. C.Doroftei, E Rezlescue, Institute of Technical Physics, Bd. D. Mangeron 47,700050, Iasi
Romania.
IJSER © 2013 http://www.ijser.org
International Journal of Scientific & Engineering Research, Volume 4, Issue 7, July-2013 2493
ISSN 2229-5518
10. D selfert, Journal of magnetism and magnetic material, 321(2009) 4045-4051.
11. L. Khobragade, Journal Materials & Metallurgical Engg., Vol 1 (2011) pp 1-12.
12. Litsadakis , Journal of alloys compounds vol. 427 (2007) pp194.
13. Abbas J. Procedding of sixth international symposium on advanced materials, 1999, pp-155
14. N. Rezlescu and E. Rezlescu, Phys. Status Solidi A 23 (1974) 575-582.
15. Anterpreet Singh, Journal of ceramic processing research vol.11, No.2 (2010), pp. 241-249
16. A.M. Van Diepen, Journal of Phys. Chem. Solids 35 (1974) 1641.
17. F K Lotgering, J Phys Chem Solids vol. 35. (1974) pp 1633-1639
18. Jean-Claude M’ Peko, Journal of applied physics letters 71, (1997) 3730.
Table-1 Structural Parameters
x, z | a (Å) | c (Å) | a / c | 3 DX × 10 (kg/m3) | 3 DM × 10 (kg/m3) | P |
0.1,0.1 | 5.8157 | 22.7836 | 0.2556 | 5.36197 | 4.02266 | 0.25609 |
0.25,0.2 | 5.8158 | 22.7633 | 0.2553 | 5.39777 | 3.87000 | 0.28400 |
0.4,0.3 | 5.8958 | 23.1108 | 0.2551 | 5.20336 | 3.8112 | 0.25911 |
Table-2 Electric, Dielectric and Magnetic Parameters
ε’ x 10
IJSER © 2013 http://www.ijser.org
International Journal of Scientific & Engineering Research, Volume 4, Issue 7, July-2013 2494
ISSN 2229-5518
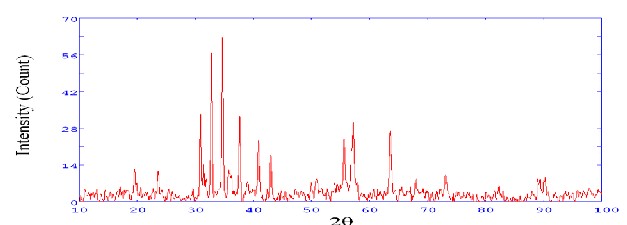
1(a) XRD Sample R2
1(b) XRD Sample R5
1(c) XRD Sample R8
IJSER © 2013 http://www.ijser.org
International Journal of Scientific & Engineering Research, Volume 4, Issue 7, July-2013 2495
ISSN 2229-5518
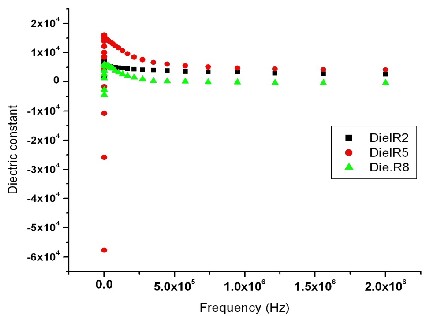
Fig. 2 Dielectric constant Vs Frequency
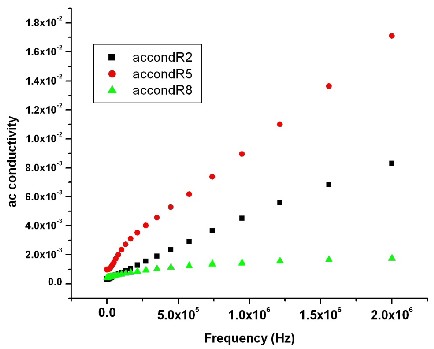
Fig. 3 A. C. conductivity Vs Frequency
IJSER © 2013 http://www.ijser.org
International Journal of Scientific & Engineering Research, Volume 4, Issue 7, July-2013 2496
ISSN 2229-5518
4(a) M-H Curve Sample R2
4(b) M-H Curve Sample R5
4(c) M-H Curve Sample R8
IJSER © 2013 http://www.ijser.org