International Journal of Scientific & Engineering Research, Volume 6, Issue 5, May-2015 1674
ISSN 2229-5518
Specific energy based characterization of tool wear in mechanical machining processes Vincent A. Balogun*1, Isuamfon F. Edem2, Paul T. Mativenga2
1College of Engineering, Department of Mechanical & Mechatronics Engineering, Afe Babalola University, Ado Ekiti, Nigeria.
2School of Mechanical, Aerospace and Civil Engineering, The University of Manchester, Manchester M13 9PL, United Kingdom
*Corresponding author: E-mail: balogunav@abuad.edu.ng
Abstract— The global trend for energy consumption as a foundational requirement for economic and social development is an increasing one. Electricity consumption is proportional to the CO 2 emitted at the process level and especially for machining processes. The electrical energy demand during machining can be categorized and modelled as basic energy (energy demand by the machine tool while operating at zero load) and tip energy (energy for actual material removal – cutting). The tool tip energy is evaluated from the specific cutting energy. At present limited data exists with regards to the key parameters required for modelling the tip energy. Previous studies and data for specific energy were based on the normalisation of the total energy demand with the material removal rate and have not investigated the effect of tool wear. In this work, the impact of tool wear on the specific energy coefficients in machining were studied and modelled. Cutting tests were performed and tool wear and tool life based on the specific energy coefficient for each wear land value were evaluated. The study has for the first time provided data on the variation of specific cutting energy for higher tool wear lands and presents vital sensitivity analysis. W ith longer cutting time, tool wear increases which leads to higher specific cutting energy and energy consumption during machining. The specific energy coefficient increased by up to 50% when turning EN8 steel alloy between 2 and 10 passes. This knowledge is vital information for process planners and could enable energy estimates to be more accurate and realistic with regards to capturing the impact of tool wear.
Index Terms— Mechanical machining, specific energy, sustainable machining, tip energy, tool life, tool wear, process level.
—————————— ——————————
ACHINING is one of the commonly used and mostly economically and viable processes in the manufacturing industries [1, 2]. The viability and economic objectives
of mechanical machining processes lies on the optimisation of cutting parameters in order to achieve high quality standards and produce an acceptable surface integrity [3]. The study of the specific cutting energy which is defined as the energy re- quired for removing one unit volume of material per unit time is the gateway to understanding the electrical energy utilisa- tion, material machinability characteristics and machining process optimization. The specific cutting energy can also be used as an indicator for evaluating the sharpness of the cutter, design of the machine tool electric drive motor and to under- stand how size effect affects surface integrity and burr height. In literature [4], the estimation of specific energy based on ma- chine tools, material characteristic and process variables were classified into three categories namely empirical, analytical, and mechanistic methodology. Few researchers including Gu- towski et al., [5], Li and Kara [6], Balogun and Mativenga [7] proposed methodologies to estimate and model the specific cutting energy through mechanistic modelling and experi- mental analysis. . Although these approaches critically inves- tigated the specific energy and recommended input parame- ters to optimise electrical energy demand during machining, they do not consider the impact of tool wear on the tip energy.
Few other researchers reported the correlation between workpiece surface finish [8] and specific cutting energy for High Speed Cutting, HSC conditions. They show that the
higher the specific cutting energy, the lower the workpiece roughness. The increasing trend of the specific energy record- ed can therefore be correlated to the influence of the cutting tool wear. The workpiece diameter [8], cutting edge angle [9], chip breaker angle [10], swept angle [11], rake angle and other cutting tool geometry have also been reported to have caused distinct influences on the specific cutting energy [12]. Burrs formations have also been reported as an indication of higher specific cutting energy. In their analysis with AISI 1045, Zhang et al. [13], reported that poison burr height increases as the specific cutting energy increases. This phenomenon is ob- served when the ratio of un-deformed chip thickness to the cutting edge radius was less than 1. Hence higher specific cut- ting energy will result in burr formations [13, 14].
Zolgharni et al. [15] reported that the performance and en-
ergy efficiency of standard drill bits is enhanced by coating
with diamond-like carbon (DLC) deposited with plasma en-
hanced chemical vapour deposition (PECV). The coatings can
reduce the friction on the surface and guarantee a lower wear
rate. The power consumption of the DLC coated drill bit re-
duced by 68% when compared with that of the uncoated drill
bit. Also, clogging incidence of the chips to the drill bit was
reduced by 15% as a result of the DLC coatings. When the
DLC was deposited with argon dilution of 20cc/min and bias
voltage 450V, there was 25% reduction in swarf clogging and
36% reduction in power consumption. There is also a greater than five-fold increase in tool life time. Assuming that the en- ergy consumption on the tool was 25% of the overall energy
IJSER © 2015 http://www.ijser.org
International Journal of Scientific & Engineering Research, Volume 6, Issue 5, May-2015 1675
ISSN 2229-5518
during drilling, approximately 9 % of the energy can be saved through the use of DLC coatings.
Mativenga et al. [16] proposed a procedure for optimizing the cutting parameters to obtain optimum tool life for mini- mum energy footprint during a machining operation. The authors proposed a model for the estimation of the total ener- gy for a single pass turning operations as stated in Equation 1.
![]() (1)
(1)
where E1 represents the energy consumed by the machine dur- ing the setup operation, E2 is the energy required for cutting, E3 is the energy demand for tool change, E4 is the embodied energy of the machining process and E5 is the embodied ener- gy of the workpiece material.
In a dry turning experiment to evaluate the minimum ener- gy criterion, Rajemi et al., [17] reported that the minimum cost criterion does not necessarily satisfy the requirement for min- imum energy demand. This is as a result of the wear progres- sion established at different cutting speeds and feed rates while the depth of cut was kept constant. The authors stated that as the cutting speed increases, the percentage of the pow- er for machining during the whole process increased by 31%,
35% and 39% for cutting velocity 300, 400 and 500 m/min re- spectively. These changes in power demand can be attributed to the cutting tool wear.
Balogun et al., [18] reported that the tool tip energy is typi- cally lower than the electrical energy required by the machine tool operating at zero load. So the machine tools should not be left in a no-cutting mode for a long time otherwise the energy footprint will significantly increase. Lucca et al., [9, 19] report- ed that ploughing and elastic spring back are some of the characteristics exhibited during machining that could contrib- ute to an increase in the specific energy. The authors further stated that in ploughing dominated machining processes, the force per unit width in the thrust direction was found to in- crease more rapidly than the force per unit width in the cut- ting direction. This implies that the tool edge condition has a significant effect on the thrust forces when the depth of cut was below the tool edge radius. In this case, rubbing phenom- enon is predominant and this resulted in higher friction forces at the tool-chip interface [20]. Rubbing phenomenon increases the wear rate during mechanical machining.
From literature, it is clear that the effect of tool wear on specific energy demand in mechanical machining has not been fully investigated. Therefore, in a bid to optimise machining operations, estimate the minimum economic cost of machin- ing, and for sustainable and green machining, it is appropriate to have an adequate knowledge of the effect of tool wear on the specific energy during machining. This work therefore understudy the specific energy based tool wear evaluation in a view to determine the total electrical energy demand in me- chanical machining and their relationship to the process pa- rameters and material characteristics.
The aim of this research was to raise the accuracy of specific energy coefficients by investigating and modelling the impact of tool wear during a turning operation. This entails undertak-
ing cutting tests in order to evaluate the specific cutting ener- gy based on tool wear, model the cutting tool wear, and eval- uate the electrical energy demand with regards to tool wear.
To analyse this hypothesis, turning tests were conducted on a CNC MHP lathe with Open MDSI architecture. The workpiece material is a midrange and common EN8 steel (AISI 1040) with an original diameter of 200 mm and cutting length of 240 mm. The inserts used were CNMG 120408-WF grade 4215 from Sandvik Coromant. The real factory environment was mimicked through the use of coolant flow during the machin- ing process. The electrical current consumption during the turning operations was recorded with the Fluke 345 power clamp meter. The cutting parameters and process variables were as specified by the tool manufacturer and as shown in Table 1.
TABLE 1
RECOMMENDED CUTTING CONDITIONS FROM SUPPLIER
Minimum | Maximum | Optimum | |
Vc (m/min) | 335 | 555 | 415 |
F (mm/rev) | 0.1 | 0.5 | 0.3 |
ap (mm) | 0.25 | 4.0 | 1.0 |
For the purpose of sustainable machining and resource effi- ciency of the process variable, the recommended optimum cutting conditions specified by tool manufacturer were adopt- ed throughout the cutting tests.
A series of turning tests were designed to investigate the vari- ations of the specific cutting energy k with the cutting time. For the turning tests, the optimized cutting velocity Vc (i.e. 415 m/min) and feed rate fn (0.3 mm/rev) provided by the supplier were adopted and kept constant while the depth of cut ap was varied to have different values for the material removal rate. For the first set of cutting tests, specific wear land values were established on the cutting tool inserts for two passes at a depth of cut of 0.25 mm and turning length of 240 mm. The electrical current consumption during the tests were monitored and recorded with the Fluke 345 power clamp meter. The cutting tool flank wear on the cutting edges were visualized and measured with the ProgRes® microscope. The ProgRes® mi- croscope camera is a reliable and powerful digital microscope camera used for image analysis and documentation.
For the second part of the tests, the cutting inserts with the established wear land values from the first cutting tests were subjected to further turning operations at 4, 6, 8, 10, 12, 14, 16 and 20 passes respectively. A total number of 7 cutting tool inserts were used for the cutting tests. The tool wear was visu- alised and measured using the ProgRes® microscope camera.
In the second part of the experiment, depth of cut was varied at 0.25, 0.50, 0.75, and 1.00 mm based on the established tool wear of 0.055 mm from the first turning test. The electric cur- rent of the machine was also recorded with the Fluke 345 power clamp meter. The depth of cut was varied in order to
IJSER © 2015 http://www.ijser.org
International Journal of Scientific & Engineering Research, Volume 6, Issue 5, May-2015 1676
ISSN 2229-5518
estimate the specific energy coefficient during the turning op- eration. The material removal rates were evaluated from Equation 2 and tabulated in Table 2.
![]() (2)
(2)
TABLE 2
MATERIAL REMOVAL RATE
![]()
![]()
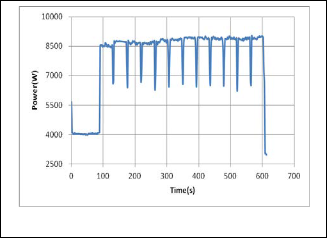
Fig. 2. Machine power for 12 passes.
The variation between the machine power and cutting time for
4 and 12 passes are shown in Figures 1 and 2 respectively. The
area under the power-time graph represents the total energy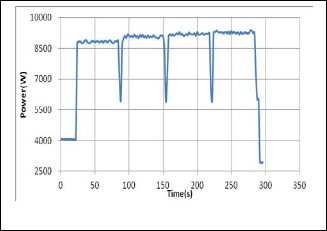
demand during the machining process.
Fig. 1. Machine power for 4 passes.
As indicated in Figures 1 and 2, the average power demand (i.e. area under the graph) during the cutting tests for 4 and 12 passes increases from 8.35 kW to 9.47 kW in 24 minutes. This represents 13% increase due to the increasing trend of the flank wear values. This is the case because cutting fluid was adopted during the turning experiment. Cutting fluid was introduced to mimic the practices within the industries. There is a slight increase on the power demand as a result of tool wear. The total electrical energy increases with cutting time.
It has been reported that for single pass turning [1] the cutting time can be estimated with Equation 3. This is also in line with the cutting passes recorded as shown in Table 2.
![]() (3)
(3)
where Davg is the average diameter of the workpiece material, l is cutting length which in this case is 240 mm, f is feed rate which is 0.3 mm/rev, Vc is the cutting velocity which was set at
415 m/min.
The cutting time for different passes is as listed in Table 3. It can be observed that the cutting time decreases as the number of passes increases. This is attributable to fact that as the turn- ing progresses, the diameter of the workpiece was becoming smaller. The reduction in the diameter will affect the total cut- ting time and can be seen in Equation 3.The machining passes were the same for a specific cutting tool insert, hence the aver- age cutting time was calculated to represent the time for that specific number of passes.
The tool wear on each of the cutting edges and for each specif- ic number of passes were visualised and measured with the ProgRes® microscope camera and tabulated in Table 4. Figure
3 shows the relationship between the cutting tool wear and the cutting time.
IJSER © 2015 http://www.ijser.org
International Journal of Scientific & Engineering Research, Volume 6, Issue 5, May-2015 1677
ISSN 2229-5518
TABLE 3
CUTTING TIME FOR DIFFERENT PASSES
Number of passes | ||||||||
2 | 4 | 6 | 8 | 10 | 12 | 16 | 20 | |
Cutting time (min) | 2.15 | 4.16 | 5.88 | 7.17 | 7.87 | 8.06 | 13.71 | 21.50 |
TABLE 4

TOOL W EAR AGAINST DIFFERENT CUTTING TIME
Cutting
Tool wear Vb (mm)
T ime (min) | 1st edge 1 2 | 3 | 2nd edge 1 2 | 3 | 3rd edge 1 2 | 3 | 4th edge 1 2 | 3 | AVG |
2.15 | 0.046 | 0.046 0.056 | 0.059 | 0.059 0.053 | 0.054 | 0.052 0.061 | 0.051 | 0.062 0.062 | 0.055 |
4.16 | 0.089 | 0.072 0.103 | 0.090 | 0.092 0.087 | 0.089 | 0.098 0.089 | 0.090 | 0.092 0.087 | 0.090 |
5.88 | 0.098 | 0.107 0.113 | 0.102 | 0.110 0.122 | 0.098 | 0.098 0.118 | 0.113 | 0.103 0.110 | 0.108 |
7.17 | 0.113 | 0.125 0.131 | 0.120 | 0.124 0.123 | 0.116 | 0.120 0.115 | 0.108 | 0.125 0.125 | 0.120 |
7.87 | 0.121 | 0.131 0.136 | 0.117 | 0.128 0.136 | 0.121 | 0.139 0.133 | 0.116 | 0.135 0.130 | 0.129 |
8.06 | 0.128 | 0.139 0.139 | 0.126 | 0.130 0.125 | 0.130 | 0.138 0.146 | 0.133 | 0.143 0.139 | 0.135 |
13.71 | 0.203 | 0.195 0.200 | 0.184 | 0.189 0.182 | 0.179 | 0.164 0.176 | 0.171 | 0.171 0.169 | 0.182 |
21.50 | 0.340 | 0.315 0.289 | 0.274 | 0.307 0.269 | 0.261 | 0.254 0.285 | 0.210 | 0.199 0.199 | 0.267 |
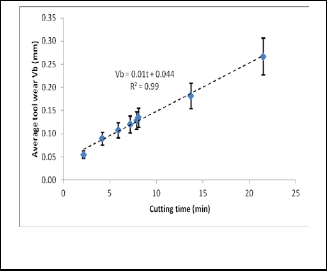
From Figure 3, it can be observed that cutting tool wear in- creases as the cutting time increases. The trend line equation obtained from the best fitted curve analysis is as shown in Equation 4.![]()
(4)
Fig. 3. Variation between average tool wear and cutting time when turning EN 8 steel alloy.
As can be seen from Table 4 and Figure 3, the cutting tool flank wear at 20 minutes is 50% more than that measured dur- ing the turning operation of EN8 steel alloy for 8 minutes. Therefore, in order to reduce the impact of this exponential tool wear variability on component quality, a reduced tool wear criterion of 0.2 mm Vb as against the recommended value of 0.3 mm Vb [21] was adopted for this study.
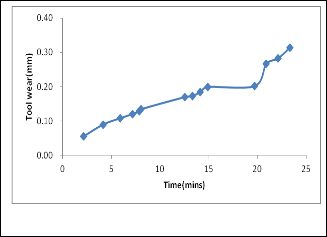
Figure 4 shows exactly how tool wear changes with increasing cutting time instead of using the average cutting time.
IJSER © 2015 http://www.ijser.org
International Journal of Scientific & Engineering Research, Volume 6, Issue 5, May-2015 1678
ISSN 2229-5518
used for similar passes before) was recorded in further short run cutting tests. For these turning tests, the cutting length was limited to 30 mm. This is to reduce the excessive impact of tool wear on the specific energy demand. Figures 6 to 8 shows the Power-MRR graph at which the slope equates to the spe- cific energy coefficients as reported in literature [7].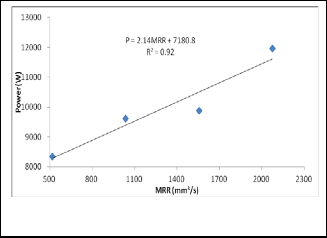
Fig. 4. Tool wear variation with respect to time
It can be easily observed that in Figure 4, tool wear increases rapidly before 0.3 mm flank wear. So for this insert, the aver- age flank wear based on tool life is 0.2 mm and the cutting time is approximately 15.6 minutes. According to the ISO3685 [21] standard for tool-life testing with single-point turning tools, an average flank wear tool-life criterion of 0.3 mm is recommend- ed. Figure 5 shows some micrograph samples as visualised under the ProgRes® microscope camera. It is obvious that as the number of cutting passes increased, the cutting time also increased and the cutting tool wear also increased [22].
Fig. 6. Power for different MRR based on 2 passes.
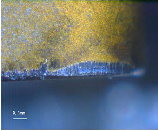
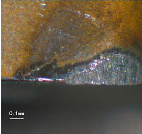
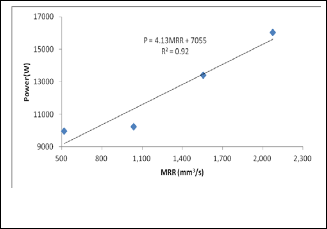
Fig. 7. Power for different MRR based on 10 passes.
To evaluate the specific cutting energy of EN8 steel alloy ma- terial with used cutting tools as practiced within the indus- tries, turning tests were conducted on the MHP CNC lathe at different material removal rates and their corresponding elec- tricity consumption were measured with the Fluke 345 power clamp meter. The gradient of the power-material removal rate curve is the specific energy value. Material removal rate can be varied by changing the cutting velocity, feedrate or depth cut. Since changing the cutting velocity leads to the use of different cutting speeds (a major impact on currently demand), the least sensitive parameter to electrical energy demand i.e. depth of cut was varied [7]. Electricity consumption for different depth of cut at the same level of the cutting tool flank wear (i.e. tools
Fig. 8. Power for different MRR based on 16 passes.
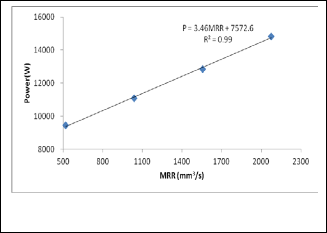
Table 5 shows the specific energy coefficient evaluated for
IJSER © 2015 http://www.ijser.org
International Journal of Scientific & Engineering Research, Volume 6, Issue 5, May-2015 1679
ISSN 2229-5518
different cutting passes. It can be observed that there is a de- crease in the specific energy coefficient, k values of 4.50, 3.46 and 2.62 J/mm3 at 12, 16 and 20 passes respectively. This is be- cause the tool cutting edge radius increases as a result of high- er cutting tool flank wear which transforms the cutting phe- nomenon from shearing dominated turning to ploughing dominated cutting therefore promoting the formation of built- up edge on the cutting tool insert. The built-up wraps the cut- ting tool edge radius and the welded chip now forms the new and tough cutting tool edge. This phenomenon improves ma- chinability of the workpiece material hence a lower specific cutting energy measured. The ranges of the specific energy values evaluated are in agreement with Kalpakjian and Schmid [1] reported in literature. The difference in specific
cutting energy among different materials can basically be at- tributed to the differences in the mechanical and physical properties of these materials, which in most cases affects the dislocation characteristics of the atoms during cutting opera- tions.
TABLE 5
SPECIFIC CUTTING ENERGY COEFFICIENT FOR DIFFERENT CUTTING TIME
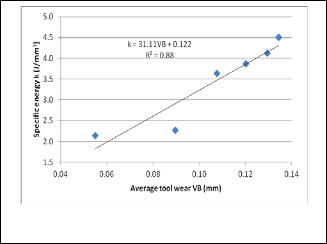
Fig. 9. Specific cutting energy induced at different flank wear for different cutting time.
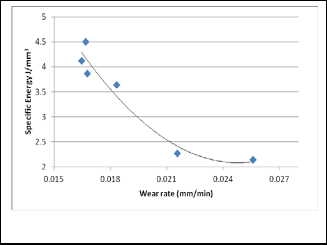
Furthermore, the specific energy is inversely proportional to the wear rate during machining. This implies that for a sus- tainable and energy efficient machining, the specific energy should be at the minimum value. For example for EN8 steel alloy, the specific energy should be within the range of 2
J/mm3. This value corresponds to a higher wear rate as shown in Figure 10. Therefore, specific cutting energy is a method to characterise the tool wear and enforce a tool change.
From Figure 9 and Table 5, it can be deduced that the specific cutting energy is directly proportional to the cutting tool flank wear. It also shows that higher specific cutting energy values when turning EN8 steel alloy indicates increased flank wear and the need for a tool change. This is a requirement during mechanical machining processes that can influence surface finish of a machined part and a direct strategy to optimise electrical energy demand during the cutting process.
Fig. 10. Specific cutting energy for different wear rate values.
This work understudied the specific energy method to char- acterise the cutting tool flank wear in order to collate data and determine the variation strategy of specific cutting energy and tool wear when machining EN8 steel alloy. The following con- clusions were drawn from the study:
1. The specific energy is directly proportional to the cut-
ting tool wear values when cutting EN8 steel alloy and although the specific energy values decreases at
16 and 20 passes respectively due to the formation of
built-up edges on the cutting tool, the general increas- ing trend of the specific energy values can be as-
IJSER © 2015 http://www.ijser.org
International Journal of Scientific & Engineering Research, Volume 6, Issue 5, May-2015 1680
ISSN 2229-5518
sumed and adopted for other workpiece materials.
2. The machine tool power demand increases from 8.35 kW to 9.47 kW in 24 minutes. This represents 13% in- crease due to the increasing trend of the cutting tool flank wear values.
3. The analyses also show that the specific cutting ener-
gy values can be more than double at 0.15 mm flank wear. Hence estimating the tip energy based on short run cutting tests can lead to 100% error.
4. The relationship between specific cutting energy and flank wear based on machining time can be modelled as follows:![]()
While tool wear and cutting can be modelled as fol- lows:![]()
5. This specific cutting energy model and cutting tool wear model are both linear functions and suggesting that the rule of thumb can be used to estimate tip en- ergy for longer machining time.
6. The specific energy increased for more than 50% as
the flank wear increases between 2 and 10 passes. As- suming that tip energy is 25% of the total energy de- mand then tool wear can increase the total energy by approximately 12.5%. This may not be neglected for more accurate analysis especially if the margin of im- provements is of the same order of less than 10%.
7. Therefore for a resource efficient and sustainable manufacture, machining operations should be con- ducted at lower range of specific energy values where at that point tool wear will be minimal.
[1] Kalpakjian, S., Schmid, S., Manufacturing processes for engineering materials,
2003. Prentice-Hall, Englewood Cliffs, New Jersey.
[2] Trent, E. M., Wright, P. K., Metal cutting. 2000: Butterworth-Heinemann.
[3] Draganescu, F., Gheorghe, M., Doicin, C. V., Models of machine tool efficiency and specific consumed energy. Journal of Materials Processing Technology,
2003. 141(1): p. 9-15.
[4] Jayaram, S., Kapoor, S., DeVor, R., Estimation of the specific cutting pressures for mechanistic cutting force models. International Journal of Machine Tools and Manufacture, 2001. 41(2): p. 265-281.
[5] Gutowski, T., Dahmus, J., Thiriez, A., Electrical Energy Requirements for manufacturing processes. Proceedings of 13th CIRP International Conference on Life Cycle Eng, Leuven, 2006: p. 623.
[6] Li, W., Kara, S., An empirical model for predicting energy consumption of
manufacturing processes: a case of turning process. Proceedings of the Institu- tion of Mechanical Engineers Part B-Journal of Engineering Manufacture,
2011. 225(B9): p. 1636-1646.
[7] Balogun, V. A., P. T. Mativenga, Impact of un-deformed chip thickness on specific energy in mechanical machining processes. Journal of Cleaner Pro-
duction, 2014. 69: p. 260-268.
[8] Guo, Y., Loenders, J., Duflou, J., Lauwers, B., Optimization of Energy Con- sumption and Surface Quality in Finish Turning. Procedia CIRP, 2012. 1(0): p.
512-517.
[9] Lucca, D., Seo, Y., Komanduri, R., Effect of tool edge geometry on energy dissipation in ultraprecision machining. Cirp Annals-Manufacturing Tech- nology, 1993. 42(1): p. 83-86.
[10] Rodrigues, A. R., Coelho, R. T., Influence of the tool edge geometry on specific
cutting energy at high-speed cutting. Journal of the Brazilian Society of Me- chanical Sciences and Engineering, 2007. 29(3): p. 279-283.
[11] Bayoumi, A. E., Yücesan, G., Hutton, D. V., On the closed form mechanistic modeling of milling: Specific cutting energy, torque, and power. Journal of Materials Engineering and Performance, 1994. 3(1): p. 151-158.
[12] Balogun, V. A., Gu, H., Mativenga, P. T., Improving the integrity of specific cutting energy coefficients for energy demand modelling. Proceedings of the Institution of Mechanical Engineers, Part B: Journal of Engineering Manufac- ture, 2014: DOI: 0954405414546145.
[13] Zhang, T., Liu, Z., Xu, C., Influence of size effect on burr formation in micro cutting. The International Journal of Advanced Manufacturing Technology,
2013: p. 1-7.
[14] Zhang, T., Liu, Z. Q., Xu, C. H., He, N., Li, L., Experimental Investigations of Size Effect on Cutting Force, Specific Cutting Energy, and Surface Integrity during Micro Cutting. in Materials Science Forum. 2012. Trans Tech Publ.
2012. p. 371-6.
[15] Zolgharni, M., Jones, B., Bulpett, R., Anson, A., Franks, J., Energy efficiency improvements in dry drilling with optimised diamond-like carbon coatings. Diamond and Related Materials, 2008. 17(7): p. 1733-1737.
[16] Mativenga, P. T., Rajemi, M. F., Calculation of optimum cutting parameters based on minimum energy footprint. CIRP Annals - Manufacturing Technol- ogy, 2011. 60(1): p. 149-152.
[17] Rajemi, M. F., Mativenga, P. T., Aramcharoen, A., Sustainable machining:
selection of optimum turning conditions based on minimum energy consid- erations. Journal of Cleaner Production, 2010. 18(10-11): p. 1059-1065.
[18] Balogun, V. A., Mativenga, P. T., Modelling of direct energy requirements in mechanical machining processes. Journal of Cleaner Production, 2013. 41: p.
179-186.
[19] Lucca, D., Rhorer, R., Komanduri, R., Energy dissipation in the ultraprecision machining of copper. Cirp Annals-Manufacturing Technology, 1991. 40(1): p.
69-72.
[20] Waldorf, D. J., A simplified model for ploughing forces in turning. Journal of manufacturing processes, 2006. 8(2): p. 76-82.
[21] ISO, Tool-life Testing with Single Point Turning Tools, ISO 3685:1993(E), (2nd ed.). 1993, International Organization for Standards: Geneva.
[22] Balogun, V. A., Isuamfon F. E., Bonney, J., Ezeugwu, E. O., Mativenga, P. T.,
2015. Effect of Cutting Parameters on Surface Finish when Turning Nitronic
33 Steel alloy, International Journal of Scientific & Engineering Research,
6(1):560 – 568.
Uncited reference:
[23] Balogun, V. A., Isuamfon F. E., Mativenga, P. T., 2015. The effect of Auxiliary Units on the Power Consumption of CNC Machine tools at zero load cutting, International Journal of Scientific & Engineering Research, 6(2): 874 – 879.
IJSER © 2015 http://www.ijser.org