International Journal of Scientific & Engineering Research, Volume 4, Issue 7, July-2013 2588
ISSN 2229-5518
Spatial Analysis of Transportation Network for Town Planning of Aurangabad City by using Geographic Information System
Ajay D. Nagne1, Amol D. Vibhute2, Bharti W.Gawali3, Suresh C. Mehrotra4
Abstract— The Spatial Analysis of Transportation Network for Town Planning task is performed for Aurangabad Municipal Corporation (AMC). The required data was collected from the NRSC, Hyderabad and AMC. The Arc GIS 10 is used to perform the extraction of region of Interest from primary data and for Road Generalization, like selection, merging, elimination, symbolization etc. Total Road length and total area is calculated using the ArcMap software, using these data and population data, a Population Density and Road Density is calculated. Network Dataset is created in Arc Catalog 10 which provides the number of Transport Lines and number of Junctions. It is used to calculate the Network Connectivity Indices. An Alpha Index, Beta Index, Gamma Index and Eta Index are calculated for Transportation Analysis. This provides the spatial relationship between the Transportation and Town planning of Aurangabad City. The experiment resulted in providing information regarding the highly burn and undeveloped Zones.
Index Terms— Alpha Index, Beta Index, Eta Index, Gamma Index, GIS, Network Indices, Road density, Transportation network Analysis.
—————————— ——————————
1 INTRODUCTION
N urban planning, transportation network analysis plays an important role to make better decisions. A GIS can be used to monitor transport network, conditions of a network,
shortest or best route to reach destination and closest services. Aurangabad Municipal Corporation is the prime planning organization. There are total Six Ward Zones, Starting from Zone A to Zone F. Aurangabad Municipal Corporation (AMC) consist of 99 wards, with a population of approximately
1171330 as per Census 2011. Its total area is nearly 142.789 km2. The benefit of GIS is not only user-friendly access and display, but provides spatial analysis. This Spatial analysis can be used to identify more data to discover new relationships. These analyzed data can be displayed in the form of maps, graphs or summary statistics [1]. The Implementation pro- vides GIS functionalities like, extraction of features, Network analysis, designing thematic maps, access to several layers of data at a time. The existing database of the Aurangabad city does have the option to manipulate, access, and query the da- tabase but it is limited to textual queries only. It is not possible to make relationship between the crossing attribute data with respect to the topological and spatial relationship. To identify the spatial link between Transport Network and Town plan- ning, an existing database is useful.
————————————————
• Research Scholar, Department of Computer Science & Information Technology, Dr. Babasaheb Ambedkar Marathwada University, Aurangabad (MS) - 431004, INDIA, E-mail: ajay.nagne@gmail.com
• Research Scholar, Department of Computer Science & Information Technology, Dr. Babasaheb Ambedkar Marathwada University, Aurangabad (MS) - 431004, INDIA,Cell No:-+91-9921059215.
E-mail: amolvibhute2011@gmail.com
• Associate Professor, Department of Computer Science & Information Technolo- gy, Dr. Babasaheb Ambedkar Marathwada University, Aurangabad (MS) -
431004, INDIA.
E-mail: bharti_rokade@yahoo.co.in
• Professor, Srinivasa Ramanujan Geospatial Chair, Department of Computer
Science & IT, Dr.Babasaheb Ambedkar Marathwada University, Aurangabad
(MS) - 431004, INDIA.
E-mail: mehrotra_suresh@yahoo.co.in
2 TRANSPORTATION NETWORK
A digital transport network with complex mathematical mod- els is the basis for transport analysis and urban growth. The network is a representation of major routs within that area. This digital network is the input to the transport analysis and to identify urban growth, which contains Vertex (Node / point / Junction) and Edge (Arc / Line / link). This is used to identify the start and end points of any routes. Every Vertex (V) and Edge (E) is a record that is used to represent the char- acteristics of a road. In traditional GIS a Toposheets were the only medium which were available to visualize the Transport network [2].
Generally Transportation Planning consists of various indi- vidual modules. These modules can be road type (width of road), pavement management, traffic management and acci- dent related data. As per the population within that area the transport network structure should be redesigned. This may be to increase road width, make one ways, and identify the parking area (multi floor parking).The use of GIS technology in development of Urbanization, the transportation infor- mation system and management can provide a very strong solution. Information related to transportation network is used in the efficient planning, designing, construction, maintenance and management of the transport system [3]. Aurangabad Municipal Corporation Transportation Network consist a Na- tional Highway, State Highway, District Road, Major city Road, shown in Fig.1.
IJSER © 2013 http://www.ijser.org
International Journal of Scientific & Engineering Research, Volume 4, Issue 7, July-2013 2589
ISSN 2229-5518
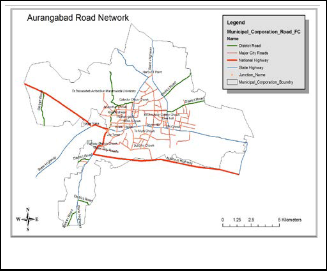
Image which has a resolution of 5.8 m, and also a PAN image of 2.8 m resolution were used. These images were merged to produce a color image with the spatial resolution of 2.8 m. The Geographic Coordinate System of these images is GCS_WGS_1984 and Projection is Transverse_Mercator. Also a primary data of Aurangabad Municipal corporation bounda- ry (limit) was provided by them, which has a Zone wise and Ward wise corporation boundary. The secondary data of population was taken from the AMC.
Fig. 1. Transportation Network of Aurangabad City
3 STUDY AREA
The co-ordinates for Aurangabad are N 19° 53' 47" - E 75° 23'
54". The city is surrounded by hills on all directions. The Dis-
trict spread in 10107 Sq. Km. with population of 3695928 lakhs
and 1300 Village as per 2011census.
5 METHODOLOGY
In ArcGIS 10, it is possible to extract the region of interest (ROI). This ROI consist two types of features the first one is polygon feature and second one is line feature. The polygon feature represents the Aurangabad district boundary, from this Aurangabad Municipal Corporation (AMC) Boundary was extracted. The line feature represents the Transport Net- work of Aurangabad district. By using the AMC boundary, the road line feature were clipped and saved with a different name, so it shows only the Road Network which comes within the AMC boundary, shown in Fig. 3.
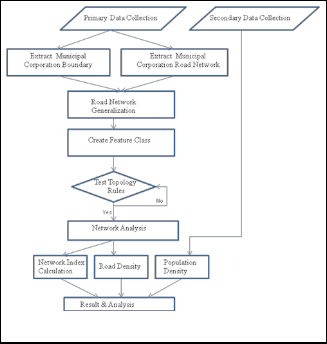
Fig. 2. Transportation Network of Aurangabad City
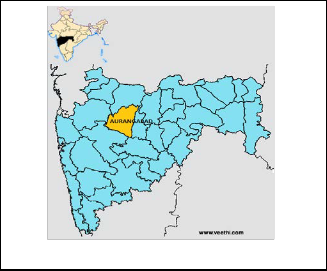
Aurangabad city is a Capital of Marathwada Region of Ma- harashtra; see Fig. 2 [4]. The city is famous for its rich cultural heritage. The famous world tourist’s places are Ajanta Caves, Ellora Caves, Panchakki, Daulatabad Fort and Bibi-ka- Makbara. It is located in centre of Maharashtra. Aurangabad is an only one tourist district of India, which has a two-world heritage monument to its credit. It is one of the rapidly devel- oping city in the Maharashtra State. It is well connected by roads with various major cities of Maharashtra and other states [5].
4 MATERIAL AND DATA
The data was taken from the NRSC, Hyderabad and Auranga- bad Municipal Corporation (AMC). A LISS IV Remote Sensing
Fig. 3. Methodology of Transportation Network Analysis
5.1 Extraction of AOI
After the collection of data, the first step was performed in Arc GIS 10 is used to extract the interested region. The interested feature has two types of features the first one is polygon fea- ture and second one is line feature. In this data the polygon feature contains the district boundary of Aurangabad, and Line feature contains the road Network of Aurangabad Dis- trict. By using ArcGIS software, AMC boundary was extracted from the Aurangabad district boundary. To perform this task the ‘Select by Attribute’ option was used, then enters the que- ry within query window. The Aurangabad Municipal Corpo- ration boundary was extracted. By using the AMC boundary,
IJSER © 2013 http://www.ijser.org
International Journal of Scientific & Engineering Research, Volume 4, Issue 7, July-2013 2590
ISSN 2229-5518
the road line feature were clipped and saved with a different name, so it shows only those roads network which comes within the AMC boundary. For this purpose an Analysis (Clip) tool was used. This tool is used to cut out a piece of one feature class using one or more of the features in another fea- ture class. By using this tool we get Transport Network, which comes within the AMC boundary only. AMC boundary con- tains the six Zones with their boundary and area in km. These Zones are separated by using Select by Attribute query, and then store it in six different file. These six Zones Boundary, are used to clip the Transport Network of each Zone. Now the Extraction of Polygon feature and Line Feature has been done by using the select by Attribute and Clip tool.
5.2 Road Generalization
The next step is a Road Generalization. These geometric oper- ations are involved selection, merge, symbolization, elimina- tion etc. The Road Network data having a category Road Type, like 'National Highway', 'State Highway', 'District Road'
, 'Major City Roads' and ‘sub Roads’. By using this classifica- tion the selection process was performed. So only those roads are there which is 'National Highway', 'State Highway', 'Dis- trict Road' and 'Major City Roads', it means the ‘Sub Roads’ and those roads are having null value are removed. This pro- cess is nothing but Elimination process [5] [7] [8] [9] [10] [11].
5.3 Creating Feature Class
Geodatabase is a part of Geographical Information System (GIS) which helps to store and manipulate geographical data. Geodatabase is a combination of two words Geo + Database. The single user database is also known as personal Geodata- bases. A personal geodatabase is a Microsoft Access database that can store, query, and manage both spatial and nonspatial data. The Geodatabase is somewhat similar like file based cov- erage and shape file data models. But it has few advantages over it like it provides support for advanced geometry. Also it supports user-defined relationships among feature classes. Personal geodatabases are stored in Access databases, so they are having a maximum size of 2 GB and it runs only on the Windows platform. In addition to generic features, such as points, lines, and polygons, you can create custom features, such as transformers, pipes, and parcels. These custom fea- tures can have special behavior to better represent real-world objects. It supports a topology in a Geodatabase, so it allows you to represent shared geometry between same features within a feature class and between different feature classes [12].
In Personal geodatabases the following types of datasets can be created in ArcCatalog:
• Feature dataset
• Feature class
• Table (nonspatial)
• Toolboxes
It is possible to group related feature together within Fea- ture datasets. So the specific functionality can be achieved. Within Feature dataset a feature classes can be created, it has an advantages to create Feature class within Feature dataset, like all Feature classes have a same coordinate system. Also it
is possible to create Topology for each Feature class. Feature Classes can be a part of a geometric network, network dataset, schematic dataset, cadastral fabric, or terrain dataset [13].
Within Feature datasets it is possible to add new datasets like:
• Feature class
• Network datasets
• Topologies
• Parcel fabrics
• Geometric networks
5.4 Topology in ArcGIS
Topology is a collection of rules that, coupled with a set of editing tools and techniques, enables the geodatabase to more accurately model geometric relationships. It is the arrange- ment for how point, line, and polygon features share geome- try. Topology has long been a key GIS requirement for data management and integrity. Topology can help to manage geo- graphic data, if that data shares a same location of coordinates, boundaries, or nodes. Topology provides a mechanism to check integrity on data, so it helps to validate and maintain better feature. Also topologies can be used for modeling spa- tial relationships between features. Using this technique it is very easy for analytical operation like, checking the connected feature, finding adjacent features, finding disconnected feature etc. A topology is stored in a geodatabase as one or more rela- tionships that define how the features in one or more feature classes which shares geometry. Topological data model man- ages the spatial relationships by representing the spatial ob- jects like point, line, and polygon [14].


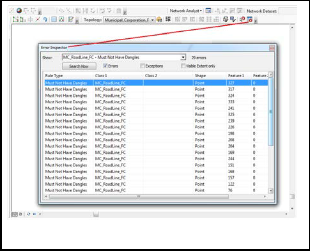
The topology errors can be find outs and it is possible to fix or solves this error. In ArcMap a Topology has to be opened and then Editing has to be start. Once the Editing has been start then from Topology tool bar the Error Inspector win- dow has to be opened shown in Fig.4. So, an error of each rule can be discovered. Once the error has been found then just select the Fix Topology Error tool to solve an error, or it should be manually edited to solve the problem [15].
Fig. 4. Topology Error Inspectors
IJSER © 2013 http://www.ijser.org
International Journal of Scientific & Engineering Research, Volume 4, Issue 7, July-2013 2591
ISSN 2229-5518
5.5 Network Analysis
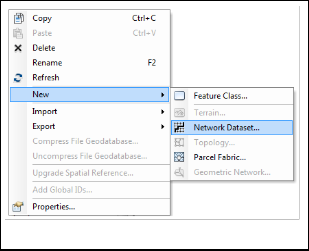
A network is a system of interconnected elements such as lines (Edge) and connecting junctions (Vertex or points) which rep- resent every possible route from one Junction to another Junc- tion. From a feature class a network dataset is created but it is restricted that from only one feature class can create only one Network Dataset. The ArcGIS Network Analyst extension al- lows you to build a network dataset and perform analyses on a network dataset [16].To create a Network Dataset, right click on Feature Dataset on which you want to perform a Network Analysis. Then select New Tab and from new tab select Net- work Dataset, see Fig.5. Once the Network Dataset has been created then open ArcMap to perform Network Analysis
Fig. 5. Creating Network Dataset
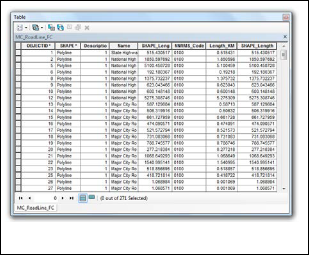
After creating a Network Dataset will get a Total number of Lines and Total number of Junction (Nodes). Fig 6 and 7 shows a total number of Edges and total number of Vertex respectively.
5.6 Road Density
The Road/Network density is used to measures the Network Development [6]. The Road density of Aurangabad is 1120.317 m/sq km. This index value shows good condition of AMC Transport network. The AMC has 6 Zones, the area and total road length of this Zone is calculated in GIS, and Road density is shown in the Table 1.
The Road Density of Aurangabad Municipal Corporation area is calculated by using the equation given bellow
ND = l/A (1)
Where l = total length of network
A = Total Area of Network
TABLE 1 ZONE WISE ROAD DENSITY OF AURANGABAD MUNICIPAL
CORPORATION
Fig. 6. Attribute Table of AMC Road Line Feature class
5.7 Population Density
The Population Density of Aurangabad Municipal Corpora- tion area is calculated by using the following equation
PD = P/A (2) Where p = total population of Area
A = Total Area of Network

IJSER © 2013 http://www.ijser.org
International Journal of Scientific & Engineering Research, Volume 4, Issue 7, July-2013 2592
ISSN 2229-5518
TABLE 2 ZONE WISE POPULATION DENSITY OF AURANGABAD MUNICIPAL CORPORATION
WARD ''A to F'' | WARD | Total |
WARD ''A to F'' | WARD-A | WARD-B | WARD-C | WARD-D | WARD-E | WARD-F | Total |
Population | 184323 | 196717 | 202015 | 181099 | 185946 | 194867 | 1144967 |
Total Area (KM) | 57.838 | 15.721 | 3.729 | 5.974 | 32.889 | 26.636 | 142.787 |
Population Density | 3187 | 12513 | 54174 | 30315 | 5654 | 7316 | 8019 |
Remark | Very Less | Moderate | Very High | High | Less | Moderate | Moderate |
This is used to identify how dense the area is [6]. The Popu-
The Beta Index’s equation is as follows,
lation Density of the AMC is 8019 persons per sq km. The
Equation: -
β = e / v
(4)
Zone wise population density is shown in Table 2.
5.8 Calculation of Indices
The most fundamental properties of a Transportation network is Network Indices, like Alpha Index, Beta Index, Gamma In- dex etc. There are many Indices and every Index has its own equation for different purposes. For extraction of connectivity index it requires a road network (line), junctions (nodes). These indices are useful to identify the growth within network structure and also for change detection system [6]. The Table 3
Where e = No. of edges (Line)
v = No .of Vertex (Node)
5.8.3 Gamma Index
The Gamma Index is a Ratio of actual number of edges to the Maximum possible number of edges in the network. Its value ranges from 0.0 – indicates no connection between nodes, to
1.0 – maximum number of connection with direct link to all nodes [6] [17] [18].
The Gamma Index’s equation is as follows,
shows the result of all Indices of AMC as well as Zone wise
AMC.
Equation: -
γ = e/(3(v - 2) )
(5)
5.8.1 Alpha Index
Alpha Index is a ratio of circuits to the number of maximum possible circuits in the network. Its value ranges from 0.0 to
5.8.4 Eta Index
Where e = No. of edges (Line)
v = No .of Vertex (Node)
1.0. If the value is 0, then it indicates no circuits; and if the val- ue is 100 percent then it indicates complete interconnected network [6] [17] [18].
Eta Index is used to Measures the average edge length in the network. And it is used as a measure of speed in traffic net- work. It requires a summation of all edges in the network and
α = (e - v + 1 ) /
(2v - 5)
(3)
number of edges in the network. If a new link is added, so it will decrease in eta index, as average per link declines [6] [19].
Where e = No. of edges (Line)
The Eta Index’s equation is as follows,
v = No .of Vertex (Node)
Equation: -
η = L(G)/e
(6)
5.8.2 Beta Index
The Beta Index is ratio of the number of edges to the number of nodes. It is more useful for simple network where no cir- cuits are involved. If the value is 0.0 it means there is just nodes without any arc. Its value ranges from 0.0 to 1.0 and greater, where network are well connected [6] [17] [18].
Where L (G) = Summations of all edges in the network
e = No. of edges (Line)
TABLE 3 ZONE WISE INDICES OF AURANGABAD MUNICIPAL CORPORATION
Ward Zone No. | Point (V) | Line (e) | Road Length | Alpha Index | Beta Index | Gamma Index | Eta Index |
Aurangabad ( AMC ) | 195 | 271 | 159.96 | 0.2000 | 1.38974 | 0.46805 | 0.59026 |
Zone A | 53 | 58 | 37.903 | 0.0594 | 1.0943 | 0.3791 | 0.6535 |
Zone B | 39 | 50 | 24.306 | 0.1644 | 1.2821 | 0.4505 | 0.4861 |
Zone C | 27 | 29 | 12.811 | 0.0612 | 1.0741 | 0.3867 | 0.4418 |
Zone D | 55 | 63 | 24.699 | 0.0857 | 1.1455 | 0.3962 | 0.3920 |
Zone E | 45 | 50 | 32.307 | 0.0706 | 1.1111 | 0.3876 | 0.6461 |
Zone F | 79 | 87 | 44.108 | 0.0588 | 1.1013 | 0.3766 | 0.5070 |
IJSER © 2013 http://www.ijser.org
International Journal of Scientific & Engineering Research, Volume 4, Issue 7, July-2013 2593
ISSN 2229-5518
6 RESULT AND DISCUSSION
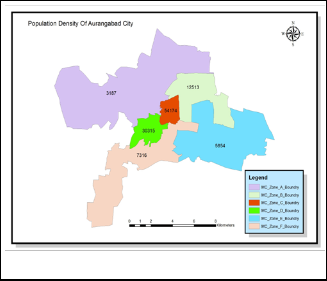
In Aurangabad Municipal Corporation, there are total six Zones, and these are named as Zone ‘A’, Zone ‘B’, Zone ‘C’, Zone ‘D’, Zone ‘E’ and Zone ‘F’. Among these zones Zone ‘A’ has a largest area and lowest population density and lowest road density. The population density and road density of all Zones is shown in Fig.8 and Fig.9 respectively.
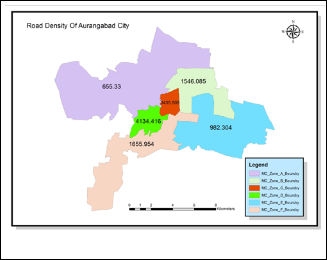
Fig. 8. Zone wise Population Density of AMC
Fig. 9. Zone wise Road Density of AMC
The Zone wise Analysis of Aurangabad Municipal Corpora- tion is as follows
6.1 Ward Zone ‘A’
It is a largest Zone in Aurangabad Municipal Corporation; it has an area of 57.838 sq km. This Zone is having a lowest pop- ulation of only 184323. So, the population density is 3187, which is a lowest value among the all Zones. The road density of this Zone is also very less, it has only 655.33 m/ sq km. The
70% area of this Zone is in no development Zone. This area is mostly covered by a reserved area, hilly area, also it has 2 dams. The Eta Index value of this zone is 0.6535, and it is a highest among the all Zone. There is a requirement of horizon-
tal development, as settlement area is increased so automati- cally the transport network will increase and vice versa.
Zone A has less Alpha Index value (0.0594); which is the se- cond lowest value in the remaining Zones. This is because there are very less alternative routes to reach from one end to another end in this Zone.
6.2 Ward Zone ‘B’
Considering all parameter of the transport network analysis for urban planning and development, this Zone is the better than any of the other zones. The road density of this Zone is
1546.085 m/ sq km and population density is 12513 persons per sq km. This Zone is well planned area because this was planned and developed by the City and Industrial Develop- ment Corporation (CIDCO).
6.3 Ward Zone ‘C’
In Aurangabad Municipal Corporation there are total 6 Zones, among them a Zone C is the smallest in area, and it has only
3.729 sq km area. As Census 2001 data, this Zone having a highest population i.e. 202015. So, the population density is
54174, this is a highest population density in Aurangabad Municipal Corporation. The average length of road i.e. The Zone C has low Eta Index value of only 0.4418 km; it indicates the average length of road. In this Zone most of the area is commercial area. So the transportation facility has to be good. Considering all the above parameters this Zone is identified as a “Highly Burn Area”.
The Zone C, cannot be developed horizontally, so vertical development has to be done. For that FSI has to be increase, presently the FSI is 1. If the FSI is increased then building will be taller and it is more useful for commercial area, because it has more commercial area. But it arise a parking problem, for this a Municipal Corporation has to give permission for multi floor parking. Instead of increasing a road width of this zone, a one way road system should be implemented.
6.4 Ward Zone ‘D’
In Aurangabad Municipal Corporation this Zone facing a same problem as like Zone C; because this Zone is a second lowest area Zone. An important thing is that, it has a highest road density and second highest population density. The ma- jor area of this Zone is a commercial area. An Eta Index value of this Zone is also a low value, its value is 0.4418. It indicates that an average length of road is only a 441 m. So, This Zone is identified as a ‘Highly Burning Zone’ after the Zone ‘C’.
Therefore, solution to this problem is to increase the FSI, presently it is only one, and it should be increase up to 3. And also multi parking facility has to be permitted, and then it will be beneficial to the commercial area.
6.5 Ward Zone ‘E’
The Zone E is the second largest Zone in the Municipal Corpo- ration, which has an area of 32.889 sq km. But as considering the population density it is a second lowest Zone. Its popula- tion density is 5654. The road density of this Zone is also less. This is because; the major area of this Zone is occupied by an International Airport and MIDC chikkalthana. The average
IJSER © 2013 http://www.ijser.org
International Journal of Scientific & Engineering Research, Volume 4, Issue 7, July-2013 2594
ISSN 2229-5518
length of road of this Zone is a second high among all Zones;
an Eta Index value is 0.6461.
6.6 Ward Zone ‘F’
As considering the population density and road density this is a good Zone among all other. But this zone does not have good Index values of Transportation analysis. An Alpha Index is used to measure the network structure in terms of the num- ber of the ways to proceed from one point to another. It has a lowest value of Alpha Index. Its Alpha Index value is 0.0588. This is because there are very less alternative routes to reach from one end to another end of these Zones. It has a lowest value of Gamma Index. The Beta value of this Zone is also less, because there is no proper connectivity between the node and vertex.
7 CONCLUSION
Ward Zone A is the largest Zone in AMC but its Road Density is a lowest among all Zones. Zone A and Zone E are having very less road density; the road density is below 1000 m per sq km and population density is also very less. There are only 2
Zones having a road density above 2000 m per sq.km and these are Zone C and Zone D. Relatively these Zones have a very small area, also population density is very high of these two Zones among other zones. According to the results, Zone A and Zone E and Zone F are having very less Alpha Index, Because there is no alternative routes to reach from one end to another end of these Zones. The Zone A, Zone C and Zone F are having very less connectivity. There are total 3 Zones which has average length above 0.5 km per road line and these are Zone A, E and F; and Zone C and Zone D has low Eta val- ues, because these Zone having a small area.
The observations of AMC Zones are as follows
• Zone A is identified as an “Undeveloped Zone”.
• Zone B is a well planned Zone.
• Zone C and Zone D is identified as a “Highly Burn
Zone”.
• Zone E and Zone F are relatively good Zones.
An overall result of Aurangabad city is good. The study re- veals that the Aurangabad is good in transportation facilities; also it reveals the importance of GIS in the field of administra- tion for the Local Governments especially the Municipal Cor-
poration.
Journal of Engineering Research and Applications (IJERA) ISSN: 2248-9622, Vol. 3, Issue 3.
[7] S. Kazemi and S. Lim (2006), Deriving Multi-Scale GEODATA from TOPO-
250K Road Network Data. http://www.gmat.unsw.edu.au/snap/publications/kazemi_etal2006a.pdf
[8] Alistair Edwardes and William Mackaness (2000), Intelligent Generalisation of Urban Road Networks. http://www.geos.ed.ac.uk/homes/wam/EdwardesMack2000b.pdf
[9] Haizhong Qian, Liqiu Meng and Meng Zhang (2007), Network simplification based on the algorithm of polarization transformation, ICC2007 ORAL Paper Theme 10 Session 6 Paper 2. http://www.lfk.bv.tum.de/fileadmin/user_upload/publications/meng/pa per/paper02.pdf
[10] T. E. Samsonov and A. M. Krivosheina (2012), Joint generalization of city
points and road network for small-scale mapping, Proceedings, GIScience.
http://www.giscience.org/proceedings/abstracts/giscience2012_paper_129. pdf
[11] Alistair Edwardes and William Mackaness, Road Network Simplification in
Urban Areas. http://www.geo.uzh.ch/~aje/pdf/edwardes%20mackaness
%20-%20road%20network%20simp% 20in%20urban%20areas.pdf
[12] http://help.arcgis.com/en/arcgisdesktop/10.0/help/index.html#//003n00
00007n000000
[13] http://help.arcgis.com/en/arcgisdesktop/10.0/help/index.html#/Feature_
class_basics/003n00000005000000/
[14] http://help.arcgis.com/en/arcgisdesktop/10.0/help/index.html#/Topolog y_in_ArcGIS/006200000003000000/
[15] http://blogs.esri.com/esri/arcgis/2013/02/07/export-topology-errors/
[16] http://webhelp.esri.com/arcgisdesktop/9.3/index.cfm?TopicName=What_i s_a_network_dataset%3F
[17] David Levinson (January 2012), Network Structure and City Size, PLoS ONE Journal | Volume 7 | Issue 1 | e29721.
[18] R.V.Vinod, B. Sukumar and Ahalya Sukumar (2003), Transport Network
Analysis of Kasaragod Taluk, Kerala Using GIS, Indian Cartographer.
[19] Dr. Cesar Ducruet and Dr. Jean-Paul Rodrigue, Graph Theory: Measures and
IndicesAuthors. http://people.hofstra.edu/geotrans/eng/methods/tg_methods.html
REFERENCES
[1] Amol D. Vibhute and Dr. Bharti W. Gawali (May-Jun 2013), Analysis and Modeling of Agricultural Land use using Remote Sensing and Geographic In- formation System: a Review, International Journal of Engineering Research and Applications (IJERA) ISSN: 2248-9622 Vol. 3, Issue 3.
[2] Mezyad Alterkawi (2001), Application of GIS in Transportation Planning: The
Case of Riyadh, the Kingdom of Saudi Arabia, Alterkawi M GBER Vol. 1 No.
2 pp 38-46.
[3] Dr. Pankaj Gupta, Dr. Neelam Jain, Prof. P. K. Sikdar and Dr. Kishor Kumar
(2003), Geographical Information System in Transportation Planning, Map
Asia Conference 2003.
[4] http://www.veethi.com/places/maharashtra-aurangabad-district-374.htm
[5] http://aurangabad.nic.in/newsite/history.htm
[6] Ajay D. Nagne and Dr. Bharti W.Gawali (May-Jun 2013), Transportation
Network Analysis by Using Remote Sensing and GIS A Review, International
IJSER © 2013 http://www.ijser.org


