612
International Journal of Scientific & Engineering Research, Volume 5, Issue Ř, y-2014
ISSN 2229-5518
Real Time Approach of Piezo Actuated Beam
Using G-Programming
S.Saju B.E.,M.E.,(Ph.d) Assistant Professor
Department of Instrumentation and control Engineering, Saranathan college of Engineering, saju-ice@saranathan.ac.in
G.Uma Maheswari, R.Hemamalini, S.Vasugipottramarai
Final Year Students
Department of Instrumentation and control Engineering, Saranathan college of Engineering, Trichy, India.
candude007@gmail.com
Abstract— Piezo-actuated beam is used for wireless seismic measurement and indication using Lab VIEW. Principle of piezoelectric materials has been utilized here i.e. Piezoelectric materials deform when a voltage is applied to them and inversely will produce a voltage when they are deformed. For this reason, they can be used as both sensors and actuators. Here, Lab VIEW 2013 version, NI ELVIS (Educational Laboratory Virtual Instrumentation Suite) and Bluetooth device connected with PC has been utilized for acquiring and indicating vibration. The developed design is expected to be used universally for measuring seismic waves and also in Industrial applications for the measurement of micro vibration.
Index Terms—Seismic measurement, Lab VIEW, wireless communication
—————————— · ——————————
1 INTRODUCTION
ibration measurement is an important factor in predictive maintenance. Peizo actuated beam are used for this pur-
pose. A flexible aluminum beam is considered in this paper. Piezo electric sensors are bonded to the surface of the beam. The bonded patches on the surface of the beam acts as a sensor which is connected to a DAQ board.
The need of data acquisition is to measure physical phenome- non such as voltage, current, temperature etc... Computer based data acquisition utilizes a combination of application software ,modular hardware, and a PC to take measurements. Data acquisition systems integrate signals, actuators, sensors, signal conditioning, data acquisition devices, and application software.
Data Acquisition is the technique of Acquiring signals from
real-world, digitize the signals and Analyze, presenting and saving the data.
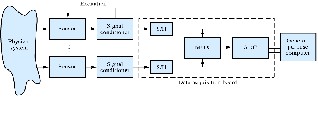
Figure 1 Block diagram of the system
Bluetooth is a wireless protocol for exchanging data over short range of distances (using short-wavelength in the ISM
band from 2400–2480 MHz radio transmissions) from fixed and portable devices, creating PANs with high security. Creat- ed in 1994 by telecom vendor Ericsson, it was replaced as a wireless alternative to RS-232 wired data cables. It can connect many devices and overcame the problem of synchronization. It is a packet-based protocol with a server-client structure. One server can communicate up to 7 clients in a piconet; all devices share the Server's clock. Packet sharing is based on the basic clock, defined by the server, which ticks to about 312.5 μs in- tervals. Two clock ticks constitute a slot of 625 μs; two slots constitute a slot pair of 250μs.
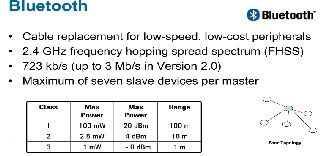
Figure 2 Bluetooth Features
LabVIEW (Laboratory Virtual Instrument Engineering Work- bench) is a system based platform and development environ- ment for a visual programming language from Instruments. The graphical language is named "G". It was originally re- leased for the Apple Macintosh in 1986, LabVIEW is common- ly used for instrument control, data acquisition and industrial
IJSER © 2014 http://www.ijser.org
613
International Journal of Scientific & Engineering Research Volume 5, Issue Řǰȱ ¢-2014
ISSN 2229-5518
automation on a variety of platforms including Microsoft
Windows, various versions of UNIX, Linux, and Mac OS X.
2 SEISMIC MEASUREMENT SYSTEM
2.1 Main objective
The aim of this work is to measure the seismic waves at the epicenter using wireless sensor network and indication using VI.
A VI (virtual instrumentation) system is the use of modular measurement hardware and customizable software to create user-defined measurement system.
The data acquisition hardware and software modules of National Instruments (NI) LabVIEW has turned into one of the most highly used tools that views, cap- tures, processes and controls. Hence, NI hardware has also been utilized in our project work . Its a recent approach for Wireless based strain measurement.
2.2 Block Diagram
The block diagram of the seismic measurement system devel- oped is shown in Figure and the function of each block is ex- plained in detail below.
TRANSMITTER END


RECEIVER END


BLUETOOTH DEVICE
Bluetooth is a wireless technology that uses 2.4 GHz RF (radio frequency) to communicate between devices within a 30 to 40- foot range. Initially it was advanced to communicate wire- lessly with PDAs,cellular phones, and laptop computers. This simple protocol and ease of its implementation make it an ideal protocol for wireless communication across a different set of products in industries. Engineers are utilising it to de-
velop instrument control applications and remote data acqui- sition . Lab VIEW 2013 include Bluetooth VIs with which Lab VIEW developers can construct custom Bluetooth applica- tions. This application note illustrates how to construct a Lab VIEW software for communicating with Blue-tooth enabled devices.
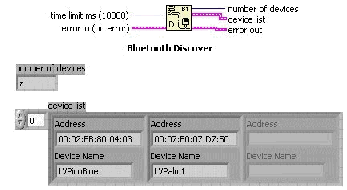
Creating Bluetooth master and slave applications in Lab VIEW is likely same as creating master and slave applications for TCP communication. A Bluetooth server (master) makes use of the Service Discovery Protocol (SDP) for broadcasting the availability of the services incorporate and listens for inbound connections. A slave creates an outbound RFCOMM connec- tion to a master. Once the slave and master connect to each other, they share data until the slave or master terminates the connection or unless the connection is lost. There is no inbuilt security in the Bluetooth protocol, although a number of de- vices include settings that need slaves to log in before access- ing Bluetooth services.
This technology is a short-range communications technology that is simple and secure everywhere. It is aimed to replace the cables connecting devices, while maintaining high range of security. The key features of this technology are low cost, low power, and robustness.
SENSOR UNIT WITH QUAKE SYSTEM
A piezoelectric sensor is a device that uses the piezoelectric effect, to measure changes in pressure, accelera- tion, strain or force by converting them to an electrical charge. Here, it measures changes in vibration / strain and produces voltage. The sensor unit consists of a cantilever beam with piezo-electric sensors sandwiched on their side. The cantilever beam was fixed to a quake system. Quake system consist of a model building whose basement contains shake table to pro- duce artificial quake effect. The vibration is sensed by the sen- sor which is converted to voltage is measured and monitored in Labview .

Figure 3 Real system mounted on a platform
IJSER © 2014 http://www.ijser.org
614
International Journal of Scientific & Engineering Research Volume 5, Issue Řǰȱ ¢-2014
ISSN 2229-5518
DAQ UNIT:
DAQ card is required for the interfacing purpose. Hardware functionality includes 2 analog outputs, 16 analog inputs, 24 digital I/O, triggering , counter/timers and synchronization circuitry. Data acquisition involves collecting signals from measurement sources and digitalizing the signal for storage, analyzing and presenting it on a Personal Computer. Data ac- quisition (DAQ) systems comes in many different PC technol- ogy forms for good flexibility while choosing your system. Scientists and engineers can choose from USB,PCI, PXI, PXI Express, PCI Express, PCMCIA, Wireless and Ethernet data acquisition for testing, measurement, and automation applications.
Five components that are to be considered when building a basic DAQ system are
• Transducers and sensors
• Signal conditioning
• Signals
• DAQ hardware
• Driver and application software
NI ELVIS
NI ELVIS combines hardware and software into one complete laboratory suite. NI ELVIS (Educational Laboratory Virtual Instrumentation) features an integrated suite of regularly used instruments in a single compact form factor constructed for education purposes.
i l i t t

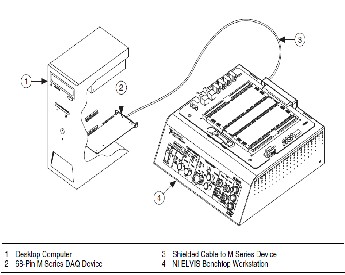
INTERFACING SENSOR UNIT WITH LAB VIEW
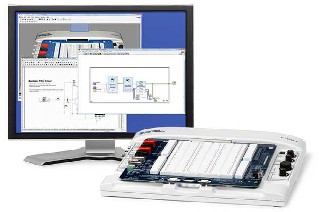
Figure 5 Interfacing with system
3 G-CODE FOR WIRELESS TRANSMISSION
1 Transmitter with DAQ
1.1 Block Diagram:
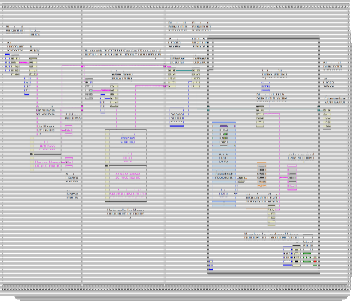
Figure 6 Labview Block Diagram of the system
Personal computer with lab VIEW 2013 version using NI- ELVIS has been used for acquisition and Indication of strain (seismic) in our present work.
IJSER © 2014 http://www.ijser.org
615
International Journal of Scientific & Engineering Research Volume 5, Issue Řǰȱ ¢-2014
ISSN 2229-5518
1.2 Front Panel:
Figure 7 Labview Front Panel of the system
Description of each block in block diagram:
a. The following steps to design a Bluetooth server applica- tion.
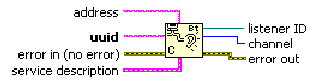
1. Creating Bluetooth service – Use the Bluetooth Create Listener function to create a bluetooth ser- vice discovered by a bluetooth uuid. This function retreats a listener ID which refers to this master through LabVIEW software. It also returns a re- served BT channel that the master can use to listen for an inbound connections. A BT channel is a global resource with exactly 30 channels available on any BT device. If no master channel is available, the function indicates an error.
Figure 8 Bluetooth Create Listener
2. Wait for incoming connection request – Use the Bluetooth Wait on Listener function to wait for and obtain an incoming connection request from a slave. This function gives a connection ID that is used to share data
with the slave.
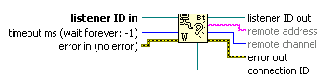
Figure 9 Bluetooth Wait on Listener
3. Read and Write data – Use Bluetooth Read and Bluetooth Write functions to exchange data with the slave.
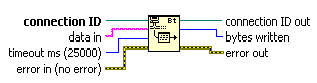
Figure 10 Bluetooth Read and Bluetooth Write
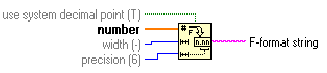
4. Signals are acquired using DAQ assistant and for writ- ing data to a Bluetooth network connection they are con- verted to F-format string using Number To Fractional String Function.
Figure 11 Bluetooth Read and Bluetooth Write
5. Close connection – Use Bluetooth Close Connec- tion function to end connection to the slave and to termi- nate listening for incoming connections.
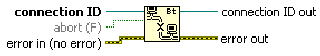
Figure 12 Bluetooth Close Connection
6. Use the Bluetooth RFCOMM Service Discovery VI to find available RFCOMM services on a local/remote device. This function returns a number of available services list with the associated channel number. The channel number in the available services list can be used as an input variable of the Bluetooth Open Con- nection function to enable connections to the corre- sponding services on the remote BT device.
IJSER © 2014 http://www.ijser.org
616
International Journal of Scientific & Engineering Research Volume 5, Issue Řǰȱ ¢-2014

ISSN 2229-5518
Figure 14 Flat Sequence Structure
c. DAQ Assistant Express VI
Figure 13 Bluetooth Discovery Function
A Bluetooth system in Palm OS and Pocket PC of- fers serial-port profile along with virtual serial driver. Bluetooth Serial Port (BSP) profile defines technique that the devices use to rival a RS-
232/serial cable connection. Virtual Serial COM
ports are mapped to actual BT channels. This Serial Port profile enables to use LabVIEW Serial VIs for opening a connection to and share data with other Bluetooth devices.
The driver at a time recognizes only one active se- rial channel . The serial channel can be opened as an outbound (slave) port or as an inbound (master) port. When the port is opened as an outbound (slave) port, the driver prompts to select a Blue- tooth device (master) to connect to. When the port is opened as an inbound (master) port, the driver keeps waiting to receive a connection request from the slave. BT serial port is based upon RFCOMM, which differs from a physical serial port. RFCOMM requires role of a master and a slave when establishing Bluetooth serial connection. Thus, transmitting acquired signal wirelessly to client (slave) node.
b. Flat Sequence Structure
Contains of one or more sub diagrams, or frames, that se- quentially executed. Use this structure to ensure that a sub diagram are executed before or after another sub-diagram. Data flow for the Flat Sequence structure is different from flow of data for other structures. Frames in the structures compiles from left to right & if all the data values which are wired to a frame are available. After execution of the frame the data leaves each frame. This means the input of one frame depends on the output of another frame.
Creates, edits, and runs tasks using NI-DAQmx . This software proceeds further beyond a basic DAQ driver to deliver improved performance and productivity. Signals acquired by NI-Elvis is supported by this and expressed using graph indicators.
2 Receiver
2.1 Block Diagram:
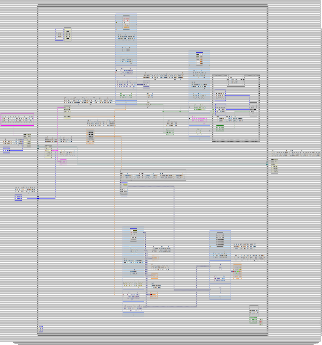
Figure 15 Labview Block Diagram of the system
IJSER © 2014 http://www.ijser.org
617
International Journal of Scientific & Engineering Research Volume 5, Issue Řǰȱ ¢-2014
ISSN 2229-5518
2.2 Front Panel:
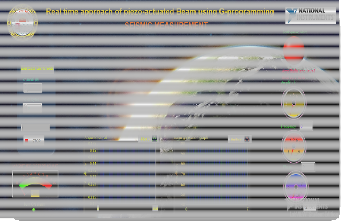
Figure 16 VI Front Panel diagram of the system
Description of each block in block diagram:
I. WHILE LOOP
This repeats the code within its sub diagram until a specific condition is satisfied. A While Loop always executes at least once.
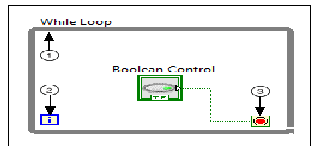
Figure 17 While loop structure
Components of a While Loop
Sub diagram—Contains code that the Loop executes once per an iteration.
Iteration Terminal —Provides current loop iteration count. The loop count starts at 0 for the initial iteration. When the count exceeds 231-1, the iteration terminal re- mains at 2,147,483,647 for all upcoming iterations.To keep count of more than 2,147,483,647 iterations, shift registers with a greater integer range can be utilized .
The Conditional Terminal—calculates a Boolean input value to check if to continue executing the While Loop or not. To specify when the loop stops for a TRUE / FALSE Boolean value, configure the continuity behav- ior of the while loop. While wiring an error cluster to the conditional terminal, one can also determine when the loop terminates.
II. Formula Express VI
Uses a calculator interface for creating mathematical formulas and for performing most math functions that a scientific calcu- lator can compute. Magnitude of earthquake is found using this formula bar. Amplitude is found using Tone Measure- ments Express VI and time period is found using Timing and Transition Measurements Express VI
III. Mask and Limit Testing Express VI
This VI performs and undergoes limit testing on the Signals. The Express VI compares the Signals with limits that the user sets and returns the output of the comparison at each of the data point. It also returns an array of waveforms that consists the lower limit and upper limit, the failures, and the signal. Using this, earthquake signatures are detected and recorded.
IV. Display Message to User Express VI
Displays a standard dialog box that contains an alert or a mes- sage for users. At high seismic's message is displayed to user and alarm is generated using Beep (Windows) VI which caus- es the system to issue an audible tone whose duration and frequencies can be altered.
V. The following steps to develop a Bluetooth slave application.
1. Request a connection to Bluetooth master – Use the Bluetooth Open Connection function for con- necting to a service on a Bluetooth master. Fix the channel number to 0 and specify a BT uuid to identify and detect which service to connect to. This function performs an SDP query to connect with the first service that is found with similar uuid. Internally, the output of a SDP query is a RFCOMM channel number to connect with . This query is a tool for translating uuid to a channel number.
If the channel number is known which is engaged with the service earlier , the channel number used is ‘0’. Specifying a non-zero channel number skips the internal SDP query operation thus decreasing the rate of time it takes to connect with the ser- vice. When the channel number is not zero, Lab VIEW ignores or skips the uuid input parameter.
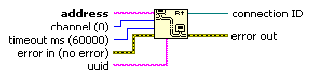
Figure 11 Bluetooth Open Connection
IJSER © 2014 http://www.ijser.org
618
International Journal of Scientific & Engineering Research Volume 5, Issue Řǰȱ ¢-2014
ISSN 2229-5518
Note: Use the Bluetooth RFCOMM Service Discov- ery VI for finding a valid channel number that is asso- ciated with a service on a remote BT device. The VI processes a SDP RFCOMM service which results in a channel number discovery that can be used for con- necting with the corresponding service on the remote BT device.
Figure 12 Bluetooth RFCOMM Service Discovery
VI
2. Read and Write data – Use Bluetooth Read and Bluetooth Write functions to share data with the master.
3. Close connection – Use Bluetooth Close Connec- tion function to close connection to the master.
4 CONCLUSION
Using Lab view vibration was indicated, thus measuring seismic. The LabVIEW measurement platform has dramatical- ly decreased the test times as outputs were automatically reg- istered. This type of vibration measurement system can also be used in industrial applications for measuring vibrations in machineries.
ACKNOWLEDGMENT
The authors sincerely thank Engineers from National Instru- ments, Bangalore, India and Saranathan College of Engineer- ing, Trichy, India, for supporting this project work.
REFERENCES
[1] EDWARD F. C RAWLEY AND ERIC H. ANDERSON “Detailed Models of Piezoceramic Actuation of Beams” Space Engineering Research Center
Massachusetts Institute of Technology
Cambridge, MA 02139
[2] Dr. Haichang Gu – Postdoctoral Mentor
Dr. Gangbing Song – Faculty Mentor
“Use of Piezoelectric Materials for Strain Measurements and Wave
Propagation Analysis”
Alexandra Woldman – Undergraduate Researcher
University of Houston, Houston, TX
[3] K. Wolf & O. Gottlieb
“Non-linear Dynamics of a Cantilever Beam Actuated by
Piezo electric Layers in Symmetric & Asymmetric Configurations” Materials Mechanics Laboratory
Faculty of Mechanical Engineering,Technion— IIT
[4] S.Neduncheliyan,M.Umapathy,D.Ezhilarasi
“SIMULTANEOUS PERIODIC OUTPUT FEEDBACK CONTROL
FOR PIEZOELECTRIC ACTUATED STRUCTURES USING
INTERVAL METHODS”
National Institute of Technology, Tiruchirappalli-620015.India. INTERNATIONAL JOURNAL ON SMART SENSING AND INTELLIGENT SYSTEMS,VOL.2,NO.,3.SEPTEMBER-2009
[5] S.Saju B.E.,M.E.(Ph.D)

“Zigbee- based seismic measuring instrument to empower the
country”,
R V S College oF Engineering & Technology,Dindigul ,Techtop-2010
[6] HANS-PETTER HALVORSEN,
“Wireless Data Acquisition in LabVIEW” , 2011.02.03
Faculty of Technology, Norway.
[7] Kalpana H.M,John R Stephen
“VIRTUAL INSTRUMENTATION FOR MEASURING STRAIN USING THIN FILM STRAIN GAUGE SENSORS”
Siddaganga Institute of Technology, Tumkur– 13
International journal of advanced research in Engineering & Technology© IAEME and Technology (IJARET), ISSN 0976 –
6480(Print),ISSN 0976 – 6499
Volume 1,Number 1, July - Aug (2010), pp. 68-76
[8] National Instruments: Test, Measurement, and Embedded Systems www.ni.com
IJSER © 2014 http://www.ijser.org