International Journal of Scientific & Engineering Research, Volume 4, Issue 11, November-2013
ISSN 2229-5518 1241
Rapid Solidification of Al-7 wt.% Si Using The
Twin-Roll Technique
Maftah H. Alkathafi and Awanikumar P. Patil
Abstract— The aim of this study is to understand the improvement in the properties of Al-7% Si with rapid solidification processing using the twin–roll technique. The process is based on two rolls rotating in opposite direction with 3900 revolution per minute (r.p.m.). The rapid solidification leads to a fine particle distribution of the second phase in the aluminium matrix. It is found in the metallographies test that the second phase undergoes coarsening on annealing and extent of coarsening increases with increasing annealing temperature (200, 300, 400 and 500 ![]() ). It is also found that the micro- hardness is increased with rapid solidification and decreased in subsequent annealing. The micro-hardness depends on the thickness of the ribbon where with lower thickness the micro-hardness increases because of the highest cooling rate. This is attributed to increasing the chilling effect on de- creasing thickness of ribbon. X-ray diffraction was employed and it was found that the lattice parameter of rapidly solidified sample was more than the slowly cooled one. It is attributed to entrapment of silicon in the aluminium matrix owing to rapid solidification.
). It is also found that the micro- hardness is increased with rapid solidification and decreased in subsequent annealing. The micro-hardness depends on the thickness of the ribbon where with lower thickness the micro-hardness increases because of the highest cooling rate. This is attributed to increasing the chilling effect on de- creasing thickness of ribbon. X-ray diffraction was employed and it was found that the lattice parameter of rapidly solidified sample was more than the slowly cooled one. It is attributed to entrapment of silicon in the aluminium matrix owing to rapid solidification.
Keywords: Rapid Solidification, Twin-Roll Technique, Annealing, Al-7% Si.
—————————— ——————————
C ast Aluminium-Silicon alloys have been studied in detail due to their excellent combination of properties such as fluidi- ty, low coefficient of thermal expansion and high wear re- sistance. The Al-Si phase diagram is a simple eutectic system type; two metals are completely soluble in the liquid state but silicon is only partly soluble in the FCC structure of Al, while the solid solubility of Al in Si is negligible. The phase diagram for Al-Si is shown in Figure 1. The melting point of aluminium and silicon are 660.37![]() and 1414
and 1414![]() respectively. The eutectic temperature is 577
respectively. The eutectic temperature is 577![]() with eutectic composition of 12.6 wt.% Si and the maximum solubility of Si in Al is 1.65 wt.%. Hypo- eutectic alloys form coarse dendrite grains of alpha-Al and large brittle flakes of Si. Such cast structure is brittle and ex- hibits poor ductility and also makes machining difficult. For this reason, Al-Si eutectic is modified with additives like Ce, Sr, No, Sb, CA, P, B, etc. to improve strength and ductility of the alloys [1],[2],[3]. A method called ‘Strain Induced Melt Ac- tivation’ (SIMA) is also used to obtain globular αAl grains [4].
with eutectic composition of 12.6 wt.% Si and the maximum solubility of Si in Al is 1.65 wt.%. Hypo- eutectic alloys form coarse dendrite grains of alpha-Al and large brittle flakes of Si. Such cast structure is brittle and ex- hibits poor ductility and also makes machining difficult. For this reason, Al-Si eutectic is modified with additives like Ce, Sr, No, Sb, CA, P, B, etc. to improve strength and ductility of the alloys [1],[2],[3]. A method called ‘Strain Induced Melt Ac- tivation’ (SIMA) is also used to obtain globular αAl grains [4].
As a result of this modification Al-Si alloys are finding a large number of applications in automobile industries [5]. In
addition, rapid solidification of metals and alloys has become a field of extensive attention, since this method offers prospect of new or improved engineering materials with superior
————————————————
• Maftah H. Alkathafi, Faculty of Engineering, Sirte University
P.O.Box 565, Sirte-Libya, maftahok@hotmail.com
• Awanikumar P. Patil,Department of Metallurgical and Materials Engi- neering,Visvesvaraya National Institute of Technology, Nagpur
440010 (India).)
properties. All methods of rapid solidification produce struc- tures which otherwise can not be obtained economically by
other manufacturing techniques like casting, rolling or forg- ing. In addition, the creation of certain shapes such as ribbons, wires, powder particles may be aspired to meet certain re- quirements. Rapid solidification of alloys leads to extension of solid solubility, decreasing grain size, and enhanced super- saturation of alloying elements [6]. The twin-roll technique is one of the techniques that are used for rapid solidification processes. The technique essentially consists of melting an alloy charge in a crucible and pouring the melt directly into a gap between a pair of rapidly counter-rotating rollers held together by special design. The resulting material emerges from the nip, the thickness of solidified material is a function of contact time (or residence time) with the roller surface, while the overall thickness of the solidified material is partial- ly controlled by roll gap. The products from various rapid quenching techniques come under the general classification of powder, flake, foil and wire. These products exhibit unique microstructure which may be amorphous (metallic glasses), microcrystalline or other structures. The present work deals with modification of Al-Si alloy micro-structure without the addition of a modifier by employing a twin roll technique.
The equipment that has been used in the work to produce rap- id solidified specimens by the twin-roll technique is shown in Figure 2. Double rolls are made of red copper and each has a diameter of 75mm and length 100mm. Copper is chosen be- cause it has a very high thermal conductivity and thus will be able to produce a greater chilling effect without artificial cool- ing arrangement. The pure Al and Al-7% Si were melted in
IJSER © 2013 http://www.ijser.org
International Journal of Scientific & Engineering Research, Volume 4, Issue 11, November-2013
ISSN 2229-5518 1242
covered crucible, starting from virgin metals, in a furnace maintained at 750 °C and 950°C, respectively.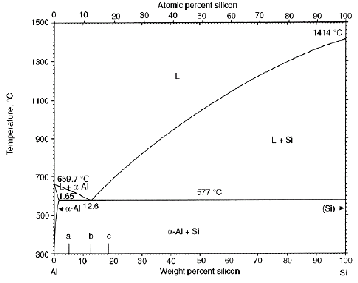
Fig. 1. Al-Si Phase Diagram [7]
The rolls were cleaned to remove any contamination from their smooth surface, and cooled by pieces of ice for a long time until the roll temperature was close to ice temperature. The speed of rolls was fixed at about 3900 r.p.m. and that is the maximum speed that could be obtained from the equipment. When the rolls reached to the maximum speed the molten ma- terial was poured into the gap of about 0.3mm between the rolls. The crucible was kept very close to the gap during pour- ing to minimize chances of air pick-up and oxidation. The mechanistic steps of rapid solidification are shown in Figure 3. In region-I the feed remains molten; solidification commences at the surface of cool rolls in the region-II and solidified mate- rial is being deformed in the region-III. The resultant speci- mens have different thicknesses less than 0.3 mm. On the other hand, samples of Al-7% Si and pure-Al were also obtained by casting and furnace cooling to obtain conventional cast struc- ture as reference specimens.
After rapid solidification specimens of Al-7wt.% Si and pure- Al with varying thickness were annealed at different tempera- ture, 200, 300, 400 and 500![]() for one hour. In addition, one 0.2 mm thick rapid solidified specimen was annealed at 500
for one hour. In addition, one 0.2 mm thick rapid solidified specimen was annealed at 500![]() for
for
20hrs. All samples that were exposed to annealing were cov-
ered with powdered flux to avoid surface oxidation.
The microhardness of Al-7wt% Si alloy sample was measured using a Vickers hardness testing machine. The applied load was 25g for a dwell time of 20 seconds. The micro-hardness
measurements were taken along two perpendicular axes on each side of the sample, and at least five readings were taken for each sample. The average of these readings is reported.
X-ray diffraction (XRD) technique was used to ascertain in- creased solid solubility of silicon in aluminium due to rapid solidification and also to find out if Al2 O3 and SiO2 formed in the alloy during melting due to oxidation. XRD was carried out on diffractometer with a copper tube target and a nickel filter in to obtain Cu Kα monochromatic radiation (![]() =
=
1.542![]() ). The x-ray diffractometer was rotated at speed in
). The x-ray diffractometer was rotated at speed in
2o/min, while the chart speed was selected to be 2cm/min. Two
samples of Al-7wt% Si with different cooling rates were sub-
jected to XRD. One of the samples tested was produced by
rapid solidification at a higher cooling rate and was 0.1mm
thick. The XRD machine was operated at an applied voltage of
32 KV and tube current of 25 mA. The other sample tested was
produced by the slower cooling rate (slow cooling) and was in
the powder form. For this sample the XRD machine was oper-
ated at an applied voltage of 40 KV and tube current of 35mA.
The speciments for metallography were prepared by mount- ing specimens in a cold setting resine. The liquid hardens in a matter of hours to yield a strong, convenient handle for hold- ing the specimen during the subsequent steps in surface prep- aration. The surface preparation involves wet polishing on a series of emery papers (600, 800 and 1200 grit) with water as a lubricant and final polishing was done by 1 micron alumina (Al2 O3 ). The Al-7%Si alloy specimens did not need etching owing to the fact that the particles of silicon appeared bright under the microscope. The microstructure of the specimens was examined under the microscope with different magnifica- tion.
The diffraction pattern analysis for the rapid solidified speci- men and slow cooled specimen is illustrated in Table 1 and 2, respectively. The inter-atomic spacing (a) can be determined for all possible h, k, l planes by the following equation:
a= d-measured ![]() (1)
(1)
The average value of the inter-atomic spacing (a) was estimat- ed to be 4.049![]() for Al (alpha Al) in rapidly solidified Al-
for Al (alpha Al) in rapidly solidified Al-
7wt%Si, as shown in Table 1. However, the average value of (a) was 4.0338![]() for Al (alpha Al) in slow cooled Al-7wt%Si as shown in Table 2. This increment in lattice parameter of Al (alpha Al) due to rapid solidification indicates that the more
for Al (alpha Al) in slow cooled Al-7wt%Si as shown in Table 2. This increment in lattice parameter of Al (alpha Al) due to rapid solidification indicates that the more
IJSER © 2013 http://www.ijser.org
International Journal of Scientific & Engineering Research, Volume 4, Issue 11, November-2013
ISSN 2229-5518 1243
solute is in the solution. This is attributed to insufficient time for the excess Si to diffuse out of the Al lattice and as a result the lattice is elongated. This also means that the rapid solidifi-
cation caused an increase in the solid solubility of Si in Al (to produce an alpha Al solid solution). This also indicates that by rapid solidification supersaturated solid solutions can be formed. It also indicates that inter-atomic spacing for Si in rap- idly solidified specimen is more (i.e. average value of 5.418) than that for Si in slow cooled specimen (i.e. average value of
5.406). This means that due to rapid solidification there was
insufficient time for Al atoms to diffuse out of Si lattice. Oxidation during melting of oxidizing elements like Al and Si is natural. Therefore, the oxide formed during melting is sep- arated from the melt with the help of a fluxing agent. Howev- er, in order to make sure that the oxide is not entrapped in the rapidly solidified alloy, it’s XRD spectrum was checked for the presence of their oxides (Al2 O3 and SiO2 ). The d-card for Al2 O3 shows a first peak at 5.45 ![]() , second peak at 3.47
, second peak at 3.47 ![]() and third peak at 3.72
and third peak at 3.72 ![]() . The d-card for SiO2 shows a first peak at
. The d-card for SiO2 shows a first peak at
6.73 ![]() , second peak = 4.74
, second peak = 4.74 ![]() and third peak at 3.33
and third peak at 3.33 ![]() . By
. By
comparison to the above values with d-measured in Table 1 and 2, it is clear that particles of these oxides are not en- trapped in the alloys.
![]()
Figure 4 presents the micro-structure of the slowly solidified alloy. In this figure large primary alpha-Al dendrites are seen in the coarse eutectic matrix. The microstructure is similar to those obtained by Chen et. al.[2] and Wang and Bian [3]. Large primary dendrites of alpha Al and coarse eutectic matrix form due to sufficient time available during slow cooling for the phases to precipitate and grow. Figure 5 shows the microstruc- ture of rapidly solidified alloys. It is evident that the structure is very fine and single phased and unlike Figure. 4, there is no sign of alpha-Al dendrites or coarse eutectic matrix. This is because of the fact that due to rapid solidification there was a large number of nuclei and each nucleus did not get enough time to grow. As a result the microstructure is so fine that it could not be resolved at 500X magnification. However, there was still enough time for crystallization to occur as evidenced by XRD results. Therefore it can be said that the rapid solidifi- cation of the alloy, by the present twin roll method, produced very fine polycrystalline structure.
The ribbons were annealed at different temperatures (200, 300,![]()
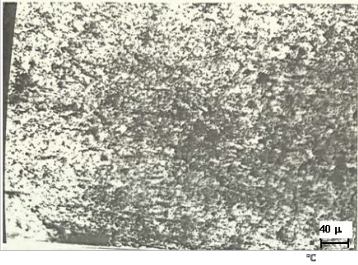
400 and 500![]() ) for one hour, and their microstructures are presented in Figures 6 to 9. It is evident that now some dark second phase is appearing, this may be Si. It is also observed that with increasing annealing temperature second phase (Si) particles become more and more coarse. In order to gain fur- ther information on the coarsening tendency of the silicon one sample was annealed at 500 for 20hrs and its microstructure
) for one hour, and their microstructures are presented in Figures 6 to 9. It is evident that now some dark second phase is appearing, this may be Si. It is also observed that with increasing annealing temperature second phase (Si) particles become more and more coarse. In order to gain fur- ther information on the coarsening tendency of the silicon one sample was annealed at 500 for 20hrs and its microstructure
is illustrated in Figure 10. The microstructure reveals that sili- con particles are spherical and randomly distributed in the aluminum matrix. This is attributed to outward diffusion of Si
from a supersaturated solid solution of Si in Al. This causes nucleation of separate Si phase and as the annealing continues more and more Si comes out of the supersaturated solid solu- tion. This continuous supply of Si during annealing causes growth and coarsening of Si nuclei into spherical Si particles. This explanation also holds good for microstructure shown in Figures 6 to 9 and due to less time available the particles are fine and sizes of the particle increases with increasing the an- nealing temperature. This is because more energy is available at a higher temperature so it causes faster diffusion and faster growth of the second phase is particles.
Table 3 presents the result of the micro - hardness test for 0.2 mm rapidly solidified Al-Si alloy and pure Al and also for slow cooled cast alloy and pure Al. It is evident that micro- hardness of rapidly solidified alloy is many times higher as compared to slowly cooled alloy. This is attributed to the for- mation of supersaturated solid solution alpha-Al (of Si in Al) and formation of very fine eutectic (which has very small in- ter-dendritic spacing) in rapidly solidified alloy as compared to slowly cooled alloy. The super-saturation causes more lat- tice distortion, as evident from XRD results, and thereby in- creases hardness. It is also evident that the micro-hardness of the alloy is much more than that of pure Al. This is because; the formation of alpha-Al solid solution in the alloy causes more Al lattice distortion and associated solid solution strengthening. Figure 11 summarizes the effect of annealing temperature on the micro - hardness of the rapid solidified sample. It is seen that the micro-hardness decreases with in- creasing the annealing temperature. This behavior is attribut- ed to decreasing distortion of Al lattice due to diffusion of Si out of solid solution. It is also found that the micro-hardness is affected by the ribbon thickness as well, as presented in Figure
12 and 13. It is evident that micro-hardness decreases with
increasing ribbon thickness. This is attributed to increasing degree of quenching and associated grain refinement. That is because with decreasing roll gap less molten metal can get into the roll gap and therefore the less molten metal comes in contact with the cold copper rolls. This produces more severe quenching with decreasing roll gap and vice-a-versa. Howev- er, the micro-hardness of pure Al increase by 12 units i.e. from
44 to 56 HV as against a rise of 31 units in case of Al-7%Si alloy on deceasing thickness from 0.25 mm to 0.15 mm. In case of pure Al there is no contribution of solid solution strengthening but the severity of quenching would certainly cause grain re- finement. This means that in the case of the Al-7% Si alloy, there is contribution of solid solution strengthening as well as grain refinement due to rapid solidification of Al-7% Si alloy.
IJSER © 2013 http://www.ijser.org
International Journal of Scientific & Engineering Research, Volume 4, Issue 11, November-2013
ISSN 2229-5518 1244
The microhardness of pure-Al and Al-7 wt% Si alloy in- creases by rapid solidification.
The growth morphology of Si is less spheroidal shape at rapid solidification but plate-like shape has observed at slow cooling .
The microhardness of Al-7 wt% Si is greater than pure-Al with rapid solidification.
The microhardness decreases as annealing temperature increases.
By increasing annealing temperature coursing of Si- particles take place.
The rapid solidification increases the solid solubility of Si
in Al- matrix.
The microhardness increases as ribbon thickness decreas-
es.
The first author would like to thank the Ministry of Higher Education and Scientific Research-Libya and the Industry Researches Centre-Tripoli for extending all the help in this study.
[1] Lipinski T., Archives of Foundry Engineering, Vol 8, (spe cial issue 3), 2008, p 55-58.
[2] Chen Z., Ma C. and Zhao J., Acta Metall. Sin. Vol 25, No 5,
2006, p 340-346.
[3] Wang L. and Bian X., J. Mater. Sci. Technol., Vol 16, No. 5,
2000, p 517-520.
[4] A. Sharma, SK Gupta, M Srikanth, RMZ-Materials and
Environment, Vol 59, No. 1, 2012, pp 19-26.
[5] Das S., Yegneswaran A.H. and Rohatgl P.K., J. Mater. Sci.,
Vol. 22 (No. 9), 1987, p. 3173.
[6] Steeb S. and Warlimont H., Rapidly Quenched metals, Vol.
1, 1984, p. 92.
[7] ASM Handbook Vol. 3: Alloy Phase Diagram, Edited by J L
Murray and A J McAlbata, 1984, Publishers: ASM Interna
tional, pp 321
.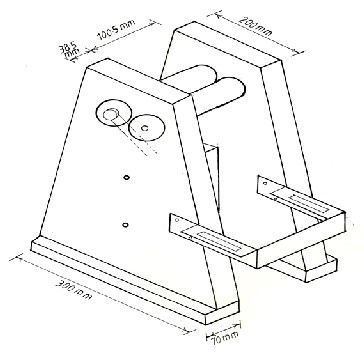
Fig. 2. Twin Roll Technique
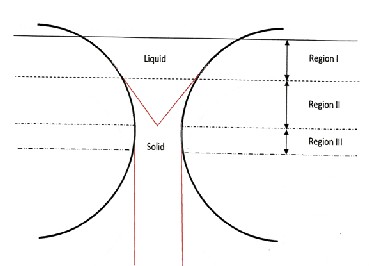
Fig. 3. The three steps of ribbon solidification during double roller quenching
IJSER © 2013 http://www.ijser.org
International Journal of Scientific & Engineering Research, Volume 4, Issue 11, November-2013
ISSN 2229-5518 1245
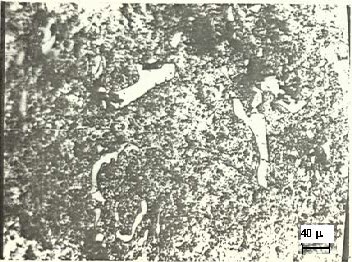
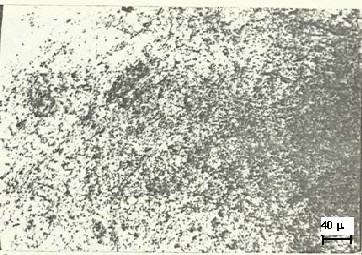
Fig. 4. Microstructure of slow cooling Al-7wt% Si, primary Al
(light) and eutectic matrix, 500X
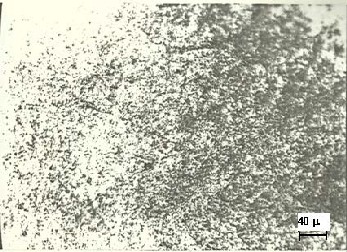
Fig. 5. Microstructure of rapidly solidified Al-7wt% Si, Al (light)
matrix and fine Si (dark) particles,500X.
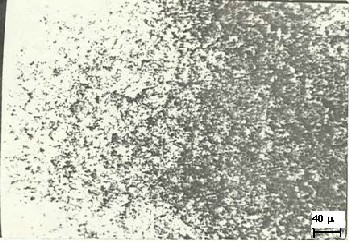
Fig. 6. Rapidly Solidified Al-7wt% Si, annealing at 200![]() for
for
1hr, 500X.
Fig. 7. Rapidly Solidified Al-7wt% Si, annealing at 300![]() for
for
1hr, 500X.
Fig. 8. Rapidly Solidified Al-7wt% Si, annealing at 400 for
1hr,500X.
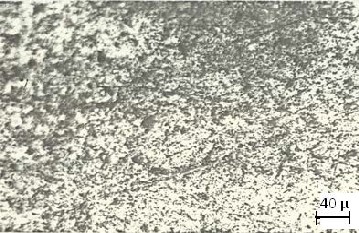
Fig. 9. Rapidly Solidified Al-7wt% Si, annealing at 500![]() for
for
1hr, 500X.
IJSER © 2013 http://www.ijser.org
International Journal of Scientific & Engineering Research, Volume 4, Issue 11, November-2013
ISSN 2229-5518 1246
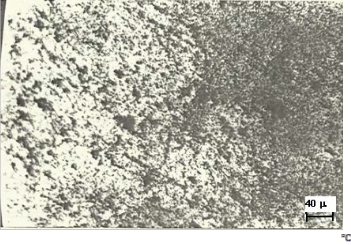
Fig. 10. Rapidly Solidified Al-7wt% Si and annealing at 500 for 20hrs, 500X.
Analysis of Data From a XRD Spectrum of Rapidly Solidified
![]()
![]()
![]()
Al-7 % Si
Analysis of Data From a XRD Spectrum of Slowly Cooled Al-7
% Si
2 |
| sin | d-measured | I |
28.60 | 14.3 | 0.2469 | 3.1227 | 0.6 |
38.60 | 19.4 | 0.3321 | 2.3216 | 13.55 |
45.00 | 22.5 | 0.3826 | 2.0151 | 5.20 |
47.68 | 23.84 | 0.4041 | 1.9100 | 0.50 |
65.4 | 32.7 | 0.5402 | 1.4270 | 2.60 |
78.5 | 39.25 | 0.6327 | 1.2185 | 2.50 |
I % | d-card | hkl | Elem. | a |
4.43 | 3.138 | 111 | Si | 5.410 |
100 | 2.338 | 111 | Al | 4.021 |
38.38 | 2.024 | 200 | Al | 4.030 |
3.69 | 1.92 | 220 | Si | 5.402 |
19.19 | 1.431 | 220 | Al | 4.036 |
18.45 | 1.221 | 311 | Al | 4.041 |
Effect of Rapid Solidification on Micro-hardness of Test Alloys.
Specimen | Micro-hardness (HV) | |
Specimen | Al-7% Si | pure-Al |
Rapid Cooling | 176 | 50.20 |
Slow Cooling | 55.62 | 32.30 |
I % | d-card | hkl | Elem. | a |
1.94 | 3.138 | 111 | Si | 5.426 |
100 | 2.338 | 111 | Al | 4.050 |
32.26 | 2.024 | 200 | Al | 4.0546 |
1.613 | 1.92 | 220 | Si | 5.4100 |
22.90 | 1.431 | 220 | Al | 4.048 |
20.0 | 1.221 | 311 | Al | 4.048 |
7.42 | 1.169 | 222 | Al | 4.051 |
6.452 | 1.169 | 222 | Al | 4.046 |
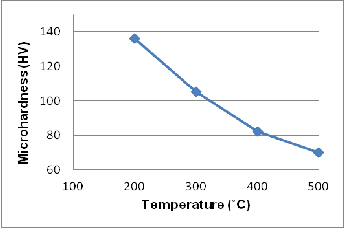
Fig. 11. The effect of annealing temperature on the micro - hardness of rapidly solidified Al-7% Si (annealing time:1hr)
IJSER © 2013 http://www.ijser.org
International Journal of Scientific & Engineering Research, Volume 4, Issue 11, November-2013
ISSN 2229-5518 1247
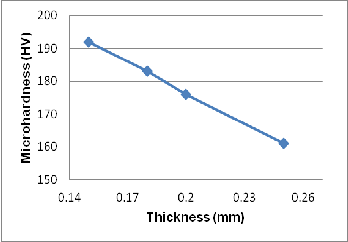
Fig. 12. Effect of ribbon thickness on micro-hardness of Al-7% Si
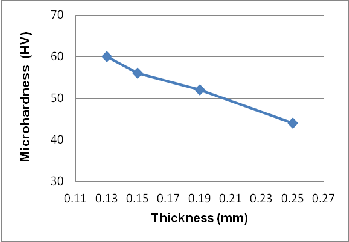
Fig. 13. Effect of ribbon thickness on micro-hardness of pure- Al
IJSER © 2013 http://www.ijser.org