International Journal of Scientific & Engineering Research, Volume 4, Issue 9, September-2013 789
ISSN 2229-5518
QUANTITATIVE MEASURES TO IMPROVE PROCESS POTENTIAL THROUGH PROCESS CAPABILITY
Vikas Chaudhary1, Dr. R. M. Belokar2
1,2Department of Production & Industrial, PEC University of Technology, Sec-12, Chandigarh
Email:chaudharyvikas9@gmail.com
Abstract -Quality improvement in an industry is done by an important tool which is widely used is Process capability analysis. Today producing high quality products at minimum cost is very challenging. This cannot be done without a systematic approach and this approach is contained within what has been called “Statistical Quality Control” (SQC) or “Industrial Statistics.” The segment of statistical
quality control discussed here is the process
eliminates scrap, rework and increases customer satisfaction. The benefits of performing process capability studies are certainly worth the effort in the long run. Process capability analysis is a technique applied in many stages of the product cycle,
including process, product design, manufacturing and manufacturing planning, since it helps to determine the ability to manufacture parts within the tolerance limits and engineering values. There are several
capability study.
capability indices, including C P , C PU , C PL
and
Keywords- Process Capability, SQC, PCI.
Now days, most companies work strongly in improving the quality levels of manufactured products. The measurement and evaluation of the production process performance using Process Capability Indices (PCI) are becoming more frequent.
C Pk , that have been widely used in manufacturing industry to provide common quantitative measures of process potential and performance
Process capability indices have been widely used to measure product qualities and process performance that meet specifications in the manufacturing industries. Many engineers use process capability
Traditionally, C P
and C Pk are the most commonly
indices as communication indicators to evaluate the
known process capability indices. However, many industrial processes have more than one quality characteristic and the need of the multivariate evaluation of process performance becomes more and more important. Process capability is so important because it allows one to quantify how well a process can produce acceptable product. As a result, a
manager or engineer can prioritize needed process improvements and identify those processes that do not need immediate process improvements. Process capability studies indicate if a process is capable of producing virtually all conforming product. If the process is capable, then statistical process controls can be used to monitor the process and conventional acceptance efforts can be reduced or eliminated entirely. This not only yields great cost savings in
eliminating non - value added inspections but also
manufacturing process. The following steps are recommended for constructing control charts for Process Capability Analysis:
IJSER © 2013 http://www.ijser.org
International Journal of Scientific & Engineering Research, Volume 4, Issue 9, September-2013 790
ISSN 2229-5518
![]()
![]()
∑ X
mean. Average ( ) =
N
![]()
∑ R
Range ( R ) =
N
process standard deviation (σ).![]()
R
![]()
Standard deviation (σ) =
d 2
![]()
for the mean chart ( X chart).![]()
![]()
Upper Control Limit (UCLX ) =
Lower Control Limit (LCLX) =
X + A2 R
![]()
![]()
X − A2 R
![]()
Upper Control Limit (UCLR ) =
D4 R
![]()
Lower Control Limit (LCLR ) = D3 R
![]()
9a: For the mean ( X ) chart, draw horizontal lines![]()
for X , UCLX
, and LCLX
9b: For the range R chart, draw horizontal lines for![]()
R , UCLR , and LCLR
![]()
10a: Plot each sample mean on the mean X control chart.
10b: Plot each sample range on the range R control chart.
IJSER © 2013 http://www.ijser.org
International Journal of Scientific & Engineering Research, Volume 4, Issue 9, September-2013 791
ISSN 2229-5518
After the points are plotted on control chart, they are interpreted and the following steps are followed:
1. Interpretation of the points on control charts.
2. Diagnosis the cause of change.
3. Identification of the corrective action.
4. Evaluation of corrective action.
If all the points are within limits, conclude that the process is in control & said to be stable and use the calculated limits for future monitoring of the process.
If any point fall outside of the control limits, conclude that the process is out of control, and begin
variation is given by the process standard deviation(σ). It is known that when only chance causes are operating the three sigma limits cover the entire range of variation of item measurements from the process. The quality six times the process standard deviation (SD) termed as process capability or natural tolerance or inherent variability of the process [31]. In the absence of any fundamental improvements, the process can’t be expected to yield products with less variability than given by process capability.
If the specifications LSL and USL are prescribed then process capability ratio is defined as :
= USL − LSL
![]()
a search for an assignable or special cause. When the C P 6σ
special cause is identified, remove that points and re-
evaluate the remaining points.
It is generally recommended that C P
> 1.33, in such
case the chance of producing a defective item is
After interpretation, control limits are recalculated to
almost zero. However, even if C P
> 1.33 defective
exclude the effects of out of control points for which process causes have been clearly identified and removed. Then recalculate and plot the new average range and control limits and repeat the identification / correction / recalculation sequence if necessary.
items will still be produced if the process average is
close to either of the limits. In order to ensure that this does not happen, the process average should be at a safe distance from either of the specification limits. This is assessed by calculating another index known as C Pk ratio.
When control chart for variables show a process to be
C Pk
![]()
USL − X
= Min ,
![]()
X − LSL
control, the pattern of variation of the individual
products can be taken to be stable, and a measure of![]()
![]()
3σ 3σ
IJSER © 2013 http://www.ijser.org
International Journal of Scientific & Engineering Research, Volume 4, Issue 9, September-2013 792
ISSN 2229-5518
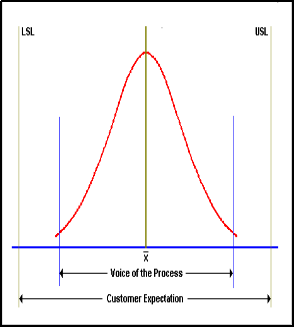
There are three components of process capability:
1. Design specification or customer expectation (Upper Specification Limit, Lower Specification Limit).
2. The centering of the natural process![]()
variation ( X ).
3. Spread of the process variations.
A minimum of four possible outcomes can arise when the natural process variability is compared with
the design specifications or customer expectations .
that the process is contained within four standard deviations of the process specifications.
Process)
This process will produce conforming products as long as it remains in statistical control. The process owner can claim that the customer should experience least difficulty and greater
reliability with this product. This should translate into higher profits.
C Pk values of 1.33 or greater are considered to be industry benchmarks. This means
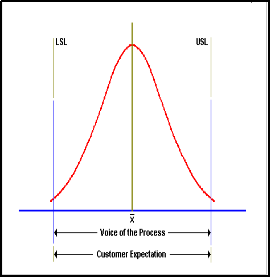
This process has a spread just about equal to specification width. It should be noted that if the process mean moves to the left or the right, a significant portion of product will start falling outside one of the specification limits. This process must be closely monitored. This process is contained within three to four standard deviations of the process
specification.

IJSER © 2013 http://www.ijser.org
International Journal of Scientific & Engineering Research, Volume 4, Issue 9, September-2013 793
ISSN 2229-5518
specifications even when it is in statistical control. If the specifications are realistic, an effort must be immediately made to improve the process (i.e. reduce variation) to the point where it is capable of
producing consistently within specifications.
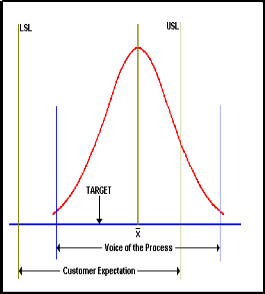
The variability(s) and specification width is assumed to be the same as in case 2, but the process average is off-center. In such cases, adjustment is required to move the process mean back to target. If no action is taken, a substantial portion of the output will fall outside the specification limit even though the
process might be in statistical control.
IJSER © 2013 http://www.ijser.org
International Journal of Scientific & Engineering Research, Volume 4, Issue 9, September-2013 794
ISSN 2229-5518
IV. CONCLUSION
Control charts are implemented for critical quality characteristics, and process is monitored to improve quality of the product and reduces the number of defectives. In this, quality improvements are quantified and inferences from these quantifications are drawn. Some recommended actions for the causes of the problems are also suggested and Cause & Effect diagram are drawn. Quality improvements are quantified in terms of C P , C Pk and number of defectives reduced. When process id found stable after increased values of capability indices are found and increased
[1]Heavlin, W. D. (1988). “Statistical properties of capability Indices”. Technical Report no. 320, Tech. Library, Advanced Micro Devices, Inc., Sunnyvale, CA.
[2] Kane,VE. (1986) Process capability indices.
Journal of Quality Technology 18, 23-30.
[3] Ramakrishnan B, Sandborn P, Pecht M. (2001) Process capability indices and product reliability. Microelectronics Reliability 41, 2067-2070.
[4] Montgomery D.C., (2005) Introduction to
Statistical Quality Control-Fifth edition, John
Wiley.
values in C P
& C Pk
means that there is a
[5] Kane,VE. (1986) Process capability indices.
continuous reduction in variation and reduction
in number of defective parts per million. The process improvement is found after monitoring the process with the help of control charts.
Journal of Quality Technology 18, 41-52.
[6] Wright PA. (2000) The cumulative distribution function of process capability index Cpm. Statistics and Probability Letters 47, 49-51.
[7] Pearn WL, Shu MH, Hsu BM. (2005) Monitoring manufacturing quality for multiple Li-BPIC processes based on capability index Cpmk. Int. Journal of Production Research
43(12), 2493-2512.
[8] Singhal, SC. (1991) Multi process performance analysis chart (MPPAC) with capability zones. Quality Engineering 4, 75-81.
[9] Pearn,WL, Chen, KS. (1988) New generalization of the process capability index Cpk. Journal of Applied Statistics 25(6), 801-810.
[10] Pearn WL, Shu MH, Hsu BM. (2005) Monitoring manufacturing quality for multiple Li-BPIC processes based on capability index Cpmk. Int. Journal of Production Research
43(12), 2493-2512.
IJSER © 2013 http://www.ijser.org