International Journal of Scientific & Engineering Research, Volume 5, Issue 5, May-2014 849
ISSN 2229-5518
Power System Security Analysis
B. Rajanarayan Prusty, Bhagabati Prasad Pattnaik, Prakash Kumar Pandey, A. Sai Santosh
Abstract: In this paper real time security analysis is carried out. First contingency selection is performed by calculating two kinds of performance indices. They are active power index (PI P ) and reactive power index (PI V ). MATLAB programming code is written to obtain the solution of load flow equations using Newton Raphson (NR) iterative method algorithm. The iterative method uses the elements of the bus admittance matrix (YBUS ). The MATLAB code for YBUS is written using the algorithm of singular transformation method. Finally the performance indices are calculated for contingency ranking. The effectiveness of the methods has been tested on an IEEE 25 Bus, 35 Line test system.
Index Terms – Security analysis, performance index, contingency selection, contingency ranking.
—————————— ——————————
1 INTRODUCTION
Power system security is one of the challenging tasks for the power system engineers. This security assessment is essential as it gives the knowledge of the system state in the event of contingency. Contingency analysis technique is being widely used to predict the effect of outages like failure of power system components such as generator, transformer, transmission line etc, and to take necessary action to keep the power system secure and reliable. Use of offline analysis to predict the effect of individual contingency is a tedious task as a power system contains large number of components. Practically, only selected contingencies will lead to severe conditions in power system. The process of identifying severe contingencies is referred as contingency selection and this can be done by calculating performance indices for each type of contingency. In this paper contingencies such as single transmission line and double transmission line outages are considered.
violations. The major components of contingency analysis are:
2.1 Contingency Definition
Contingency definition involves preparing a list of probable contingencies.
2.2 Contingency Ranking

Contingency Ranking in descending order is obtained according to the value of a scalar index, normally called as severity index or performance index (PI). PI is calculated using the conventional load flow algorithm for individual contingency in off line mode. Based on the values obtained contingencies are ranked in a manner where highest value of PI is ranked first. There are basically two types of performance indices that are of great use. These are active power index PI P and reactive power index PI V . PI P indicates violation of line active power flow whereas PI V indicates bus voltage magnitude violation. PI P can be calculated using
(1)
2 CONTINGENCY ANALYSIS
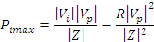
where
(2)
————————————————
• B. Rajanarayan Prusty is Assistant Professor, Department of Electrical and Electronics Engineering, National Institute of Science and Technology, Odisha, India, Ph-9861845744. E-mail: openeye.engg@gmail.com
• Bhagabati Prasad Pattnaik is Assistant Professor, Department of Electrical
and Electronics Engineering, National Institute of Science and Technology,
Odisha, India, Ph-7377630437. E-mail: klikbp@gmail.com
• Prakash Kumar Pandey, Department of Electrical and Electronics
Engineering, National Institute of Science and Technology, Odisha, India,
Ph-9438487014. E-mail: prakashkumarp00@gmail.com
• A. Sai Santosh, Department of Electrical and Electronics Engineering,
National Institute of Science and Technology, Odisha, India, Ph-
9040234311. E-mail: arjasantosh7@gmail.com
Contingency analysis avoids system troubles before they occur by studying the outage events and alerting the operators to any potential over loads or serious voltage
where L = Total number of transmission lines present in
the system
Pi = Active power flow in line i
Pima x = maximum active power flow in line i
Z = Impedance of the line connecting buses i and p
R = Resistance of the line connecting buses i and p
The second performance index PI V can be calculated using
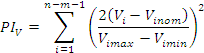 (3)
(3)
where n = Total number of buses present in the system
m = Total number of PV buses present in the system
n-m-1 = Total number of load buses present in the system
IJSER © 2014 http://www.ijser.org
International Journal of Scientific & Engineering Research, Volume 5, Issue 5, May-2014 850
ISSN 2229-5518
Vi = Voltage of bus i after load flow
Vinom = Nominal voltage at bus-i. Generally assumed as 1 pu
Vimin = Minimum voltage limit. Generally assumed
as 95% of Vinom .
Vimax = Maximum voltage limit. Generally assumed
as 105% of Vinom .
2.3 Contingency Selection
Contingency selection process consists of selecting the set of most probable contingencies in; they need to be evaluated in terms of potential risk to the system.
2.4 Contingency evaluation
Finally, the selected contingencies are ranked in order of their severity, till no violation of operating limits is observed.
3 RESULT AND DISCUSSION
In this paper the main focus is to perform contingency ranking by determining performance indices i.e. PI P and PI V values. Severe contingency is the case with highest value of performance index. Computation of these indices is done with help of NR iterative method under MATLAB environment. Pre and post contingency voltages at various buses are determined. For the contingency analysis an IEEE
25 bus, 35 line system is considered whose bus and line data are detailed in Appendix-A. The single line diagram of the system is as shown in Fig. 1.
TABLE 3
DOUBLE LINE OUTAGE TABLE FOR %PIP
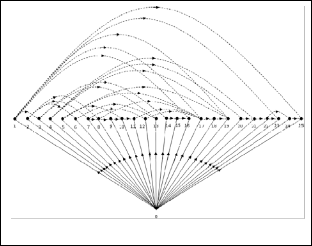
buses. Load flow is carried out using NR iterative method which acts as the steady state data. Load flow is again carried out after each contingency case which is referred as the post contingency data. Using equations (1) and (3) the performance indices are calculated. The graph of the system under study is as shown in Fig. 2 and it will be useful while developing YBUS matrix using singular transformation method.

Fig. 2. Graph of the system under study
Fig.1. Single line diagram of the system under study.
The system as shown in Fig. 1 consists of a slack bus numbered 1, 4 PV buses numbered from bus number 2 to 5 and remaining 20 are load buses. The system has total number of 35 transmission lines connected between various
35 single line outage contingency cases are considered and first 10 severity cases are tabulated both for %PI P and %PI V in Table-1 and Table-2 respectively.
IJSER © 2014 http://www.ijser.org
International Journal of Scientific & Engineering Research, Volume 5, Issue 5, May-2014 851
ISSN 2229-5518
In Table-1 and Table-2 contingency number 15 and 6
TABLE 1
SINGLE LINE OUTAGE TABLE FOR %PIP
respectively are the most severity cases. They are ranked 1 in the tables and are highlighted.
Similarly 595 double line outage contingency cases are
TABLE 2
SINGLE LINE OUTAGE TABLE FOR %PIV
considered and first 10 severity cases are tabulated both for
%PI P and %PI V in Table-3 and Table-4 respectively.
In Table-3 and Table-4 contingency number 222 and 100 respectively are the most severity cases. They are ranked 1 in the tables and are highlighted.
4 CONCLUSION
In this paper contingency selection and contingency ranking are made by calculating two important performance indices such as active power performance index (PI P ) and reactive power performance index (PI V ). These two indices were calculated for an IEEE 25 bus, 35 line test system. The severity of contingency cases such as single line outage and double line outage is accurately indicated by the numerical
TABLE 4
DOUBLE LINE OUTAGE TABLE FOR %PIV
values of PI P and PI V respectively. The indices are calculated in off line manner for a single loading condition. From the results obtained it can be concluded that the calculation of performance indices gives a good measure about the severity of all the possible line contingencies occurring in the system. The indices with higher value reflect a severe case which has the highest potential to make the system parameters to go beyond their permissible limits.
REFERENCES
IJSER © 2014 http://www.ijser.org
International Journal of Scientific & Engineering Research, Volume 5, Issue 5, May-2014 852
ISSN 2229-5518
[1] John J. Grainger, William D. Stevenson Jr., Power System
Analysis, McGraw-Hill, Inc., ISBN-0-07-113338-0.
[2] Jena D, Prusty B.R, Power System Analysis: Operation and Control, I.K. International Publishing House Pvt. Ltd., New Delhi, ISBN – 9789382332497.
[3] Stott B, Alsac O and Monticelli A.J, “Security Analysis and
Optimization”, Proc. IEEE, vol.75, No. 12, pp. 1623-1644, Dec
1987.
[4] Stott B and Alsac O, “Fast Decouple Load Flow”, IEEE Transactions on Power Apparatus and Systems, Vol. PAS-91, No.5, pp. 859-869, May 1974.
[5] Ejebe G. C and Wollenberg B.F, “Automatic Contingency Selection”, IEEE Transactions on Power Apparatus and Systems, Vol. PAS-91, N0.1, pp. 97-109, January 1979.
[6] Niebur D. And Germond A.J., “Power System Static Security Assessment using the Kohenen Neural Network Classifier”, IEEE Transactions on Power Systems, Vol. 7, No. 2, pp. 865-
872, May 1992.
APPENDIX – A
Table A.1: Bus data of IEEE 25 bus, 35 line System
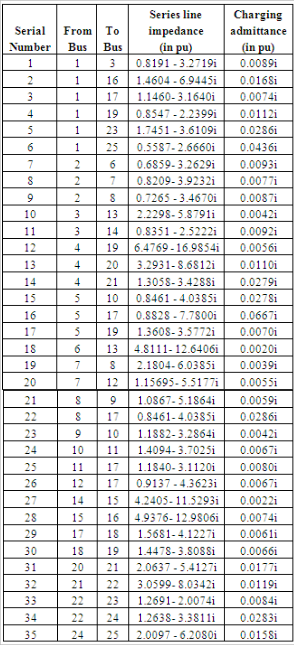
Table A.2: Line data of IEEE 25 bus, 35 line system

IJSER © 2014 http://www.ijser.org