International Journal of Scientific & Engineering Research, Volume 6, Issue 2, February-2015 929
ISSN 2229-5518
Potential Analysis of Grid Connected Wind
Turbine System in Peninsular Malaysia
Zainab Abdullah
Abstract— W ind energy is alternative energy which helps to promote cleaner environment, free, and contributes to reduce greenhouse gases (GHG) emission. The carbon dioxide (CO 2 ) emission of greenhouse gases causes global warming and climate change. Efforts have been taken on renewable sources to meet the energy demand as well as for sustainable life. This study identifies the potential of grid connected wind turbine (GCWT) system for domestic use in Kuala Besut, Peninsular Malaysia. This is done through designing and analyzing the system using HOMER software. The system configuration consists of wind turbine, grid model, load data and wind speed data. Domestic load and wind speeds as primary data are required to estimate the system designed. The simulation result shows that the GCWT system reduces the electricity bill to RM0.759/KW h instead of RM0.924/KW h by grid connected only. The lowest net present cost (NPC) of RM697,240 was found for the GCW T system compared to the grid system. It is concluded that GCWT system has a potential to be implemented in this area. Although the wind speed is low, but with proper design of wind turbine system the extraction of wind can be generated to cope with Peninsular Malaysia condition.
Index Terms— Grid connected, W ind turbine system, Performance and economic analysis, HOMER software.
—————————— ——————————
1 INTRODUCTION
oving towards cleaner power is important to support the green technology for sustainable greener environ- ment and contribute to reduce carbon dioxide (CO2 )
emissions. In line with this, efforts have been made on the ex- ploitation of renewable energy (RE) to minimize the usage of fossil fuel as a source of electricity [1, 2].
Among RE sources, wind energy has an extremely large po- tential due to its free, clean, and inexhaustible. In Malaysia, studies have been conducted to promote the use of wind pow- er in replacement of conventional energy supplier [3, 4, 5, 6]. Studies done indicated that only a few places in the East Coast of Peninsular Malaysia have sufficient wind energy for utiliza- tion. According to Malaysian Meteorological Department, Ma- laysia faces fourseasons monsoon, namely the southwest mon- soon, northeast monsoon and two shorter periods of inter- monsoon seasons with generally light wind speed. However, the wind flow patterns still have homogenous periodic chang- es. Usually the southwest monsoon started to establish in the middle of May or early June until in the end of September with the speed less than 15 knots [7]. Although, the average of wind speed is lower, but one of the place known as Pengkalan Nyireh in Kuala Besut, Terengganu has a potential to generate electricity using wind turbine with grid connected. As shown in Fig. 1, this location is directly facing the South China Sea and affected by northeast monsoon wind. The latitude and longitude of Pengkalan Nyireh, Kuala Besut are 5o48’N
102o34’E [8].
This study identifies the potential of grid connected wind
turbine (GCWT) system for domestic use in Kuala Besut, Pen- insular Malaysia. The system was designed based on the pur- pose to implement the wind turbine connected to grid in order to meet the user load. This is done through analyzing using
HOMER software which can perform analysis for both grid- connected and off-grid power system for remote, stand-alone and distributed generation applications [9]. The optimization and sensitivity analysis performs by HOMER simulation soft- ware helps to evaluate the system for GCWT. The domestic
operations load data and wind speed are required before start the designing [7]. Therefore, the fisherman village at Pengka- lan Nyireh in Kuala Besut, which is the gateway to the Perhen- tian Islands, was selected according to the available wind speed.

Fig. 1. The case study location at Pengkalan Nyireh, Kuala Besut, Terengganu, Peninsular Malaysia.
At the end of this study, an assessment of the optimal sys- tem configuration includes grid system and grid connected wind turbine system is ranks according to net present cost (NPC). Simulation is carried out using the HOMER software to determine either it is economical or not to install GCWT in this place. A sensitivity analysis performs multiple optimiza- tions under a range of inputs to account for uncertainty in the system inputs. Finally, the performance and optimum eco- nomic cost is compared to shows the effectiveness of the sys- tem designed.
IJSER © 2015 http://www.ijser.org
International Journal of Scientific & Engineering Research, Volume 6, Issue 2, February-2015 930
ISSN 2229-5518
2 BACKGROUND INFORMATION
2.1 User Load
A fishermen village was selected to test the performance of the GCWT system. It was assumed that this residential area has the total population about 3167 peoples with 14 villages and comprises of 650 households. Each village was estimated to have 46 households. The power consumption that estimated for each house is 135.94kWh per month. Therefore, the total power consumption is assumed 6253.124kWh per month, ap- proximately. It was assumed that the load typically comprises of lighting, air conditioner, washing machine, iron and televi- sion.The daily and montly load profile as shown in Fig. 2(a) and 2(b) describes the load requirement varies throughout the day and different for each month. Fig. 2(a) shows that the peak demand occurs at night where most of the users stay at home during this time. Load requirements for the twelve month as in Fig. 2(b) displays the seasonal load profiles demonstrating the peak loads in November.
Fig. 2(a). Daily load profile in Kuala Besut
Fig. 2(b). Seasonal load profile for selected village in Kuala Besut.
2.2 Wind Speed
The wind speed data was obtained from NASA Atmos- pheric Science Data Centre [10]. The average wind speed ranges from 1.97m/s to 4.33m/s with an annual average of wind speed is about 3.00m/s. Though the wind over the coun- try is generally light and variable, there are some uniform pe- riodic changes in the wind flow patterns. This is illustrated in
Fig. 3. It can be seen that the wind speed is much greater dur- ing November until March because this time is known as northeast monsoon. The southwest monsoon season is usually established in the latter half of May or early June and ends in September. The prevailing wind flow is generally south- westerly and light. With this information, the scale annual average of the wind speed was estimated to 3.174m/s. The Weibull parameter (k) which describes the distribution of wind speeds variation over one period of year is assumed 2 with an autocorrelation factor of 0.85. The diurnal pattern strength is 0.25 whereby a high value of diurnal indicates that there is a relatively strong dependence on the time of day.
Fig. 3. W ind speed data pattern flow.
3 DESIGN SPECIFICATION
In this design, the GCWT system consists of three main components are discussed. The system configures of wind turbine, grid model and primary load. The data selected of GCWT system is listed in Table 1. Fixed speed wind turbine is used to generate the wind speed when it is above cut-in wind speed. Whereas, when wind speed reaches the cut-out wind speed, the wind turbine is shut down due to high mechanical load. A random variability factor was given to HOMER soft- ware as an input. Based on all the assumption made, the an- nual energy demand required is 71.91MWh or 197kWh/day as represented in Fig. 4.
Fig. 4. Design configuration of grid connected wind turbine system.
IJSER © 2015 http://www.ijser.org
International Journal of Scientific & Engineering Research, Volume 6, Issue 2, February-2015 931
ISSN 2229-5518
TABLE 1


DATA FOR SELECTED COMPONENTS Description Data Wind turbines
Size 35 kW
Capital cost $5000/kW Replacement cost $500/kW
3.2 Grid
The grid, which is an auxiliary source, used as back-up to cope with load demand. If possibilities the wind turbine can- not deliver the amount of energy, the grid system will make up the different. For this analysis, the limitation of HOMER is the rates are only applicable if the changes are according to the time of day or the day of the year. Therefore, the system just used one rate that applied the whole month in the year as stat- ed in Table 1.
Operating and maintenance cost
$100/kw/yr
4 RESULT AND DISCUSSIONS
Grid
Load
Lifetime 20 yrs
Rate 1
Price $0.900/kWh Sellback $0.50/kWh Demand $10.0/kWh/mo
The system of grid connected wind turbine and grid only are compared based on a projection period of 20 years and 8% annual real interest rate. The annual average wind speed was estimated about 3.174m/s. The optimization result is shown in Fig 5. It highlighted that zero capital cost involved in grid sys- tem. However, the total NPC is higher compare to GCWT sys- tem with the total NPC approximately $849709 compares to
$697240 as in GCWT system. It concluded that the wind tur- bine grid connected has benefited significantly since it was the cheapest. In addition, the operating cost for GCWT system is lower than the grid system with cost of energy (COE) is
$0.759/kWh. It shows that at lower price, user would save their money for paying electricity.

3.1 Wind Turbine
The basic concept of the wind energy generation is using the wind flows to rotate a turbine generator. The output pow- er of the wind turbine depends on the stochastic nature of the wind speed characteristic. The higher the wind speed, the greater output power is produced. Thus, in this design, low speed wind turbine is used where cut-in wind speed is 2m/s and cut-out wind speed is 15m/s.
To determine the cost related to the wind turbine, econom- ics of wind energy have been studied. According to previous studies, smaller farm or residential scale turbines cost less but they are more expensive when per kilowatt of energy produc- ing capacity is applied on the rates [8].
In this manner wind turbines would cost roughly $3000 to
$5000 per kilowatt of capacity [9].The design of wind turbine
size is rated at 35 kW, 2V nominal voltage with wind penetra-
tion is 95.1%. The load demand is about 22kW peak. For anal-
ysis, it was assumed that wind turbine module would cost
$5000/kW. The replacement cost was assumed as $500/kW. For newer machines, the operating and maintenance cost is estimated in the range around 1.5 to 2 per cent per year of the original turbine investment [9]. Hence, the operating and
maintenance cost was assumed $100/ kW/ year where 2% is chosen.
Fig. 5. Optimization results for different energy system
To determine the feasibility of GCWT system, a sensitivity result is ranked according to Net Present Cost (NPC) for each type of system. The sensitivity result is shown in Fig 6. As highlighted previously, the total NPC of GCWT system is lower compare to grid only system.
Fig. 6. Sensitivity results for GCWT system
The breakdown of NPC is presented in Fig. 7. It can be no-
IJSER © 2015 http://www.ijser.org
International Journal of Scientific & Engineering Research, Volume 6, Issue 2, February-2015 932
ISSN 2229-5518

ticed that the largest portion of NPC came from the grid sys- tem, due to high maintenance is required. The costs for fuel seem zero since wind energy is extremely friendly to the sur- rounding environment where no fuels are burnt to generate electricity.
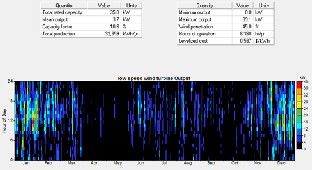
Fig. 8. Monthly average electric production for grid connected wind turbine.
Fig. 7. Total NPC for grid connected wind turbine OF GCWT
system.
The graph of monthly average electric production is shown in Fig 8. The pattern of electricity production along a year most came from the wind turbine in December, January, and February. Wind turbine produces more electricity since the average wind speed is higher in that month as clearly seen in Fig. 2(b). On the other hand, when the wind speed is lower, the average electricity production came from the grid. Thus it could be further noticed that the monthly average electric production match the monthly wind speed profile.
From electrical analysis, it shows that the total electricity generation by GCWT is 77,144 KWh/year. The electricity pro- duced by wind turbine also stated in Fig 8. About 42% electric- ity produced by wind turbine and grid 58%. The wind turbine produces 32,359 KWh/year and the grid gives 44,786
KWh/year. The renewable fraction is 0.419 which means that the wind turbine operates less compared to the grid. It also be noted that the electricity production of wind turbine totally depends on the stochastic nature of the wind speed.
The detail of power production by low speed wind turbine along a day for each month throughout a year is illustrated as in Fig.9. It is indicates by the colours where black refers to the lowest power output while red refers to the highest power output. From this figure, it can be noticed that power output generated is lower in between March and Jun, as well as Sep- tember and November. Penetration of the wind turbine is 45%. The percentages seem lower but it is good enough to supply electricity in order to encourage the usage of alternative ener- gy as a new power generation. By having wind turbine in the system, carbon dioxide emission can be reduced since wind energy is environmental friendly.
Fig. 9. Power output of low speed wind turbine.
The energy purchased, energy sold, net purchased, peak demand, and demand charge for each month is shown in Fig.
10. Annually, the total energy purchased is 44,786kwh mean- while, the excess energy produced by the wind turbine that has been sold to utility company is about 5,239kwh, hence gave the net purchased about 39,546kwh. The total energy charge is $35,592 which indicates the amount of bill should be paid by the users based on the energy used. The total demand charge is about $1,574.
IJSER © 2015 http://www.ijser.org
International Journal of Scientific & Engineering Research, Volume 6, Issue 2, February-2015 933
ISSN 2229-5518
Fig. 10. Detail energy description of GCWT.
4 CONCLUSION
The wind speed in Malaysia is not greater since its annual average only about 3.17m/s. However, the combination of wind turbines and grid would ensure continuous electricity. The potential of wind energy can be further explore in this village as monsoon season were most of the wind flow there. HOMER simulation result shows that although the penetra- tion of wind turbine is 45%, but it is still economical to be in- stalled to minimize the usage of diesel as a source of electrici- ty. The net present cost contribute by the wind turbine is low- er compared to the grid, which is about $697,240. Grid con- nected wind turbine system reduces the electricity bill to
$0.759/KWh instead of $0.924/KWh. From the cash flow summary, wind turbine system shows that about $3,058 save cost compared to system without wind turbine. For more ef- fective, the extraction of energy from the wind can be im- proved by proper design of wind turbine. Low speed wind turbine should be designed as efficient as possible to suit with Malaysia condition. Wind turbines give more advantage on greenhouse effect which provide environmental safe and re- duce emission in future. A further innovation research and development is recommended to transform to more efficient and cost effective technology.
REFERENCES
[1] Z. Darus, N. A. Hashim, S. N. A. Manan, M. A. A. Rahman, K. N. A. Maulud, and O. A. Karim, "The development of hybrid integrated renewable energy system (wind and solar) for sustainable living at Perhentian Island, Malaysia," European Journal of Social Sciences, vol. 9, pp. 557-563, 2009.
[2] K. Sopian, A.M. Razali, M.Y. Othman, “Potensi Tenaga Angin diTerumbu
Layang-Layang” Journal of Industrial Technology, Vol 5, No 1, 1995.
[3] S. K. Najid, A. Zaharim, A. M. Razali, M. S. Zainol, K. Ibrahim, and K. Sopian, "Analyzing the East Coast Malaysia Wind Speed Data," International Journal of Energy and Environment, vol. 3, pp. 53-60, 2009.
[4] S. Mekhilef, and D. Chandrasegaran, “Assessment of Off-shore Wind Farms
in Malaysia,” IEEE Transactions on Industrial Electronics, vol. 58, pp. 1339-
1349, April 2011.
[5] E.P. Chiang., “Wave and Wind Energy. Potential of Renewable Wave and
Offshore Wind Energy Sources in Malaysia”, vol. 4, pp. 22-25, 2007.
[6] A. Haidar, P. N. John, and M. Shawal, "Optimal configuration assessment of renewable energy in Malaysia," Renewable Energy, vol. 36, pp. 881-888, 2011.
[7] Malaysian Metrological Department. Monthly Weather Bulletin. See also, http://www.met.gov.my.
[8] Maps of World. Malaysia Latitude and Longitude. See also, http://www. mapsofworld.com/lat_long/malaysia-lat-long.html.
[9] United States (US) National Renewable Energy Laboratory’s (NREL) HOMER Software. See also, http://homerenergy.com.
[10] NASA. (3 February 2015). Surface meteorology and solar energy. Available:
http://eosweb.larc.nasa.gov/sse.
[11] Leo H. Soderholm, “Interfacing Small Wind Turbine System to Rural Power Distribution System” IEEE Transactions on Industry Application, vol. 1A-20, No2 March/April 1984.

[12] G. J. Dalton, D. A. Lockington, T. E. Baldock, “Case Study Feasibility Analysis of Renewable Energy Supply Options For Small to Medium-Sized Tourist Accommodations”, Elsevier Renewable Energy 34, pp. 1134-1144, 2009.
Zainab Abdullah received the B. Eng (Hons)
in Electrical Engineering and M. Eng in High Voltage Engineering from UTM, Malaysia. Currently, she is a lecturer at Polytechnic Malaysia. Her research interests include power energy system, lightning and electrical insulating materi- als. Ms. Zainab is a Graduate Member of Institution of Engineer Malaysia (IEM).
IJSER © 2015 http://www.ijser.org