International Journal of Scientific & Engineering Research, Volume 6, Issue 5, May-2015 567
ISSN 2229-5518
Modeling the Specific Energy in Turning Operations by Taguchi L32 Orthogonal Array Design
Ithipri, E.; © Ossia, C.V.; Okoli, J.U.
Mechanical Engineering Department, University of Port Harcourt, Nigeria
ABSTRACT: This study considered Cutting Speed V, Feed rate F, Depth of cut D and Cutting Environment E as the input parameters for a Design of Experiment (DOE) based on a mixed-level Taguchi L32 orthogonal array. The test runs were conducted on a conventional lathe with spindle power of 3.75kW using TiN coated cutting tools and AISI 1040 carbon steel as workpiece. Signal-to-Noise (S/N) ratio analysis was applied to determine the optimum level for each parameter while analysis of variance (ANOVA) was employed to analyze the significant contributions of the control factors influencing the outcome - Specific Energy Consumption (SEC). Response surface methodology was used for developing a second order model for SEC as an energy efficiency indicator in Turning operations. Genetic Algorithm Solver was also used as optimization tool for the model. Results showed that for minimizing SEC, F was the most significant factor with a percentage
contribution of 84.35% followed by V, E and D. The SEC model proved to be highly significant with p-value < 0.05 and was
well fitted with the experimental value showing a high coefficient of determination (R2= 91.78%) value.
Keywords: Specific Energy Consumption, Taguchi Design of Experiments, Optimization.
—————————— ——————————
Nomenclature
Adj MS - Adjusted Mean Squares
%C - Percentage Contribution
E - Cutting Environment
D - Cutting Depth
DF - Degree of freedom
F - Feed Rate
GA - Genetic Algorithm
HB - Higher-the-Better i - Integer
j - Integer
MRR - Material Removal rate
LB - Lower-the-Better
n - Number of observations
NB - Nominal-the-Best
PC - Cutting Power
————————————————
© Ossia C.V. is currently on secondment at the Offshore Technology
Institute (OTI), Graduate School of Engineering & Technology,
University of Port Harcourt, Nigeria. Email: ossiacv@otiuniport.org
p-value - Probability statistics
SEC - Specific Energy Consumption Seq SS - Sequential Sum of Squares S/N - Signal-to-Noise ratio
V - Cutting Speed
y - Observed Response
𝜷o - Regression constant term
𝜷i - Main Effects Coefficient
𝜷ij - Interaction Effects Coefficient
𝜷ii - Quadratic Effects Coefficient
𝜖 - Error
1. Introduction
Energy efficiency of production systems, especially of machining operations is becoming increasingly relevant and is a key focus of most developing nations [1]. The growing demands and continued rise in the value of energy serve to emphasize the importance of enhancing the energy and material-related efficiency of all manufacturing processes. Efficient energy
IJSER © 2015 http://www.ijser.org
International Journal of Scientific & Engineering Research, Volume 6, Issue 5, May-2015 568
ISSN 2229-5518
management is therefore not only fundamental to, but
an integral part towards sustainable production systems
[2].
The energy required in machining process is drawn from the electrical grid and can be generated from different power sources such as thermal, nuclear, wind, ocean wave and tides, solar, biomass, rivers, geothermal, etc. Balogun and Mativenga [3] reported that the use of carbon rich electricity generation sources is of global concern, because these processes produce CO2 emissions. Therefore, the higher the consumption of electricity in the manufacturing industries, the higher the carbon footprints related to the manufactured products. The industrial sector currently accounts for about half of the world’s total energy consumption, and this sectoral consumption has almost doubled over the last 60 years [4]. Besides, global energy demand is expected to grow by 53% between 2008 and 2035 [5]. Also industrial energy consumption is projected to grow at 2.4-3.2% per year through 2030 in developing countries and 1.2% in developed countries [6].
Mativenga and Rajemi [7] reported that optimizing
energy demand in manufacturing is important for reducing the energy intensity of products and their vulnerability to escalating energy prices in the future. Pusavec et al [8] reported that an estimated two- thirds of the electrical energy used by machining industry is meant for running motors and drives for cutting tools. The cost of energy used over a ten-year period is about
100 times higher than the initial purchase cost of the
machine tools used to manufacture products [9]. Therefore, prior to machining of a part or component the optimum energy consumption per unit volume of the machined product should be determined in order to improve profitability, reduce operating cost and
minimize environment impact generated from energy
production of manufacturing firms. Specific energy in
this study is considered as an energy efficiency indicator to minimize the energy intensity of a given machined product.
One of the processes widely used in manufacturing is Turning. Over the years, optimization of Turning processes with respect to machining performance based on machining cost, quality and productivity has received enormous attention unlike optimization based on Specific Energy consumption, despite recent emphasis on energy savings and conservation.
2 Materials and Methods
2.1 Experimental Setup and Procedure
Cutting performance tests were carried out on a lathe machine (Master 2500, Colchester, UK) with a
3.75kW spindle power and a maximum spindle speed of
2500 rpm. A cylindrical AISI 1040 carbon steel rod of diameter 35mm and overhang length 120mm was used as the workpiece per experimental run. The cutting tool used for the turning operation was Widia tool holder (ANSI No. PCLNR2525M16, Widia, UK) and diamond shaped Carbide inserts with TiN coating (ISO CNMG120408). KOOLCUT-40 soluble oil was used to perform the experiment under wet cutting environment.
IJSER © 2015 http://www.ijser.org
International Journal of Scientific & Engineering Research, Volume 6, Issue 5, May-2015 569
ISSN 2229-5518
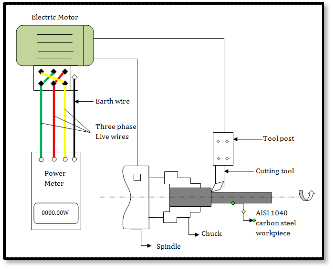
Figure 1, Experimental Setup for the Turning Operation
2.2 Experimental Design
Experimental design is an efficient procedure of planning experiments so that the data obtained can be analyzed to yield valid and objective conclusions [10].
In this study, the electrical Power was measured by
a 3-phase digital power meter (MS2203, MASTECH, China) which was connected to the lathe machine motor in a delta-mode as in Figure 1. Cutting Power PC in each run was recorded and converted to SEC using Equation
1.
The Taguchi experimental design technique was
adopted to study the entire parameter space with only a minimum number of experiments. The advantages of
𝑆𝐸𝐶 =

𝑃𝐶 =
𝑀𝑅𝑅

𝑃𝐶
𝑉𝐹𝐷∗103
- (1)
Taguchi’s method are the saving of effort in conducting experiments, saving experimental time, reducing the cost, and discovering significant factors quickly. The main thrust of the Taguchi’s experimental design is to determine the parameter settings which produce the best level of performance characteristics with minimum variation [10]. The process parameters selected as the control factors include: Cutting Environment (E), Cutting Speed (V), Feed rate (F) and Depth of cut (D). The tests were carried out following Taguchi-L32 mixed level design of experiments (DOE) where factor E was varied at two levels (E 1 - wet and E2 - dry), while input factors V, F, and D were varied at four levels as: (V1 , V2 , V3 , V4 = 50, 75, 100, 125m/min), (F1 , F2 , F3 , F4 = 0.2, 0.3,
0.4, 0.5mm/rev), and (D 1 , D2 , D3 , D4 = 0.25, 0.50, 0.75,
1.00mm). The mixed-level Taguchi-L32 design was
2.4 Response Surface Methodology
The relationship between the process parameters and output response was determined using multiple regression analysis of the data obtained from the DOE to develop a second order polynomial model. Similar functional relationship between the desired response and the process parameters had been expressed by Palanikumar [11] and Raj [12] as:
𝑆𝐸𝐶 = 𝑓( 𝑉, 𝐹, 𝐷) + 𝜖 - (2)
For better correlation and approximation of the
response surface, the study utilized the second order response surface model which involves linear terms, two-way interactions terms and quadratic terms. Therefore, the specified model for the study showing the relationship between response, SEC and the turning
parameters X i,j was estimated using Equations 3 and 4.
adopted because it is the best available design suitable 𝑛 𝑛
2
𝑦 = 𝛽𝑜 + � 𝛽𝑖 𝑋𝑖 + � � 𝛽𝑖𝑗 𝑋𝑖 𝑋𝑗 + � 𝛽𝑖𝑖 𝑋𝑖
(3)
to accommodate factors with varying levels having a
one 2-level parameter and three 4-level parameters.
𝑖 =1
𝑖 𝑗
𝑖 =1
The DOE matrix consisting of 32 experimental runs was generated using MINITAB 16 software. The matrix was used for obtaining Cutting Power PC [W], material removal rate (MRR) [mm3/s] and specific energy SEC consumption data for every experimental run.
2.3 Experimental Determination of Specific
Energy Consumption SEC
𝑆𝐸𝐶 = 𝛽𝑜 + 𝛽1 𝑉 + 𝛽2 𝐹 + 𝛽3 𝐷 + 𝛽12 𝑉𝐹 + 𝛽23 𝐹𝐷 + 𝛽31 𝐷𝑉
+ 𝛽11 𝑉2 + 𝛽22 𝐹2 + 𝛽33 𝐷2 (4)
MINITAB-16 software was used to determine the
regression coefficients of the model based on the response, specific energy consumption.
2.5 OPTIMIZATION METHODS
2.5.1 Taguchi S/N Ratios
IJSER © 2015 http://www.ijser.org
International Journal of Scientific & Engineering Research, Volume 6, Issue 5, May-2015 570
ISSN 2229-5518
Taguchi S/N ratio is a statistical measure of
performance or quality for data analysis and prediction of optimal parameter setting [13]. The S/N ratio is the ratio of the mean (Signal) to the standard deviation (Noise). It depends on the quality characteristics of the process to be optimized. The standard S/N ratios generally used include: Nominal-is-Best (NB), “lower- the-better” (LB) and Higher-the-Better (HB).
In this study, MINITAB 16 was used to solve the
optimization problem. Specific energy consumption was taken as LB characteristics, aimed at minimizing the response, with an ideal target being zero. This LB - S/N ratio was computed as equation (5) following Ross [13].
𝑛
The following options were selected in the GA
Solver Toolbox for formulating the optimization problem: Number of Variables = 3; Lower bound [50
0.20 0.25]; Upper bound [125 0.50 1.00]; Population type
= Double vector; Population = 100; Crossover Fraction:
0.80; Mutation rate: 0.20; Number of generations = 100. The algorithm stops when the value of the fitness function for the best point in the current population is less than or equal to the fitness limit.
3. RESULTS AND DISCUSSION
3.1 Data Presentation
The results obtained from the experimental runs
1
𝑆⁄𝑁 = −10𝑙𝑜𝑔
𝑛
� 𝑦2
𝑖=1
− (5)
following the DOE are shown in Table 1.
Table 1 Experimental results for SEC and S/N ratios.
2.5.2 Genetic Algorithm (GA)
Genetic algorithms (GA) are computational models inspired based on Darwin’s survival of the fittest principle of evolution, natural selection and genetics using a search procedure to find the best and fittest design solutions [14]. These algorithms encode a potential solution to a specific problem on a simple chromosome–like data structure. The objective of the GA optimization approach is to achieve minimum S EC by adjusting the cutting conditions by numerical optimization using the GA Toolbox in MATLAB (R2007b). The optimization problem was solved by coupling the SEC model from response surface methodology with the GA. The optimization was formulated in the standard mathematical format as:
Find: V (Cutting speed, m/min), F (Feed rate,
mm/rev), and D (Depth of cut)
Minimize: SEC (V, F, D)

3.2 Data Analysis and Discussions
3.2.1 Regression Analysis
The Minitab software utilized the specified data to
𝑉𝑚𝑖𝑛 ≤ 𝑉 ≤ 𝑉𝑚𝑎𝑥
develop the SEC
model under wet and dry cutting
Subject to constraints: � 𝐹𝑚𝑖𝑛 ≤ 𝐹 ≤ 𝐹𝑚𝑎𝑥
𝐷𝑚𝑖𝑛 ≤ 𝐷 ≤ 𝐷𝑚𝑎𝑥
environment. Equation 6 represents the specific energy
consumption (SEC ) model in terms of the machining
IJSER © 2015 http://www.ijser.org
International Journal of Scientific & Engineering Research, Volume 6, Issue 5, May-2015 571
ISSN 2229-5518
parameters such as cutting speed, feed rate and depth of
cut under the influence of two cutting environment.
𝑆EC = 5.27391 − 0.01254V − 5.44568F + 0.32166D
+ 0.00005 V2 + 0.00025VF + 0.002VD
+ 5.76968F2 − 2.45548FD + 0.21263D2
- (6)
3.2.2 Analysis of Variance (ANOVA) for the SEC
Model
The experimental results were analyzed with ANOVA to identify the factors that significantly affect the performance measures on the total variance of the results. The ANOVA, carried out at α = 0.05 significance level (95% confidence level) gave results for SEC shown in Table 2. The sources with P-value < 0.05 are considered as high statistically significant.
Table 2 Analysis of variance (ANOVA) for SEC Model
Coefficient of determination (R-Sq) = 96.27%, Adjusted
coefficient of determination (R-Sq, adj) = 94.74%, Predicted residual sum of squares (PRESS) = 0.332412; Predicted Coefficient of determination (R-Sq, pred) =
91.78%.
From Table 2, the p-value < 0.05 for the model implying that this model is highly statistically significant. It was observed that among the main (linear) factors, the feed rate was the most predominant with a percentage contribution to SEC of %C = 84.38%, followed by cutting speed (%C = 2.85) and depth of cut (%C =
0.58). The depth of cut is rather insignificant due to its p-value > 0.05. The quadratic terms V2 and F2 are significant except for D2. The interaction between feed rate and depth of cut (FD) was found to be the only significant interaction term in the model because its p- value < 0.05. Finally, the output coefficient of determination, R-squared value of 96.27% indicates the accuracy of the model and the predicted R-squared for the model is equal to 91.78% which indicates a good correlation with experimental data.
3.2.4 Adequacy Tests
Residual plots for response parameter SEC in Figure
2 were utilized to check any model inadequacy or unusual problem with normality assumptions. Inspection of some diagnostic plots of the model was
done to test the statistical validity of the model.
3.2.3 Summary of the Model
The statistical properties obtained for the model include: Sample Standard Deviation S = 0.0827784,
IJSER © 2015 http://www.ijser.org
International Journal of Scientific & Engineering Research, Volume 6, Issue 5, May-2015 572
ISSN 2229-5518
Residual Plots for SEC
Normal Probabilit y Plot Versus Fit s
99 0.2
90 0.1
50 0.0
10 -0.1
1 -0.2
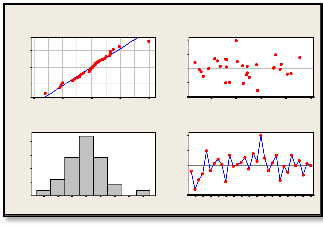
Figure 3b shows the influence of cutting speed and
depth of cut on SEC . The increase in depth of cut and cutting speed decreases the SEC in the turning operations. Therefore, it can be deduced from Figures 3a
-0.2
-0.1
0.0
0.1
0.2
3.0
3.3
3.6
3.9
4.2
Residual
Fitted Value
and 3b that the minimum SEC can be achieved by
10.0
Hist ogram Versus Order
0.2
increasing the feed rate, cutting speed and depth of cut.
7.5
5.0
2.5
0.0
-0.15 -0.10 -0.05 0.00 0.05 0.10 0.15 0.20
Residual
0.1
0.0
-0.1
-0.2
2 4 6 8 10 12 14 16 18 20 22 24 26 28 30 32
Observation Order
This is due to the fact that when feed rate, cutting speed and depth of cut are increased, MRR increases thereby reducing SEC .
Figure 2, Residual Plots of SEC
From Figure 2a, nearly all the points on the normal probability plot are said to spread approximately in a straight line implying that the errors were distributed normally and a little deviation from normality was observed. This shows the effectiveness of the model. From Figure 2c, the histogram showed an approximate symmetric nature indicating that the residuals are normally distributed. Figures 2b showed that the residuals were randomly scattered within constant variance across the residuals versus the predicted plot as they are scattered randomly around zero in residuals versus the fitted values. The residuals observed were from -0.20 to 0.20, which corroborates the earlier observation of high correlation between the model and experimental values. Figure 2d shows that there is no obvious pattern and unusual structure present in the data which implies that the residual structure analysis does not indicate any model inadequacy or no error due to time or data collection order.
3.2.5 Trend Analysis of Process Parameters on SEC
using Surface Plot
Figures 3a and 3b show the response surface plots of SEC based on the DOE parameters. Figure 3a shows SEC variation with respect to cutting speed and feed rate indicating that SEC decreases with increase in feed rate.
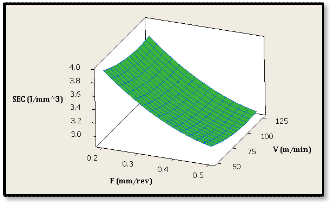
Figure 3a, Response surface of SEC versus Cutting Speed
V and Feed Rate F
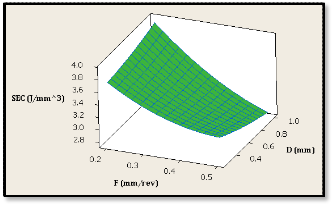
Figure 3b, Response surface of SEC versus Feed Rate F
and Depth of cut D
3.2.6 S/N Ratios Analysis for Optimum Settings

The MINITAB16 software was used to analyze the main effect of S/N ratio on the optimization analysis for SEC . Figure 4 shows the main effect plots and the corresponding S/N response for SEC . The overall mean
IJSER © 2015 http://www.ijser.org
International Journal of Scientific & Engineering Research, Volume 6, Issue 5, May-2015 573
ISSN 2229-5518
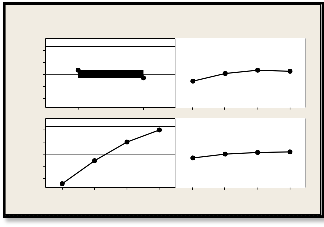
response is represented by the horizontal line at the centre of the curves.
Main Effects Plot for SN ratios
Data Means
CE V
-9.5
-10.0
-10.5
-11.0
-11.5
WET
DRY
50 75
100
125
F D
-9.5
-10.0
-10.5
-11.0
-11.5
0.2
0.3
0.4
0.5
0.25
0.50
0.75
1.00
Signal-to-noise: Smaller is better
Figure 4, Main effect plot (SEC) for S/N ratios
a) Optimum settings
From the S/N ratio analysis in Figure 4, the level of the factors with the highest S/N ratio was taken as the optimum level for the response, therefore the optimal machining conditions are Wet Cutting Environment (E1), 100 m/min cutting speed (V3), 0.50 mm/rev feed rate (F4) and 1 mm depth of cut (D4) to minimize SEC , that is, an optimal settings coded E1V3F4D4.
b) Ranking Effect of parameters
The ranks and delta-values also indicate the relative importance of each factor to the response. The values obtained for the various factors show that feed rate had the greatest effect on SEC with rank and delta values of 1 and 2.243 respectively, followed by cutting speed with 2 and 0.440, cutting environment with 3 and 0.328, and depth of cut with 4 and 0.235 rank and delta values, respectively.
3.2.7 Optimization Results for Genetic Algorithm
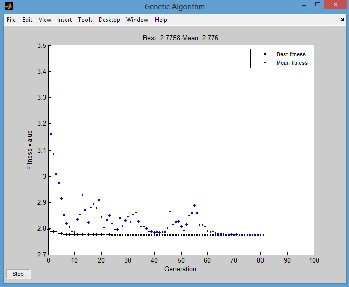
GA optimization was based on the fitness function for specific energy SEC equation (6) above.
Figure 5, Performance of fitness value with generation. Figure 5 showed that the optimal SEC value =
2.7758J/mm3 and accompanying optimal control factors of cutting speed V = 100.645 m/min, feed rate F =
0.5mm/rev and Depth of cut D = 1mm. Optimal solution was obtained at 81st generation (iteration) of the Genetic Algorithm.
4. CONCLUSION
Taguchi DOE, Genetic Algorithm and Desirability function analyses are effective means of determining the optimal specific energy consumption SEC in machining (Turning) operations.
ANOVA for the SEC - model revealed that feed rate F is the most significant factor with a percentage contribution (%C) of 84.38% on SEC, followed by cutting speed V with %C = 2.85%. Depth of cut D had the least influence on SEC with a %C = 0.58%.
The main effect plots of S/N ratio and response indicates that F is the most dominant or ranked parameter on SEC followed by V, E and depth of cut
D, in that order.
IJSER © 2015 http://www.ijser.org
International Journal of Scientific & Engineering Research, Volume 6, Issue 5, May-2015 574
ISSN 2229-5518
The factors interactions plots for SEC indicated strong interactions between feed rate F and depth of cut D on SEC .
The residual plots for SEC model were generated and showed that SEC -model was well fitted with the experimental-values giving a high correlation between the fitted values and observed values (R2=
91.78%).
The 3D response surface plots of SEC decreased with increasing cutting speed V, feed rate F and depth of cut D. The optimal parameter settings to minimize SEC and reduce the deviation from target are: Wet cutting environment (Level 1), 100m/min cutting speed (Level 3), 0.5mm/rev feed rate (Level 4) and
1mm depth of cut (Level 4).
References
[1] L. Kroll, L. Blau, P.M. Wabner, U. Frieb, J. Eulitz, and M. Klarner (2011), “Lightweight components for energy”, CIRP Journal of Manufacturing Science and Technology, 4, 148–160
[2] R. Neugebauer, A. Schubert, B. Reichmann and M.
Dix (2011) “Influence Exerted by Tool Properties on the Energy Efficiency during Drilling and Turning Operations,” CIRP Journal of Manufacturing Science Technology, 4, 161-169.
[3] V.A. Balogun and P.T. Mativenga (2013), “Modelling of direct energy requirements in mechanical machining processes”. Journal of Cleaner Production, 41, 179-186.
[4] K.. Fang, N. Uhan, F. Zhao and J.W. Sutherland (2011). “A new approach to scheduling in manufacturing for power consumption and carbon footprint reduction”. Journal of Manufacturing Systems, 30, 234-240.
[5] N. Diaz, K. Ninomiya, J. Noble and D. Dornfeld (2012). “Environmental impact characterization of milling and implications for potential energy savings in industry.” Proceedings of the 5th CIRP Conference on High Performance Cutting, 518-523.
[6] United Nations Environment Programme (UNEP) (2007); “Key Issues of Sustainable Consumption and Production.” 3rd International Expert Meeting on
10 Year Framework of Programmes on SCP (Marrakech Process). Retrieved on January 30, 2014 from http://esa.un.org/marrakechprocess/pdf/gpape r2.pdf
[7] P.T. Mativenga, and M.F. Rajemi (2011),
”Calculation of optimum cutting parameters based on minimum energy footprint.”, CIRP Annals - Manufacturing Technology, 60 (1), 149-152.
[8] F. Pusavec, P. Krajnik and J. Kopac (2010a). “Transitioning to sustainable production - Part I: Application on machining technologies”. Journal of Cleaner Production, 18, 174-184.
[9] F. Pusavec, D. Kramar, P. Krajnik and J. Kopac (2010b). “Transitioning to sustainable production - Part II: evaluation of sustainable machining technologies”. Journal of Cleaner Production, 18, 1211-
1221.
[10] D. C. Montgomery (2005).” Design and Analysis of Experiments”. 6th edition. John Wiley and Sons, Inc.; New York, USA.
[11] K. Palanikumar (2007). “Modeling and analysis for surface roughness in machining glass fibre reinforced plastics using response surface methodology”, Materials and Design, 28, 2611–2618.
IJSER © 2015 http://www.ijser.org
International Journal of Scientific & Engineering Research, Volume 6, Issue 5, May-2015 575
ISSN 2229-5518
[12] T. G. A. Raj (2011). “Analysis And Optimization of
Machining Process Using Evolutionary Algorithms”, PhD Thesis, Cochin University Of Science And Technology, Kochi, India.
[13] P.J. Ross, (2005). “Taguchi Techniques for Quality
Engineering”, Tata McGraw Hill, Second Edition.
[14] A.U. Patwari, A.K.M.N. Amin and M. D. Arif (2011). “Optimization of Surface Roughness in End Milling of Medium Carbon Steel by Coupled Statistical Approach with Genetic Algorithm”. The First International Conference on Interdisciplinary Research and Development -Special Issue of the International Journal of the Computer, the Internet and Management, 19 No. SP1.
IJSER © 2015 http://www.ijser.org


