International Journal of Scientific & Engineering Research, Volume 4, Issue 8, August-2013 1394
ISSN 2229-5518
Modeling and Control of a Wind/PV Hybrid
System Grid-connected
Boucetta. Abdallah, Labed. Djamel
Abstract— ALTHOUGH an effective use of renewable energy attracts a great deal of attention globally to cope with the environmental and resource problems, especially, to reduce CO2 emission, an inappropriate application of distributed generators can be a cause of insecure power supply for example.
However, these renewable energy sources suffer from some deficiencies when used as standalone energy sources. The power generated by WT and PV systems is highly dependent on weather conditions. Natural variations in wind speed and sunlight causes power fluctuations in W T and PV systems, respectively. In addition, it is difficult to store the power generated by a PV or WT system for future use.
In This paper deals with power control of a wind and solar hybrid generation system for interconnection operation with electric distribution sys- tem .
Index Terms—Renewable Energy, W T, PV, Sunlight, electric distribution, wind speed
— — — — — — — — — — — — — — — — — — — —

enewable energy resources, called sustainable or alterna- tive energy, are energies generated from natural resources
such as wind, sunlight, tide, hydro, biomass and geo- thermal which are naturally replenished. Energy crisis, climate changes such as atmosphere temperature rise due to the in- crease of greenhouse gases emission and the Kyoto Protocol restrictions in generation of these gases, coupled with high oil prices, limitation and depletion of fossil fuels reserves make renewable energies more noticeable. Moreover, since many remote rural areas in all over the world are not electrified, one of the interesting utilization of the renewable energies is to electrify many remote villages and rural areas or rugged ter- rain located so far from power stations and distribution net- works.
Vulnerability to unpredictable climatic changes and h of re3- newable energy systems on weather conditions remain among
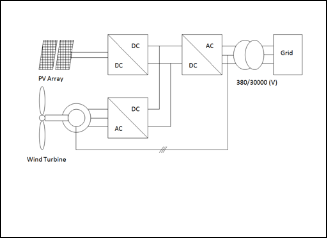
Fig. 1. Grid-connected hybrid system.
their drawbacks
The general block diagram of the proposed hybrid system is shown in Fig. 1. The system consists of wind turbine genera- tors, system photovoltaic. The power supplied to the load is
𝑃𝑤𝑡𝑝 =![]()
𝜌.𝐶𝑝 .𝑆.𝑉𝑤3 (1)
2
the sum of output powers from wind turbine generators and PV system. The mathematical models with first order transfer functions for wind turbine, PV system, shown in this section.
————————————————
• Abd allah. Boucetta is associate Ph.D. degree in Electrical Engi- neering from the University of mentouri, constantine, Algeria, PH-
+213560358501. E-mail: boucetta_abdallah@yahoo.com
• Djamel Labed Doctorat in Electrical Engineering, at University
Mentouri of Constantine,Algeria, PH-+213773312865. E-mail: dja-
mel_labed@yahoo.fr
Where Pwtp is the wind turbine output [W] is, ρ is the air densi- ty [kg/m3], Vw is the wind speed [m/s], and Cpis the power
coefficient.
Now, the performance coefficient CP that is a function of the
tip speed ratio A and the pitch angle θ will be investigated
further.
The calculation of the performance coefficient requires the use
of blade element theory. As this requires knowledge of aero-
dynamics and the computations are rather complicated, nu-
merical approximations have been developed [10]. Here the
following function will be used![]()
−12.5
116
![]()
𝐶𝑝 (𝜆, 𝜃) = 0.22 �
With :
𝜆𝑖
− 0.4𝜃 − 5� 𝑒
𝜆𝑖 (2)
1 = 1
− 0.035![]()
![]()
𝜆𝑖
𝜆+0.08𝜃
![]()
𝜃3 +1 (3)
IJSER © 2013 http://www.ijser.org
International Journal of Scientific & Engineering Research, Volume 4, Issue 8, August-2013 1395
ISSN 2229-5518
The equations describing a doubly fed induction machine can be found in literature [11]. When modeling the DFIG, the gen- erator convention will be used, which means that the currents are outputs instead of inputs and real power and reactive power have a positive sign when they are fed into the grid. Using the generator convention, the following set of equations results,
dφsx
power for a given set of reference condition. The reference solar irradiation and temperature is GT,ref=1000 W/m2 and Tref= 25oC , respectively.
In short circuit condition, the diode current is very small and the light current is equal to the short circuit current.
𝐼𝐿 = 𝐼𝑆𝐶 (11)
In open circuit condition, the current is zero and the ‘10’ in Eq.
(11) is small as compared to the exponential term. Because of
this, the diode current is given by:![]()
−VOC.ref
aref
⎧ Usx = −Rs Isx +![]()
− wos φsy
I0.ref = IL.refe
(12)
⎪ Usy = −Rs Isy +
dφrx
![]()
dφsy
dt
− wos φsx
(4)
The measured values for I and V at the maximum power point
given by the manufacturer can be substituted into Eq.13 along
⎨Urx = Rr Irx +
⎪
dt
![]()
dφry
− (wos −wr)φry
with the diode and light current to find the series resistance,
RS![]()
![]()
Imp
![]()
⎩Ury = Rr Iry +
+ (wos −wr )φrx
a ln�1− IL
�−Vmp +VOC
With v the voltage [U], R the resistance [Ω], i the current [A],
wos , the stator electrical frequency [rad/s], φ the flux linkage
RS =
(13)
Imp
[Us] and s the rotor slip.
The flux linkages in (4) can be calculated using the following
The following equations are good approximations for the temperature effect on many PV modules.
set of equations in per unit [11]
φsx = −Ls Isx + Msr Irx
⎧φsy = −Ls Isy + Msr Iry
IL = T �I
GT.ref
![]()
a = aref
L.ref
+ µIsc
(TC
− TC.ref
)� (14)
(15)
⎨ φrx = Lr Irx − Msr Isx
⎩ φry = Lr Iry − Msr Isy
(5)
TC.ref
TC
TC
![]()
2 � εNs
![]()
�1 TC.ref��
With M the mutual inductance and Ls , and Lr , the stator and
rotor leakage inductance respectively.
I0 = I0.ref �
�![]()
C.ref
e aref TC
(16)
A more complex model of the system studied, taking into a
dφ
VOC = VOC.ref + µVOC (TC − TC.ref) (17)![]()
count the
dt
terms of (4), can be found in [11].
µVOC .TC.ref−VOC.ref+εNS
Keeping the above in mind, the following voltage current
relationship of the DFIG can be derived from (4) and (5)
aref =![]()
![]()
µISC .TC.ref−3
IL.ref
(18)
⎧ Usx = −RsIsx − Ls dt + M dt + wosLs Isy − wosMIry
![]()
![]()
dIsx
dIrx
⎪ U = −R I
![]()
![]()
dIsy dIry
![]()
− L − M − w L I
+ w MI
![]()
sy s sy
s dt
dt os s sx
os rx
( 6)
The main input parameters for the solver are solar radiation
⎨Urx = RrIrx + Lr
⎪
dIrx
dt
![]()
![]()
dIry
− M dIsx
dt
dIsy
− (wos − wr)LrIry + (wos − wr)MIsy
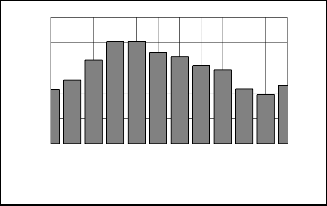
and wind speed. The daily average solar radiation and wind
speed data for the region of Batna in Algeria were collected
⎩Ury = RrIry + Lr dt − M dt + (wos − wr)LrIrx − (wos − wr)MIsx
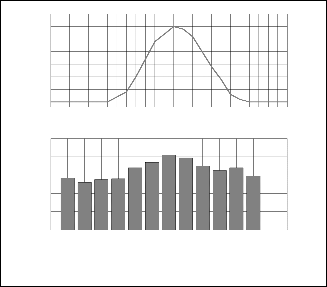
from l’Atlas Solar from Algeria
The active power P and reactive power Q generated by the
DFIG[11]
𝑃 = 𝑉𝑑𝑠 . 𝐼𝑑𝑠 + 𝑉𝑞𝑠 . 𝐼𝑞𝑠 + 𝑉𝑑𝑟 . 𝐼𝑑𝑟 + 𝑉𝑞𝑟 . 𝐼𝑞𝑟 (7)
𝑄 = 𝑉𝑞𝑠 . 𝐼𝑑𝑠 − 𝑉𝑑𝑠 . 𝐼𝑞𝑠 + 𝑉𝑞𝑟 . 𝐼𝑑𝑟 − 𝑉𝑑𝑟 . 𝐼𝑞𝑟 (8)
The PV cell can directly convert the sunlight to DC power through the photoelectric phenomena. The power output of a single diode solar cell is given by[12]
𝑃 = 𝐼𝑉 (9)
The general formula for monocrystalline solar cell current is the
current–voltage relationship for a single diode solar cell of an
array is given as follow:
V+IRs
3.5
3
2.5
2
1.5
1
0.5
0
0 1 2 3 4 5 6 7 8 9 10 11 12 13 14 15 16 17 18 19 20 21 22 23 24 25
heur ( time of day)
1000
800
600
400
200
0
![]()
I = IL − ID = IL − I0 �e
a − 1� (10)
1 2 3 4 5 6 7 8 9 10 11 12
month
Usually the PV manufacturer supply their products with a data sheet that contains values of V and I for three conditions namely, the short circuit, the open circuit and the maximum
Fig. 2. Solar irradiation distributions during the year and day for
Batna.
IJSER © 2013 http://www.ijser.org
International Journal of Scientific & Engineering Research, Volume 4, Issue 8, August-2013 1396
ISSN 2229-5518
5
4
3
2
1
0
1 2 3 4 5 6 7 8 9 10 11 12
month
Fig. 3. wind speed distribution during the year for Batna .
Fig. 5 presents the current control scheme of the grid inverter. The control strategy of the grid interface inverter is as follows.
• The common dc voltage Vdc is maintained constant so that real power from the wind and PV system can pass through into the grid.
• Various control modes including power factor, kVar, current and voltage can be used for determining the amount of necessary reactive power generation. In the study, constant power factor control has been imple- mented.
The PV array must operate electrically at a certain voltage which corresponds to the maximum power point under the given operating conditions, i.e. temperature and irradiance. To do this, a maximum power point tracking (MPPT) technique should be applied. Various MPPT techniques have been pro- posed and implemented, e.g. look-up table methods, perturba- tion and observation (P & O) methods and computational methods [12]. Incremental conductance method has been im- plemented in this study. If the array is operating at voltage V and current I, the power generation is P=VI. At the maximum power point, dP/dV should be zero and the sign of dP/dV may be identified by equation (8). Increase or decrease in the PV array voltage is determined by judging the sign of equa- tion (19). Fig. (4) presents the flow of the incremental conduct- ance technique implemented
Fig. 5. Current control of grid interface inverter.
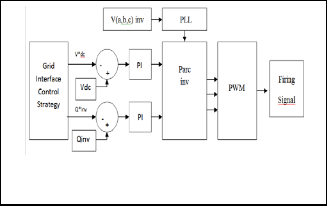
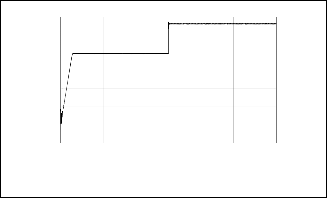
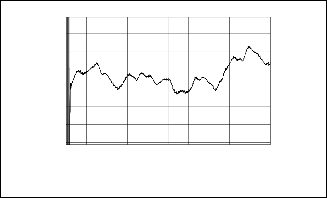
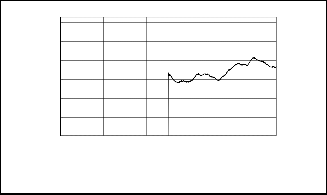
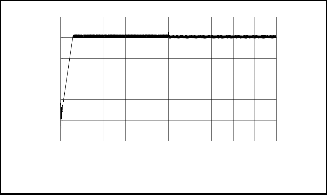
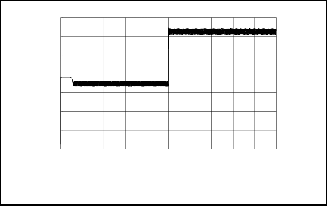
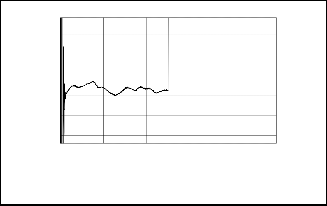
Fig. 6 shows the simulation results. The hybrid system is in unity power factor operation under the wind speed and solar radiation condition shown in Fig. 6(1) and 6(3), respectively. Temperature is assumed to be 25o
Fig. 6(2) shows the real power extracted at unity power factor![]()
![]()
![]()
![]()
1 𝑑𝑃 = 𝑑(𝑉𝐼) = 1 + 𝑑𝐼
(19)
from the wind generator by the wind-side converter. The real
𝑉 𝑑𝑉
𝑉(𝑑𝑉)
𝑉 𝑑𝑉
power has varied smoothly compared to wind speed change.
PV array current traces the desired level well response to
solar radiation changes as shown in Fig. 6(5) but the PV array voltage does not change with solar radiation changes as shown in Fig. 6(4) . The PV array power is shown in Fig. 6(6). Real pwer generation of the grid inverter is shown in Fig. 6(7)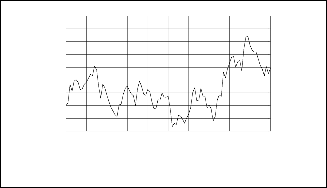
6(8)a,b. The voltage waveforms at grid inverter terminal shown in Fig. 6(9).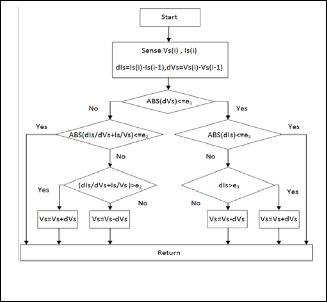
3.7
3.6
3.5
3.4
3.3
3.2
3.1
3
2.9
2.8
0 1 2 3 4 5 6 7 8 9 10
Sec
Fig. 4. Flow chart of the MPPT technique implemented
(1)W ind speed
IJSER © 2013 http://www.ijser.org
International Journal of Scientific & Engineering Research, Volume 4, Issue 8, August-2013 1397
ISSN 2229-5518
.
600
443.5
500
443
400
442.5
300
442
200
441.5
100
441 0
440.5
0 1 2 3 4 5 6 7 8 9 10
Sec
-100
0 2 4 6 8 10
Sec


(2)Real power generation from wind generator
(6) PV array power
1100
1200
1000
900
800
700
600
500
400
300
200
100
0
0 1 2 3 4 5 6 7 8 9 10
Sec
1100
1000
900
800
700
600
500
400
0 2 4 6 8 10
Sec
(3)Solar radiation
(7) Real power of grid inverter
25
1000
20
500
15 1000
10 500
5 1000
0 500
-5
0 1 2 3 4 5 6 7 8 9 10
Sec
0 2 4 6 8 10
Sec
(4)Solar radiation
(8).a.Real power (Zoom)
10
9 1000
8 500
7 1000
6 500
5 1000
4
3
0 1 2 3 4 5 6 7 8 9 10
Sec
500
0 2 4 6 8 10
Sec
(5) Desired and actual current of PV array
(8).b.Real power (Zoom)
IJSER © 2013 http://www.ijser.org
International Journal of Scientific & Engineering Research, Volume 4, Issue 8, August-2013 1398

ISSN 2229-5518
600
400
200
0
-200
-400
-600
0.8 0.82 0.84 0.86 0.88 0.9 0.92 0.94 0.96 0.98 1
Sec
(9)Voltage waveforms at grid inverter terminal
Feasibility study on power control of grid-connected wind/PV hybrid generation. The modeling and simulation study was carried out based on MATLAB. The simulation results showed the excellent performance of the wind/PV hybrid control in response to severe changes in wind speed and solar intensity conditions. Control and analysis of hybrid systems with fuel cell generation will follow in a future work.
[1] K. Rajashekara, IEEE Trans. Ind. Appl. 41 (3) (2005) 682–689.
[2] K. Agbossou, M. Kolhe, J. Hamelin, T.K. Bose, IEEE Trans. Energy
Convers. 19 (3) (2004) 633–640.
[3] A. Bilodeau, K. Agbossou, J. Power Sources 162 (2) (2006) 757–764.
[4] O.C. Onar, M. Uzunoglu, M.S. Alam, J. Power Sources 161 (1) (2006)
707–722
[5] Singh SP. Self excited induction generator research – a survey. Elec- tric Power Syst Res 2004:107–14.
[6] Ahshan R, Iqbal MT, Mann George KI. Controller for a small induc- tion-generator based wind turbine. Appl Energy 2008:218–27.
[7] Lei Yazhou, Mullane Alan, Lightbody Gordon, Yacamini Robert.
Modeling of the wind turbine with a doubly fed induction generator for grid integration studies. IEEE Trans Energy Convers
2006;21(1):257–64.
[8] Chan TF, Lai LL. An axial-flux permanent-magnet synchronous ener- gy for a direct-coupled wind turbine system. IEEE Trans Energy Convers 2007;22(1).
[9] Ong Chee Mun. Modeling and dynamic simulation of electric ma- chinery using Matlab/Simulink. Prentice Hall Press; 1998
[9] Wang P, Billinton R. Reliabilitybenefit analysis of adding WTG to a distribution system. IEEE Trans Energy Convers 2001;16(2):134–9
[10] Ahmed Nabil A, Miyatake Masafumi. A stand-alone hybrid genera- tion system combining solar photovoltaic and wind turbine with simple maximum power point tracking control. In: Proc of CES/IEEE 5thinternational power electronics and motion control conference, IPEMC’06, Shanghai, China, 13–16 August; 2006
[11] H.X.Yang,L.Lu,I. Burnett."Weather data and probability analysis of PV-wind power generating system in HongKong"RenewableEnergy28,pp.1813-1824,(2003)
[12] Duffie Beckman. Solar engineering of thermal processes. John Wiley
&Sons, INC; 1991
IJSER © 2013 http://www.ijser.org