International Journal of Scientific & Engineering Research, Volume 3, Issue 5, May 2012 1
ISSN 2229-5518
Microcontroller Based V-I Curve Tracer
Atul Patel, Anupam Dubey, Siddharth Dutt Choubey and Ajitesh Pandey
Abstract— V-I characteristic of any electronic component is useful to determine basic parameter of that component and to model its behavior in an electrical circuit. This paper presents a low power measurement unit made with the help of microcontroller (At mega16) for the measurement of voltage and current. Voltage and current consumption of an electronic component has been analyzed and displayed on a LCD as well as received by PC to be further plotting a V-I curve using MATLAB tool simultaneously. Experimental results obtained with the Electronic circuit are presented.
Index Terms— Atmega16, I-V characteristics, Measurement tool, Programmable supply.
—————————— ——————————
HE conventional method for the V-I characteristic analysis employs a tedious process in which we have to connect voltmeter and an ammeter with an electronic component,
and then further the voltage level is varied to see for the cur- rent changes. The voltage and current readings are noted down and finally a graph is plotted between them using MATLAB [5]. Proposed method is quite easy where an elec- tronic component is connected to the measurement tool and with a single key press we get the V-I characteristic of the component. For accuracy in reading current a sensitive current to voltage converter is built using OP-AMP, acting as a non inverting amplifier. Apart from this a programmable voltage supply [1] is made out of the microcontroller using PWM (pulse width modulation), which serves as an input for one end of the component under monitoring. Using this pro- grammable supply desired voltage levels as well as voltage sweeps can be produced by simply coding the microcontroller.
Speed of measurement is depended upon the rate of sam- pling. A measurement has a resolution of 10bits and indicates a current between 0 and 500mA. This range proved to be suffi- cient for all measurements and provides accurate enough steps of 95µA per step. The external 3x gain of Non-inverting amplifier [3] is used to measure the small current, and con- verting them into voltage. Reading of these two channels is converted and scaled using formulae to display the exact re- sults. Paper presents a revolutionary tool for industries in which a large number of sensors are used for the automation purposes. Generally these units are used in testing the compo- nents in the production cell in the manufacturing process. The central processing of the system is accomplished by microcon- troller ATmega16 [6].
————————————————
![]() Anupam Dubey is currently pursuing masters degree program in Information
Anupam Dubey is currently pursuing masters degree program in Information
Technology in IIPM, Kanpur, India. E-mail: Dubey.anupam@gmail.com
![]() Siddharth Dutt Choubey is with Information Technology department in
Siddharth Dutt Choubey is with Information Technology department in
SRIT Jabalpur, India. E-mail: Siddharth.choubey@gmail.com
![]() Ajitesh Pandey is currently pursuing Bachelors degree in Electronics and
Ajitesh Pandey is currently pursuing Bachelors degree in Electronics and
Communication Engineering in Oriental EngineeringCollege, Jabalpur, India.
E-mail: ajitesh.9.pandey@gmail.com
The ATmega16 is a low-power CMOS 8-bit microcontroller based on the AVR enhanced RISC architecture. By executing instructions in a single clock cycle, the ATmega16 achieves throughputs approaching 1 MIPS per MHz allowing the sys- tem designer to optimize power consumption versus processing speed. The ATmega16 features a 10-bit successive approximation ADC.
Microcontroller’s ADC unit samples the data into 10 bit binary
form.
Value of ADC is given by-![]()
Suppose for value of 512 value of ADC is 2.5V is derived using
formulae’s
(512)*(5/1024) = 2.5Volts
Hence using this formula in our code we display the voltage
supplied to the device. IF voltage is higher than 5V then we
use a voltage divider and multiply it in our formulae by its
scaling factor i.e. for 100V divider is giving us 4V then scaling
factor is 25.Hence using this method any voltage can be meas- ured.
We are applying ohms law for a known value of resistor.![]()
R is 5 ohm in our case. Therefore I =V/5 again gain of non inverting amplifier is![]()
![]()
![]()
![]()
![]()
![]()
RF=20k R1=10k Av=3.So correspondingly our current equa- tion is
IJSER © 2012
The research paper published by IJSER journal is about Microcontroller Based V-I Curve Tracer 2
ISSN 2229-5518
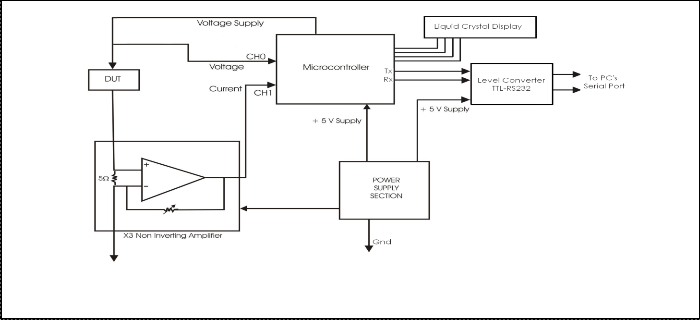
Fig. 1: Block Diagram of the electronic circuit for tracing the I-V of electronic components
The block diagram of the electronic circuit developed to trace the I-V characteristics electronic components is shown in Fig- ure.1 (shown at end of the paper). Voltage Reading for DUT (device under test) is carried out by connecting the supply to the ADC channel 0 input of the microcontroller. Microcontrol- ler converts this analog value in digital format i.e. 0-1023 for
10 bit operation. Again to convert the reading to the voltage it must be multiplied with the factor of (5/1024) for 5volts of operating range. These conversions are directly carried out using floating point library found in C compiler. Results are buffered and shown to the display in volts level. A predefined voltage sweep is programmed like for example, a voltage in- creasing from 0v to 10v in steps of 1v. For measurement of current a series shunt resistor is connected to the device and the voltage drop is measured which is equivalent to the cur- rent drawn by OHM’s law (I=v/r) where R is 5 ohm. But since the voltage drop is quite small to be measured by the ADC of the circuit it is then amplified by the non inverting amplifier constructed with the LM358 FET based OPAMP IC with gain of 3X (1+RF/R1), where RF is 20k and R1 is 10k respectively.
16*2 LCD has been interfaced with the microcontroller to dis- play the data digitally. The voltage is displayed in terms of volts and current is displayed in terms of miliampere on the LCD. The same voltage and current readings are then send to the PC through a level converting stage (TTL-RS232) for fur- ther plotting the graph between them using MATLAB tool.
Fig.2: V-I characteristics of a 1N4001 diode connected to probes of the proposed device and the graph is obtained from MATLAB.
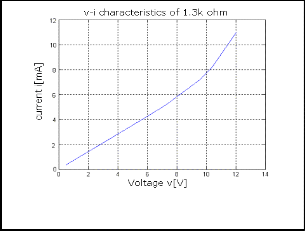
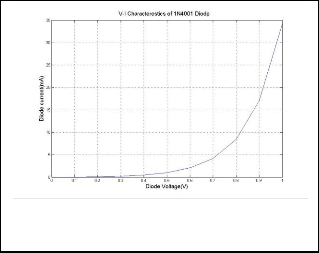
Fig. 3 show v-i curve for the known resistance of value 1.3k ohm. This graph is furnished using MATLAB, where both vol- tage and corresponding current readings are received from the proposed device.
The experimental results were obtained using a diode 1N4001, and a resistance of value 1.3k ohm. The V-I Characteristics of both of these components is observed in the graph obtained
from MATLAB. Cu
Fig. 3: I-V characteristics of the 1k3 ohm resistor plotted on
MATLAB utilizing the data obtained from this measuring
op-
IJSER © 2012
The research paper published by IJSER journal is about Microcontroller Based V-I Curve Tracer 3
ISSN 2229-5518
amp’s limit the curve tends to fluctuates, it could easily be make out that device works extremely precise below 10v. The experimental result obtained for diode 1N4001 is shown in figure 3. Sweep voltage of 2v is programmed with steps of
0.5v and for each 0.5v increment current is also monitored.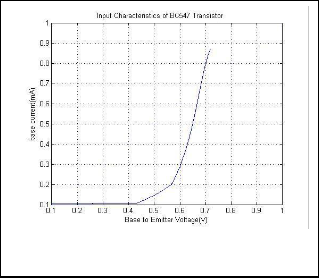
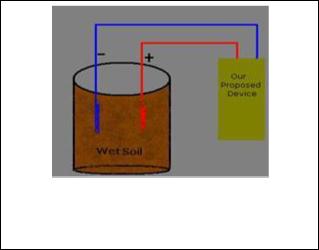
Fig. 5: Wet Soil Examination: observing the diode characteris- tics in the wet soil and for the measurement our proposed device is used.
Fig. 4: Input Characterestics of BC547 Transistor in
Common Emitter configuration
Fig.6 shows the setup for saline water examination [5] us- ing our proposed device so that the I-V characterestics of the same are obtained on MATLAB similar to the diode.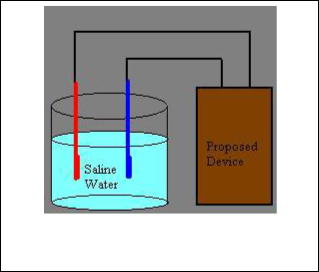
Fig.4 show the characterestics of the transistor plotted on MATLAB, the values of which are taken by connecting the transistor (BC547) to our proposed device. This demonstrates that the proposed device can be employed to obtain the cha- racterestics of three terminal devices as well. In our case we have presented the input characterestics of BC547 transistor in common emitter configuration. To perform this collector to emitter voltage is maintained at a fixed potential of 0.8V. From this experimental result it can be concluded that the device is capable of handling the minute changes in voltage and cur- rents for precise and smooth operation.
This novel device is capable of measuring the voltage and cur- rent of the passive devices such as transistors and FET includ- ing wet soil electronic devices [2] and saline water electronic components [8]. The results obtained from these components are observed in graph obtained from MATLAB as I-V charac- terestics. The demonstration below shows how this proposed device is capable of tracing out the characterestics of the pas- sive components fabricated other than the conventional mate- rials for examination purposes [2] [5]. Such electronic devices require a quick and continuous measurement of current and voltage values and this proposed device satisfies these re- quirements and performs better than conventional equip- ments.
Fig. 5 shows the applicability of the device to measure voltage and current relationship in case of wet soil fabricated electron- ic components, with high accuracy and precision on a single key press.
Fig. 6: Saline Water Examination with our proposed device.
This paper presented a microcontroller based electronic circuit for analyzing the electronic component by tracing their I-V characteristics. Op-Amp is used in non inverting mode for current to voltage conversion. A programmable voltage supply is deduced using the PWM (Pulse Width Modulation) over the microcontroller. Experimental results obtained with a known resistance, diode, transistor, blood diode, and wet soil fabricated electronic components demonstrates the operation of the electronic circuit developed in this work. The device is extremely fundamental in examing the electronic component present in natures’ bed. MATLAB is used as monitoring tools for plotting the characteristics.
The proposed work is further to be improved where a data-
IJSER © 2012
The research paper published by IJSER journal is about Microcontroller Based V-I Curve Tracer 4
ISSN 2229-5518
base of V-I characterstics of various electronic components will be stored in MATLAB and a script will be written which would compare the V-I characterstics of DTU(Device Under Test) with those stored in the database. Then the proposed device would not only provide us with the V-I characteristics but we could also get the exact component specification.
[1] Duran, E.; Galan, J.; Sidrach-de-Cardona, M.; Ferrera, M.B.; Andujar, J.M.; ”A new application of duty cycle sweep based on microcontroller to ob- tain th I-V characteristic curve of photovoltic Modules ”page1-6,print ISBN:978-1-4224-1705-6,Apr.2008
[2] S P Kosta, Y M Dubey, A Gaur, Y P Kosta, and S Kosta “Wet Soil Electronic Device- Transistor and Ats application Circuit”, Journal of Engineering And Applied Sciences 3(10): 798-802, 2008, ISSN: 1816-949X
[3] Vicente Leite and Faustino Chenlo” An Improved Electronic Circuit for Trac- ing the I-V Characteristics of Photovoltaic Modules and Strings”, International Conference on Renewable Energies and Power Quality(ICREPQ’10)Granada (Spain), 23th to 25th March, 2010
[4] Haque, M.H.” Use of V-I characteristic as a tool to assess the static voltage stability limit of a power system “page 1-7, ISSN: 1350-2360, Jan. 2004
[5] S P Kosta, J Gupta et al.” sea-water electronic circuits for salinity And tempera-
ture and pollution monitoring. Journal of Medicine and Biomedical Sciences, ISSN: 2078-0273, November, 2010
[6] Ramakant A. Gayakwad,Op-Amps and Linear Integrated Circuit 4th edition, PHI
publication 2002,ISBN-81-203-2058-1
[7] www.mathworks.com/help/techdoc/matlab_external/f62852.html
[8] www.atmel.com/atmel/acrobat/doc2466.pdf
IJSER © 2012