
International Journal of Scientific & Engineering Research, Volume 4, Issue 7, July-2013 930
ISSN 2229-5518
MSE Vs SSIM
1Swati A.Gandhi,2C.V.kulkarni
Abstract—IQA plays important role in digital image processing. It can be used to improve pictorial information or processing of data for transmission and representation. It can be done using FR,RR and NR methods depending on the availability of original and test image. In this paper concentrating on FR IQA methods using SSIM.
Index Terms— Digital image processing, Image Quality Assessment (IQA),Mean Square Error (MSE),Structural
Similarity Index Matrices (MSE). .
![]()
![]()
![]()
![]()
SOURCE TRANSMITTER COMMUNICATION CHANNEL
![]()
![]()
![]()
![]()
RECEIVER DESTINATION
IMAGE/ | SENSING/ | STORAGE | RE- | PERCEPTION |
AUDIO/ | RECORDING | PROCESSING/ | CONSTRUCTION |
Fig.1 Basic Digital Image Processing System.
Digital image processing methods are used for two basic principal applications, such as first for improvement of pictorial information for human perception and second for processing of image data for storage, transmission and representation for autonomous machine perception.
An image may be defined as two dimensional function f(x,y) where x and y are spatial coordinates and amplitude of f at any pair of coordinate (x,y) is called the intensity or gray level of image at that point when x, y and amplitude value of f are all finite value, is called as digital image. Digital image composed of finite number of elements where each have particular location and value called pixels.As shown in fig.(1), overall digital image processing is divided into three levels such as low level, medium level and high level of processing.
Low level processing involves source and transmitter. Source is nothing but image, audio or video .here we consider digital image only. At the transmitter side, preprocessing is done after sensing the object. Preprocessing involves primary operations such as noise reduction, contrast enhancement and image sharpening.
Medium level processing is done at communication channel.
• 1Swati.Ajay.Gandhi is currently pursuing masters degree
program in electronics and telecommunication engineering inMIT COE, Universit of Pune, Pune,India, E-mail:
• 2C.V.Kulkarni,Department of E&TC,MIT COE,Pune,India, E-
mail: cvk1971@gmail.com
At this level, segmentation, storage and transmission is done on input image. Hence output from medium level processing is nothing but extracted features such as edges, lines, curves and identity of individual object. Finally higher level processing is on receiver side. Receiver reconstruct the information and on that basis reorganization or perception is done.
During all this ,image quality which is received at the end side get degraded. Human being are the good observer who can analyse image quality using principle of perception of vision. Image quality can be defined in terms of image fidelity that is perfect image. Image quality is degree to which image satisfy the naturalness and usefulness of image. Hence, image quality assessment plays important role in variety of applications. It can be used to in acquisition and display system to monitor image quality. It can be used as benchmarking in different compression algorithm.
Image quality assessment methods (IQA) can be widely done using two methods namely subjective method and objective method asshown in fig.(2). In subjective analysis, group of observers are present to analyse the perceived image quality. Then overall quality score is calculated using mean
IJSER © 2013 http://www.ijser.org
International Journal of Scientific & Engineering Research, Volume 4, Issue 7, July-2013 931
ISSN 2229-5518
opinion score(MOS) and differential mean opinion score (DMOS) is calculated. On that basis,
the1n MSE is calculated using
1
quantitative analysis of image is done. Some criteria are consider during analysis such as
MSE=
![]()
𝑁
N 𝑖=1
|𝑥𝑖 − 𝑦𝑖 |2
(1)

viewing distance, angle, period, background and knowledge about image processing. Though it is more accurate for evaluating quality of perceived image still it is complicated and time consuming.
DSCQS
Peak signal to noise ratio is calculated as follow,![]()
PSNR=10 𝑙𝑙𝑙 � 𝑚2 � db. (2)
MSE
where m are maximum gray levels of 8 bits/pixel
of image.(Here, m=100 considered otherwise
m=255 for 8 bits/pixel) .
SUBJECTIVE
SSCQS
IQA
MSE, PSNR
ith
OBJECTIVE
HVS
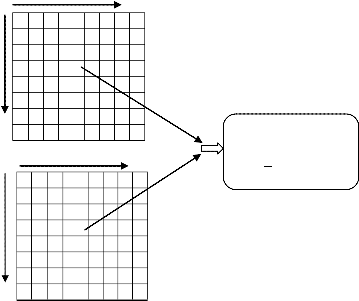
Original Image(x)
Minkowski metric
SSIM 1 |𝑥 − 𝑦 2
𝑁 𝑖
𝑖 |
Fig.2: Image Quality Assessment Methods
evaluate the quality matrices using mathematical calculation. Depending on availability of reference image, it can be classified into full reference FR, reduced reference RR and no/blind reference NR IQA.
• Full Reference (FR) IQA-Both test and original images are present.
• No Reference(NR) IQA-Only test image is present.
• Reduced Reference(RR) IQA-Partial information is available.(A set of extracted features made available.)
Most o f IQA methods are derived using full reference method. Here ,SSIM based full reference IQA is explained
Traditional and simple method for measuring the energy of error signal in test image. square of difference between error of original and test
/distorted image is calculated.
Two signals are compared pixel by pixel from left
to right and top to bottom through a row and column. Then calculate by averaging square of difference between error of original and test
/distorted image.
If x and y are two non negative gray scale images,
ith
Distorted Image(y)
Fig.3: Minkowski Metric For calculating MSE
Two signals are compared pixel by pixel from left to right and top to bottom through a row and column. Then calculate by averaging square of difference between error of original and test
/distorted image.
[1] simple and parameter independent.
[2] Square error calculated ,is independent of
other sample.
[3] MSE ≥ 0.
[4] MSE = 0 iff original signal(x)=test
signal(y).
[5] Clear physical meaning.
MSE value is small or equal to zero, indicate
minimum or zero distortion.MSE widely used in
variety of signal processing applications such as
denoising, reconstruction, classification,
restoration, filter designing.
IJSER © 2013 http://www.ijser.org
International Journal of Scientific & Engineering Research, Volume 4, Issue 7, July-2013 932
ISSN 2229-5518
• Major disadvantage of MSE is poorly correlate with human perception of visual system.
• According to human visual system HVS, error visibility is correlate with loss of quality. But ,MSE totally mismatch with![]()
l(x,y)= 2(1+𝑅) (6)
![]()
1+(1+𝑅2+ 𝐶1 )
𝜇𝑥2
If we assume C1 is small enough compare to
µx 2 ,then above equation is function of only R and
consistent with webbers law.
Contrast c(x,y) is given by![]()
c(x,y)= (2𝜎𝑥 𝜎𝑦+𝐶2) (7)
(𝜎 2 +𝜎 2 +𝐶2)
𝑥 𝑦
this because some distortions are not
clearly visible and some are present but
not disturbing the image quality.
• All images with equal MSE, does not
where σx , standard deviation as an estimate
of signal contrast by subtracting mean intensity
from signal.
1
mean that all contain same distortions or
𝜎𝑥 =
∑𝑁
(𝑥𝑖 − 𝜇𝑥 )2
noise.![]()
𝑁−1
𝑖=1 (8)
A new approach proposed to overcome this problem which provide solutions which are independent of visibility conditions and threshold
C2=(K2 l)2 and K2 ≪ 1 as small count.
With same amount of contrast change ∆σ =
σy − σx , this is less sensitive to high base contrast
σxthan low base contrast proves contrast masking
feature in human visual system( HVS).
Structure is calculated after subtracting
luminance and variance normalization, we
(𝑥−𝜇𝑥)
problems. Main aim to extract structural information from image. Structural Similarity
associate with two unit vectors given by
�𝑦−𝜇𝑦�
![]()
and
𝜎𝑥
Index Matrix (SSIM) separate out the three
𝜎𝑦
![]()
.Structure s(x,y) is calculated as follows:
𝜎𝑥𝑦+ 𝐶3
parameter such as luminance, contrast and
structure which are independent of each other and![]()
s(x,y)=
𝜎𝑥𝜎𝑦 +𝐶3
(9)
are highly structured.
If consider two non negative images x and y where
x is original discrete signal and y is distorted
where C3 is small constant and
𝜎 = 1 𝑁
discrete signal, then
SSIM(x,y)=f[l(x,y),c(x,y),s(x,y)] (3)
𝑥𝑦
∑𝑖=1(𝑥𝑖 − 𝜇𝑥 )(𝑦𝑖 − 𝜇𝑦 )
(10)
luminance l(x,y) is given by![]()
l(x,y)= (2𝜇𝑥𝜇𝑦+𝐶1) (𝜇𝑥2 +𝜇𝑦2 +𝐶1)
(4)
Hence, resultant SSIM(x,y) index is given by![]()
SSIM(x,y)= �2µxµy+C1��2σxσy+C2�
(µx2 +µy2 +C1)(σx2 +σy2 +C2)
(11)
where original signal mean![]()
1
where all three parameters are highly![]()
intensity 𝜇 =
𝑁
𝑁
𝑖=1
𝑥𝑖
, distorted signal mean
structured and relatively independent.
Mean SSIM (MSSIM) is calculated to evaluate
intensity 𝜇𝑦 =
∑𝑁
𝑦𝑖 and C1 is constant added to
𝑁 𝑖=1
overall image quality is given by
avoid instability when (𝜇𝑥 2 + 𝜇𝑦 2 ) is very close to
![]()
zero and equal to (𝐾1 𝑙)2. l is dynamic range of
![]()
MSSIM(x,y)= 1 ∑M
SSIM(x , y )
(11)
pixel values (255 for 8 bit gray scale image) and K1
1.
According to Webbers law, the magnitude of
just noticeable luminance change ΔI is
approximately proportional to background luminance I for wide range of luminance values.
Let R is change relative to background luminance, we rewrite luminance of distorted signal as
µy = (1 + R) µx. (5)
Substituting in above equation(4),
M j=1 j j
• Symmetry , S(x,y)=S(y,x)
• Unique maximum, S(x,y)=1 iff x=y
• Boundedness, S(x.y)≤ 1
A original image of harbour is taken, which is distorted with 4 different types of distortion
IJSER © 2013 http://www.ijser.org
International Journal of Scientific & Engineering Research, Volume 4, Issue 7, July-2013 933
ISSN 2229-5518
such as blurring,gaussian noise,JPG and JPG2K . All distorted images set with equal value of MSE. SSIM and error map is calculated for these distorted image along with original image.It proves that the matrices calculated is independent of visibility of error.


(b) (c) (a)
affected by noise. Hence it is easy to reconstruct the distorted image .
[1] K. Moorthy, Z. Wang and A. C. Bovik, "Visual perception and quality assessment," in Optical and Digital Image Processing (Cristobal, Schelkens and Thienpont, eds.), Wiley publisher, 2010.
[2] K. Seshadrinathan, T. N. Pappas, R. J. Safranek, J.
Chen, Z. Wang, H. R. Sheikh and A. C. Bovik, “Image quality assessment,” in Essential Guide to
[3] Z. Wang, A. C. Bovik and H. R. Sheikh, "Structural similarity based image quality assessment," in Digital Video Image Quality and Perceptual Coding (H. R. Wu, and K. R. Rao, eds.), Marcel Dekker Series in Signal Processing and Communications, Nov. 2005.
[4] Z. Wang, A. C. Bovik and E. P. Simoncelli,
(d)

(g)

(e)

(h)


(f)

(i)
"Structural approaches to image quality assessment," in Handbook of Image and
Video Processing (Al Bovik, eds.), second edition, Academic Press, May 2005.
[5] Z.Wang,A.C.Bovik,H.R.Sheikh,and E.P.Simoncelli,''Image quality assessment:From error visibility to structural similarity,"IEEE transactions on Image Processing,vol.13,no.4,Apr.
[6] Z.Wang,A.C.Bovik and L.Lu,"Why is image quality assessment so difficult?''IEEE International
2004Conference on Acoustics,speech and Signal
Processing,May 2002.
[7] Z.Wang, "Application of Objective Image Quality
Fig. 4.Comparision of "harbor" images with
different types of distortions and their SSIM error
map. a)Original image,
MSE=0;PSNR=INF;MSSIM=1;b)Blurr
image;MSE=83.61;PSNR=27.93; MSSIM=0.909;
d) Noisy image;MSE=87.23;PSNR=28.68;
MSSIM=0.734; e)JPG
image;MSE=83.58;PSNR=28.90; MSSIM=0.877;
f) JPG2 image;MSE=85.88;PSNR=28.79;
MSSIM=0.834; c),g),h) andi )SSIM error map of Blurr image, Noisy image,JPG image and JPG2 repectively.
Most of digital image processing application where IQA plays important role. SSIM totally depends on structural features which are extracted from image. Luminance. contrast and structure ,all parameters are independent.
SSIM error map shows area which is more
Assessment Methods,"IEEE SIGNAL PROCESSING MAGAZINE,pp-137-142,Nov. 2011.
[8] Kim-Han Thung,Paramesran Raveendran,"A Survey Of Image Quality Measures,"TECHPOS,International
Conference,pp-1-4,Dec.2009
[9] LIVE, http://live.ece.utexas.edu
[10] "Z.Wang Plublication Home Page", https://ece.uwaterloo.ca/~z70wang/publications
.htm#journal_papers
IJSER © 2013 http://www.ijser.org
International Journal of Scientific & Engineering Research, Volume 4, Issue 7, July-2013 934
ISSN 2229-5518
IJSER © 2013 http://www.ijser.org