International Journal of Scientific & Engineering Research, Volume 6, Issue 3, March-2015 1444
ISSN 2229-5518
Investigation of Flushing Sediments from Large
Reservoir Using Numerical Methods
Dr. A.R Ghumman, Engr. Israr ul Haq
University of Engineering and Technology Taxila
Abstract— Sedimentation is a phenomenon in which eroded particles travelling with the water accumulates in the reservoirs due to change in velocities. These accumulations in reservoir reduce storage capacity and affect the service life of the project. Hydropower and Irrigation projects are considered as giants in countries economy therefore loss in storage capacity of large reservoirs due to sedimentation is very sensitive issue, in our country tarbela reservoir is facing the said problem and now have become burning issue. Pakistan government and WAPDA are working of solutions for sediment flushing of tarbela reservoir. In my Research work I have selected the reservoir just underneath tarbela that is being used to regulate the flow in Ghazi Barotha Power channel that is generating about 1400 MW of electricity. The reservoir length is 7 km and depth from 6m to 14m. I have taken seven crossections of the pound and applied the boundary conditions to these sections and performed hydraulic flushing simulations using HEC RAS 10.1 also used GIS and HECGEORAS for modeling of pond. After performing these simulations w.r.t to available water results have compared to original crossections to calculate the flushing efficiency. I have also calibrated my model by plotting original section at the time of construction of reservoir and performed simulation for 7 years from 2005 to 2011 and compared the simulated profiles to observed profiles obtained from Wapda from Hydrologic surveys performed at different years. The results I got without disturbing the barrage structure with available water we can get maximum efficiency of 25.71 %
Index Terms— Sediments, Flushing, Reservoir, HEC-RAS, GIS, Model, Efficiency
1 INTRODUCTION
—————————— ——————————
eservoir developments help the world to fulfill the food and fiber Requirements. It also plays an important role in accomplishing the irrigation demands of the country
as well as they can be used in flood control measures. They can
also be used for hydro power generation process which is the cheapest source of the energy in the world due to huge social and economic benefits of the reservoir trends of reservoir con- struction was drastically increased in 20thcentury. Most of the world reservoirs were constructed in this era and the figure reaches to 33105 in 2003 with storage capacity of 6700 Km³of fresh water worldwide.
Now days due to reduction in suitable sites for new reservoirs
the trend has been shifted to the conservation and better man- agement of existing reservoirs to get long lasting benefits from them. Major Issue being faced is about the capacity loss of the reservoirs due to impounding of the sediments. Sediments in- flows from the catchment areas in the form of finer suspended Particles and heavier loads traveling along the bed of the river due to decrease in velocity with in reservoir these particles set- tles down along the bed and forms delta of sediments hence changing the bed profiles of the reservoirs and resulting in the loss of storage capacity. Approximately 1 % loss of the storage capacity is observed per year due to sedimentation (Yoon.1992 and Mahmood .1987).Situation is going critical day by day about
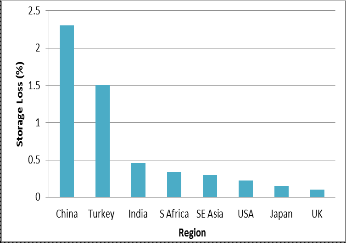
0.1% to 2.3% of the storage loss is going on to the worlds reser- voirs (Liu (2002).
Estimated Losses are about 9 billion US $ per year (Khan et al.2012).River sediments have worst effects on the functioning of reservoirs. Due to loss in storage capacity less water is avail-
able for irrigation and power demands also water supply schemes are affected. Sediment deposition near the intakes of the power turbines causes the wear and tear of the expensive
machines resulting in heavy financial losses.
Figure 1.1 : Country Wise Storage losses
Pakistan’s major reservoirs i.e. Tarbela & Mangla have lost ca- pacity gross storage capacity up to 28.23% and 20.54% respec- tively (Hydrographic survey, WAPDA 2005).Different techniques are being adapted to reduce sediment inflow towards reser- voir. Some of them are to plant more green areas in catchment also to build check dams so that erosion process can be re- duced. Excavation and Dragging can be used to remove sedi- ments from reservoirs but they are quite expensive techniques there hydraulic method known as flushing is preferably used
IJSER © 2015 http://www.ijser.org
International Journal of Scientific & Engineering Research, Volume 6, Issue 3, March-2015 1445
ISSN 2229-5518
all over the world. Flushing technique is in practice since many decades. Flushing is very effective method for the removal of sediment deposited in the narrow reservoir. Flushing is basi- cally the removal of sediments from reservoirs by using low level outlets. Brandt highlighted that flushing is carried out to remove sediments by eroding them while sluicing is carried out to remove arriving sediments towards reservoir not con- sidering the conditions of drawdown.Lai and Shen (1996) has described two types of flushing
a) Use of high flows to flush the sediment de- posited in the reservoir.
b) Allow higher sediment concentrated flow during floods
1.1 Sedimentation in Major Reservoir of Pakistan
Major reservoirs of Pakistan are losing their storage capacity very rapidly due to sedimentation. Warsak dam constructed on River Kabul is the first dam built after the independence of Pakistan has lost its total storage capacity, now it is only used for power generation.
1.2 Reservoir sedimentation Management
Natural rivers usually attain equilibrium regime with respect to sediment deposition after years and years of flow and there are no major changes in their bed. By developing any obstruc- tion like Dam for Reservoir this balance got changed for similar discharge the area increases and velocity reduces which force the sediment to deposit in the bed. The methods for controlling sediments can be separated in three types:
1.2.1 Preventive Methods :
Preventive methods reduce the sediment yield in the water sheds. They are based on erosion of water sheds management techniques usually accessed by ULSE (Universal Soil Loss Equation) & RULSE (Revised Universal Soil Loss Equations) etc.
1.2.3 Routing Methods:
In this methods sediments tried to pass through sluic- ing or bypassing techniques.
1.2.4 Curative Methods:
In this method removal techniques e.g flushing, Dredging & Hydrosuctions are used
1.3 Sediment Management by Reservoir Flushing:
In Reservoir flushing “The flow velocities are increased by allowing the water to pass through the low level out- lets/tunnels so that deposited sediments can be evacuated”. To make flushing more effective riverine conditions should be created in the reservoir for sufficient time. Low level outlets should be close to river bed and of sufficient capacity to allow full draw down flushing. White and Bettess (1984) classified sediment flushing option in to two categories.
a. A Full Draw Down Flushing b. B Partial Flushing
1.4 Factors Effecting the Feasibility & Efficiency of
Flushing :
• Flushing is more successful in hydrologically small
reservoir having the storage capacity less than 30
%.
• The water Level of the reservoir should be kept as low
as possible.
• The sediment deposits should not be consolidated and
their size should be small.
• Narrow reservoirs with steep cross sectional and lon-
gitudinal slopes may be successfully flushed
• The reservoir should be sufficient capacity of Low lev- el outlets available to keep them empty while flushing
• Flushing Volume of atleast 10% of annual flows
should be expected
Study revealed that about 50 reservoirs exist in world, which had been flushed successfully. China has the most number of flushed reservoir in the world. On the other hand many reser- voirs have not been flushed successfully. Warsak dam in Paki- stan is one of the examples of such reservoir.
Flushing has been successfully carried out at Baira-India,
Gebidem-Switzerland, Gmund-Austria, Hengshan-China, Palagnedra-switzerland, Santo-Domingo-Venezuela Reservoirs, while flushing had also been carried out on the Reservoirs, Guanting-China, Guernsey-USA , Heisonglin-China, Ichari-India, Ouchi-Kurgan-Former USSR, Sanmenxia-China,Sufid-Rud-Iran, Shuicaozi-China, but not successfully flushed (Atkinson, 1996; Emamgholizadeh et al.,2006).
2 RESERVOIR SELECTION & SEDIMENT CALCULATIONS
This chapter mainly includes the selection criteria of reservoirs and brief of their data. The chapter also states about Indus ba- sin and Indus River in Pakistan on which all the case reservoirs (Diamer Basha, Tarbela, Ghazi and Chashma) are located. The data mainly includes hydrologic and sediment along with the irrigation demands and operational rule curves of case study reservoirs.
2.1 Reservoir Selection:
For our study work we will use most recently constructed res- ervoir on Indus River that is the pound between Tarbela Dam and Ghazi Barrage. The reservoirpound is 7 km long with an average depth of 6m and a maximum depth of 14 m, designed to receive all the flows from Tarbela Power house and spill- ways and to regulate the barrage water levels and the dis- charge water to regulate the flow to power channel in the first place, regulate minimum water discharges into the Indus in the second place, both for the irrigation and maintaining it in self- cleaning mode and thirdly to regulate river flows including all flood flows. Vicinity map of the site is as below:
IJSER © 2015 http://www.ijser.org
International Journal of Scientific & Engineering Research, Volume 6, Issue 3, March-2015 1446
ISSN 2229-5518
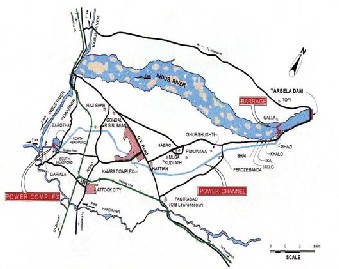
Figure 2.1 Layout of Ghazi Hydropower Project
2.2 GHAZI BARRAGE:
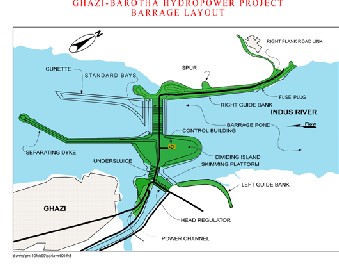
7 km long pound’s major controlling is Ghazi barrage. All the water of Indus River comes in to this pound also it takes major share of sediments from Tarbela reservoir. Barrage Layout and technical data is as follows:
Figure 2.2 Layout of Ghazi Barrage
2.2.1 Technical Data:
• NormalPond Level 340.00m (1115.50ft)
• Live Storage Capacity 50 Million Cubic Meter
• Maximum (Survival) Pond Level 341.50m (1120.40ft)
Design Flood Discharge Capacity18,700 m³/s
(660,000cusecs)
• Discharge Intensity (Average)36.50 cumecs/m (393 cu-
secs/ft)
• Survival Flood Capacities:
o Gated Sections 23,000 m³/s (812,000 cusecs)
o FusePlug 23,200m³/s (819,000 cusecs)
o Combined 46,200 m³/s (1,630,000 cusecs)
• Constructions Flood 14,500 m³/s (512,000 cusecs)
2.2.2 Standard Bays (SB)
• No. of Gates 20
• Gate Size (Opening) 18.3m x 7.8m (W X H)
• Gate Type Radial
• Sill Level 332.20m (1090.00ft)
4.2.3 Under sluices (US)
• No. of Gates 8
• Gate Size (Opening) 18.3m x 2.8m (W X H)
• Gate Type Radial
• Sill Level 326.00m (1069.50ft)
• Gantry Crane (For SB &US gates) 75/10 t
2.2.4 Head Regulator (HR)
• No. of Gates 8
• Gate Size (Opening) 18.3m x 7.0m (W X H)
• Gate Type Radial
• Sill Level 333.00m (1092.50ft)
• Gantry Crane (For HR gates) 75/10 t
2.3 SEDIMENT DEPOSITION:
Since the Reservoir is Located underneath Tarbela Dam there- fore it has to take the entire sediment load coming from Tarbe- la reservoir outflow tunnels. Sediment coming into the pond varies in quantity as well as gradation from season to season monitoring authority i.e. water and power regulatory authority (WAPDA) conducts hydrologic surveys of the pond from time to time. Barrage construction was started in 1996 and it was in operational condition in August 2003.
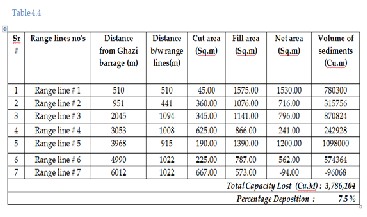
To calculate the sediment deposition whole the pond of 7 km is
divided into seven cross sections were named as range lines.Distance between the range lines is as follows:
Table 2.1
IJSER © 2015 http://www.ijser.org
International Journal of Scientific & Engineering Research, Volume 6, Issue 3, March-2015 1447
ISSN 2229-5518
After the operation it was natural that sediments will start de- posit in the reservoir to record these sediments hydrologic sur- veys were conducted in May 2005 , April 2007 , March 2009 , August 2010 , December 2011 the results of these surveys as compared to original bed profiles of 2002 are as follows :
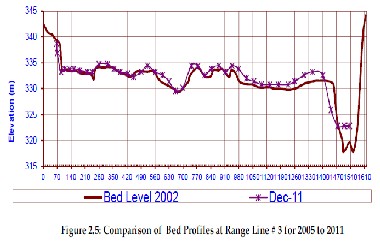
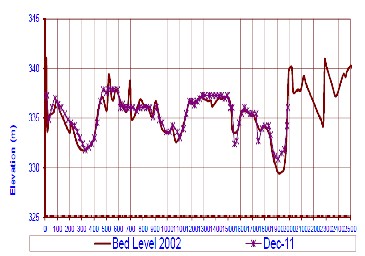
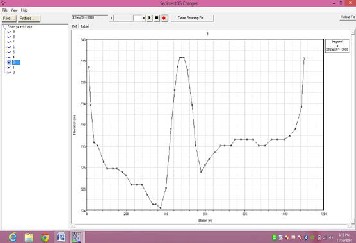
2.3.1 Range Line # 1:
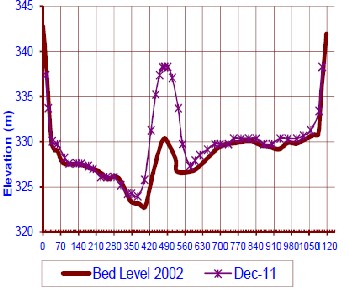
Original profile before construction of reservoir with com- parison to profile in December 2011 is as Follows:
Figure 2.3 : Comparison of Bed Profiles at Range Line # 1 for 2005 to 2011
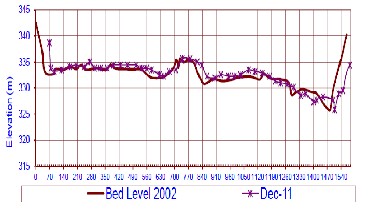
2.3.2 Range Line # 2:
Original profile before construction of reservoir with compari- son to profile in December 2011 is as Follows:
son to profile in December 2011 is as Follows:
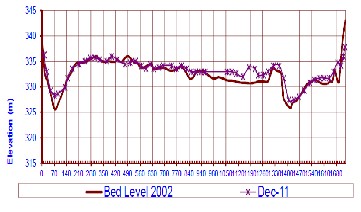
2.3.4 Range Line # 4:
Original profile before construction of reservoir with compari- son to profile in December 2011 is as Follows:
Figure 2.6: Comparison of Bed Profiles at Range Line # 4 for
2005 to 2011
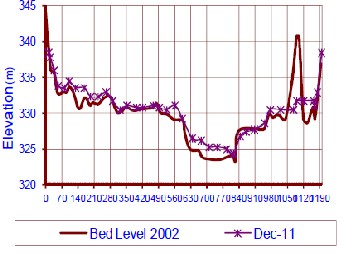
Figure 2.4: Comparison of Bed Profiles at Range Line # 2 for 2005 to 2011
2.3.5 Range Line # 5:
Original profile before construction of reservoir with compari- son to profile in December 2011 is as Follows:
2.3.3 Range Line # 3:
Original profile before construction of reservoir with compari-
Figure 2.7: Comparison of Bed Profiles at Range Line # 5 for
IJSER © 2015 http://www.ijser.org
International Journal of Scientific & Engineering Research, Volume 6, Issue 3, March-2015 1448
ISSN 2229-5518
2.3.6 Range Line # 6:
2005 to 2011
iments deposit in the pound over original base of 2002 before construction of barrage structure in line of flow. Tabular repre-
sentation of the described work w.r.t to the above plotted
Original profile before construction of reservoir with compari-
son to profile in December 2011 is as Follows:
Figure 2.8: Comparison of Bed Profiles at Range Line # 6 for
2005 to 2011
curves is as follows:
Live storage capacity of Ghazi Reservoir at time of construction was 500,000,000 Cu.m now from the above table we have net effect of 3,786,104 Cu.m of Capacity lost by dividing the two values we can get over all percentage reduction in live storage capacity i.e.7.52 % . Now in next chapter we will develop the numerical model to flush out these depositions
3- MODEL DEVELOPMENT AND ANALYSIS
In this chapter we will develop a model of reservoir discussed in above chapters using computer software. We will plot all the geometric data available and apply the boundary conditions of the stream, bed materials, available flows also incorporate dis- solved particles coming in to the pound w.r.t to seasonal dis- chargeswill try to establish the duration of flushing and calcu- late maximum possible efficiency without disturbing the Bar- rage structure. We will use Arch GIS 10.1 Software to gather the information about the geometry of the area and the will use HES GEO RAS for layer creation in Arch GIS So that Section
2.3.7 Range Line # 7:
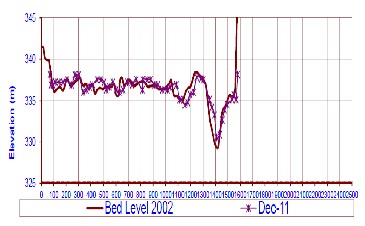
Original profile before construction of reservoir with compar- ison to profile in December 2011 is as Follows:
Figure 2.9: Comparison of Bed Profiles at Range Line # 7 for
2005 to 2011
2.4 CALCULATIONS OF SEDIMENTATION:
To calculate the total volume of sedimentation into the pond we will use the above cross sections. Method to be adapted is to overlap the curves of each range line for base year 2002 be- fore Barrage construction and latest available sections in De- cember 2011 by plotting the coordinates in AutoCAD and cal- culating the cut and fill areas, after getting the areas we will multiply these areas to distances between the range lines hence we will get the volume of sediments accumulated between two consecutive range lines. By summing up all these volumes be- tween the range lines we can calculate the total volume of sed-
can be created. Ist step in model development is geometry cre- ation.
3.1 Geometry Creation:
After plotting all the geometric data we will import the files to HEC RAS for flow Simulations. And will again adjust all the crossections with respect to the actual hydrological surveys data as discussed in above chapter. Final shape of HECRAS Geometry file is as follows:
IJSER © 2015 http://www.ijser.org
International Journal of Scientific & Engineering Research, Volume 6, Issue 3, March-2015 1449
ISSN 2229-5518
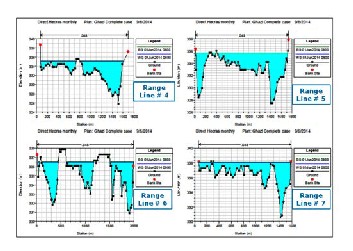
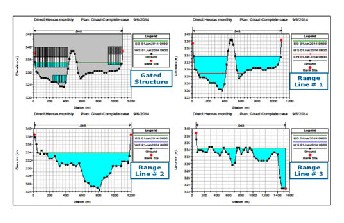
Figure 3.1 : HEC RAS Geometry Creation Ghazi pound
Model
3.2 BOUNDARY CONDITIONS:
After Assignning the geomateric properties to the model the next step are to assign the boundary conditions to the model boundary conditions can be used in HECRAS Model are of two types one is flow boundary conditions and the other is sedi- ment boundary conditions.
3.2.1 Flow Boundary Conditions :
Flow boundary conditions involved in our model will be water available for flushing in the stream or flow series which is maximum average daily discharge. This can be calculated by analyzing the daily dis- charge from Tarbela reservoir or maximum average daily inflows to Ghazi Pound we will takes averages of this data and convert this data in to daily average discharge in a unit month. From this we can get the quantity of water available for flushing operation and optimum time and duration for flushing. Other boundary condition that we can use is stage series which is discharge available to pass through the con- trolling structure while draw down of per unit head of
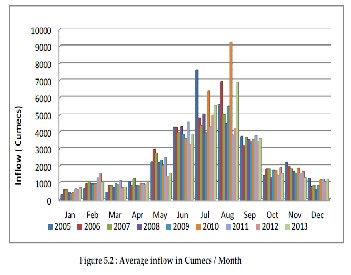
reservoir. In our case due to shallow height of reser- voir we will consider the first boundary condition the Graphical form of per day monthly inflow to Ghazi reservoir extracted from daily inflows are as follows:
we can see in the above graph that in Pakistan we maximum discharge in Indus river in the months of June, July and Au- gust because of snow melt of glaciers and in July and august monsoon rains also contributes into the river therefore we will take 3 months June July and August as Flushing Durations.
The other important boundary condition is gates operating
policy in case of large reservoirs they are feeding irrigation canals it is very much difficult to change the operating policies because millions of users relying on river water will suffer but in our case we can operate the gates because controlling struc- ture at Tarberla reservoir is controlled by Wapda according to water requirement of the provinces we are only using the wa- ter that is releases by Authorities at Tarbela Dam. We have se- lected the three month for simulations there as per above table we will use 4000 , 5000 & 6000 Cumecs of water in three con- secutive months. To pass all these discharges we have three controls one is head regulator for power channel Standard Bays for the Indus River and under sluices for sediment re- moval with sill levels of 333 , 332 and 326 respectively. We will open the under sluices up to full level of 8m the remaining two Openings will be half opened from bottom so that flushing discharges could not over topple the barrage structure.
3.3 SEDIMENT BOUNDARY CONDITIONS:
Sediment boundary can be assigned to the model are Sediment Bed Gradation , Maximum Scour Depth , Sediment Transport Function , Rating Curve and Sediment Load Series. We will discuss all with respect to our model.
IJSER © 2015 http://www.ijser.org
International Journal of Scientific & Engineering Research, Volume 6, Issue 3, March-2015 1450
ISSN 2229-5518
3.3.1 Sediment Bed Gradation :
First one is sediment Bed Gradation, in our case this is the gra- dation of material accumulated at the bed of the reservoir which is to be flushed out we will take the gradation as fol- lows:
Figure 3.2 : Sediment Bed Gradation
3.3.2 Sediment Transport Function :
We have already discussed available sediment transport functions in the above chapters we will use yangs sediment transport function for our simulations. The formulation of Yang (1973; see also 1996) can be ex- pressed as:

q = 1 X t q
t (R + 1) (1 − X ) w
t
In the above relations vs is the fall velocity associated with sediment size D50 .
3.3.3 Rating Curve :
Rating Curve is basically used to incorporate the effect of Suspended Sediments coming with inflow to the res- ervoir these sediments are expressed as ton/day quantity with respect to flow in cumecs also we have to specify the particle size w.r.t to share they are contributing to overall volume com- ing with inflow.
Figure 3.3 : Rating Curve
After assigning all the boundary conditions we assign the max- imum scour depth to the model that is in our case id maximum deposition over the original bed. Now we will go to run the simulations for to assigned boundary conditions over the pounds geometry will find out the results from the model.
og (X
106 )
5.435
0.286og
(R Re )
0.457og
u∗
10 t ⋅ = −
10 f p −

10 +
vs
4- MODEL RESULTS AND VALIDATION
u
US
U S
After geometry creation, assigning the boundary conditions
1.799 − 0.409og
(R Re ) − 0.314og
∗ og

− c
and running the analysis next step to take the results from the
10 f p
10 10
s s
vs
model and validate those results. HEC RAS after successful simulations regenerate the profiles of the pound at each prede-
2.5

u D
+ 0.66
, 1.2 < =u∗ D50 < 70
ν
fined crossection and will give the new deposition or scour
U og
∗ 50 − 0.06
depths. By plotting the new generated sections in Auto Cad
c =
10 ν
and Overlapping the sections to the sections in Dec 2011 we
vs
R f =

v s
RgD50
2.05 ,
70 ≤ =u∗ D50
ν
will get the new cut fill Areas, by multiplying these areas to the distances between the sections we will get the volume of sedi- ments gained or lost between each Section, by summing up all positive and negative values we will get the net effect on the total storage capacity of the pound. New generated sections after simulations are as follows.
Re p =
RgD50 D50

ν
4.1 Range Line # 1:
At Range line # 1 is very near to gated structure and whole the
IJSER © 2015 http://www.ijser.org
International Journal of Scientific & Engineering Research, Volume 6, Issue 3, March-2015 1451
ISSN 2229-5518
sediment from bed transport in the stream and as well as the dissolved particles load have to flow through the gated struc- ture. At range line # 1 due to shallow depth overall effect as compared to the original section is Deposition. Section is given below.
Figure 4.3 : Model results for Range Line # 3
Figure 4.1 : Model results for Range Line # 1
.
4.4 Range Line # 4:
Range line # 4 is at a distance of 3053m from the Barrage at this section we can see that bed has high elevations as compared to previous section therefore net effect of Scouring has been ob- served. Bed profile is as follows
4.2 Range Line # 2:
Range line # 2 is at a distance of 951m from the Barrage at this section slope is minimum therefore net effect is very minor deposition. Bed profile is as follows :
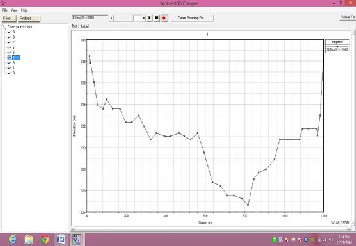
Figure 4.2 : Model results for Range Line # 2
4.3 Range Line # 3:
Range line # 3 is at a distance of 2045m from the Barrage at this section slope is minimum therefore net effect is very minor deposition. Bed profile is as follows.
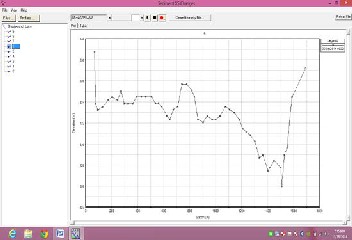
Figure 4.4 : Model results for Range Line # 4
4.5 Range Line # 5:
Range line # 5 is at a distance of 3968 m from the Barrage at this section downstream section has more elevations and to attain the equilibrium the net effect is deposition. Bed profile is as follows
IJSER © 2015 http://www.ijser.org
International Journal of Scientific & Engineering Research, Volume 6, Issue 3, March-2015 1452
ISSN 2229-5518
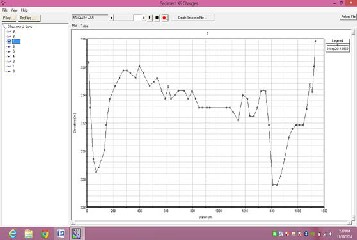
Figure 4.5 : Model results for Range Line # 5
4.6 Range Line # 6:
Range line # 6 is at a distance of 4990 m from the Barrage. This section Receives water with more velocities as near to Tarbela dam therefore net effect is Major Scouring to Bed profile is as follows.
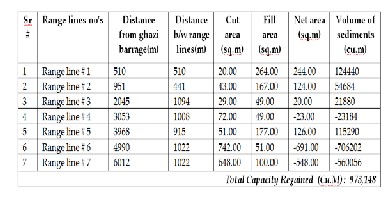
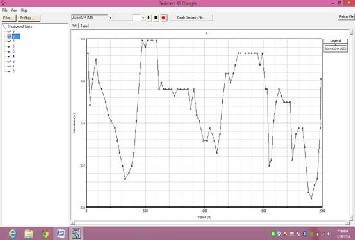
Figure 4.6 : Model results for Range Line # 6
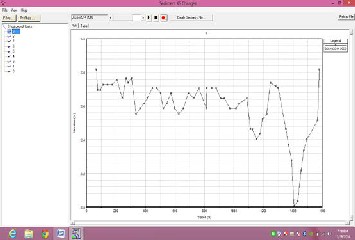
4.7 Range Line # 7:
Range line # 7 is at a distance of 6012 m from the Barrage This Section directly receives water from Tarbela reservoir due to high fall velocity the net affecting Major Scouring. Bed profile is as follows
Figure 4.7: Model results for Range Line # 7
4.8 Sediment Calculations after flushing Operation:
Now after getting the results from the model we will compare the generated profiles to the profiles to each range line before the flushing operations at stage of December 2011.The new cut fill area calculated from the above simulated profiles are as follows:
Table 4.1
From the above table we can see that the cumulative effect on any section is removal of 973,148 Cubic meters of sediments. The findings to Chapter 4 were 3,786,104 Cubic meters of sed- iments accumulations in pound. To calculate the overall effect of 3 Months flushing operation to Ghazi pound we will sub- tract the above two and calculate the percentage of flushed sediments it we come to 25.71 % now the next step is how to validate the model results.
4.9 Validation of Results:
To validate the result of simulation the approach I have select- ed is to model the pound data including all the cross sections and gated structure for the year 2005 considered this year as base line for simulations and has applied the boundary condi-
IJSER © 2015 http://www.ijser.org
International Journal of Scientific & Engineering Research, Volume 6, Issue 3, March-2015 1453
ISSN 2229-5518
tions including the flow data of respected months of the years and performed simulation for 6 years up to December 2011 and then got developed profiles for each year. After getting the re- sults from the software simulation we will again compare them with observed data sets and profile to these years the curves will match each other with some percentage of deviation that will shows the model results are acceptable.
After plotting geometric data and assigning the boundary con- ditions and analyzing the model for 6 years the results of the model are as follows
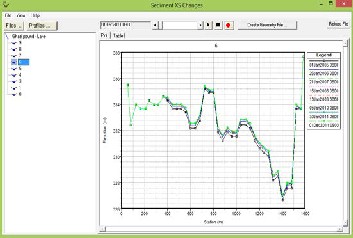
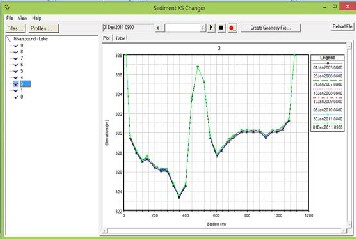 Figure 4.10 : Simulations for Bed Profiles from 2005 to
Figure 4.8 : Simulations for Bed Profiles from 2005 to 2011
for Range Line # 1
2011 for Range Line # 3
Figure 4.11 : Simulations for Bed Profiles from 2005 to
2011 for Range Line # 4
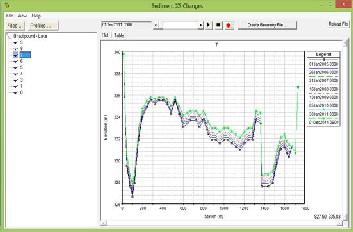
Figure 4.12 : Simulations for Bed Profiles from 2005 to
Figure 4.9 : Simulations for Bed Profiles from 2005 to 2011 for Range Line # 2
2011 for Range Line # 5
IJSER © 2015 http://www.ijser.org
International Journal of Scientific & Engineering Research, Volume 6, Issue 3, March-2015 1454
ISSN 2229-5518
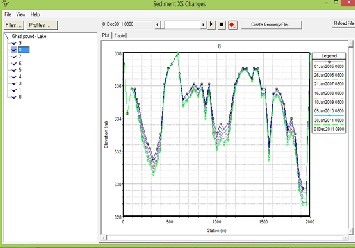
Figure 4.13 : Simulations for Bed Profiles from 2005 to 2011
for Range Line # 6
Above profile are showing simulated bed conditions for the year 2005,2006,2007,2008,2009,2010,2011 we have already dis- cussed observed profiles in previous chapter no. 4 for sediment calculations now we will overlap the Range lines Bed profiles for Range line no1 to Range Line no 6 and will plot the graphs so that we can see the deviations in the simulated and ob- served Bed profiles
Comparison of simulated and observed profile for Range lines
are as follows.
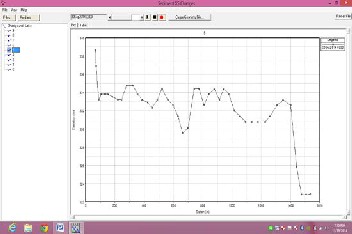
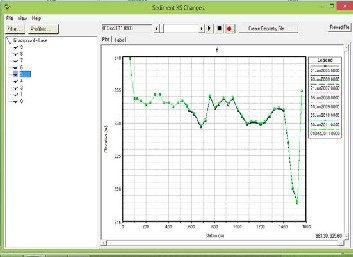
4.10 Range line # 1:
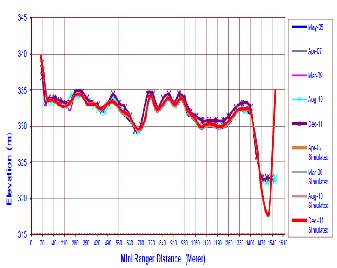
Figure 4.14 : Simulations vs Observed Bed Profiles from 2005 to 2001 for Range Line # 1
In the above graph red line shows simulated bed profiles gen- erated by HECRAS for December 2011 and purple line shows observed bed profile for December 2011 both the lines are over lapping year and resultantly validate our model results for range line no 1
4.11 Range line # 2:
Figure 4.14 : Simulations vs Observed Bed Profiles from 2005 to 2001 for Range Line # 1
Similarly we can see for range line no 2 Red line for simulated profile Dec 2011 & observed profile for December in purple colour are overlapping each other hence Validating Model Re- sults.
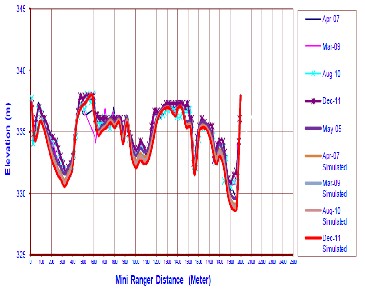
4.12 Range line # 3:
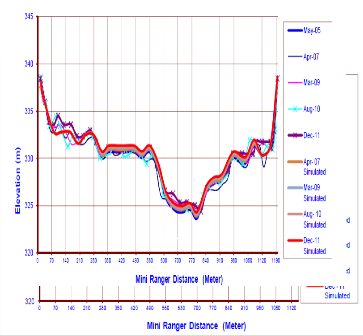
Figure 4.15 : Simulations vs Observed Bed Profiles from 2005 to 2001 for Range Line # 3
For Range line no 3 there is slight variation in observed vs simulated profiles but it is in acceptable range therefore we can say model results are validated for range line no 3.
4.13 Range line # 4:
IJSER © 2015 http://www.ijser.org
International Journal of Scientific & Engineering Research, Volume 6, Issue 3, March-2015 1455
ISSN 2229-5518
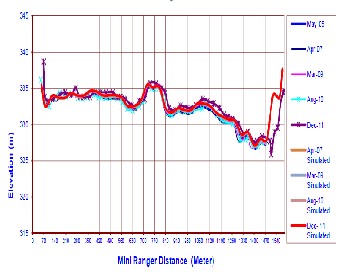
Figure 4.16 : Simulations vs Observed Bed Profiles from 2005 to 2001 for Range Line # 4
For Range line no 4 there is slight variation in observed vs simulated profiles but it is in acceptable range therefore we can say model results are validated for range line no 4
4.14 Range line # 5 :
Figure 4.17 : Simulations vs Observed Bed Profiles from 2005 to 2001 for Range Line # 5
Similarly we can see for range line no 5 Red line for simulated profile Dec 2011 & observed profile for December in purple color are overlapping each other hence Validating Model Re- sults
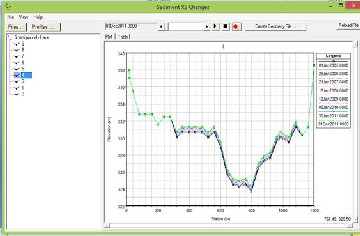
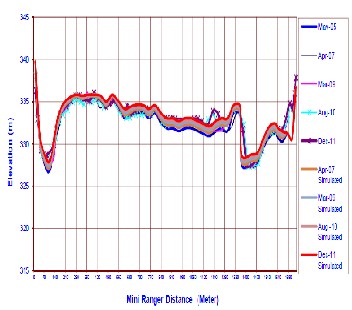
4.15 Range line # 6 :
Figure 4.18 : Simulations vs Observed Bed Profiles from 2005 to 2001 for Range Line # 6
For Range line no 6 there is slight variation in observed vs. simulated profiles,the reasons behind is that it is under direct fall of Tarbela dam therefore slite variation in actual conditions are acceptable we can say model results are acceptable for range line no 6.
We can conclude that overall results of the entire range lines are acceptable there we can say that results of the model creat- ed for sediment flushing of Ghazi reservoir are successfully validated.
5-CONCLUSION
We will conclude all our results and discussion as at the start of the project the aim was to make a model for sediment flushing in reservoir and investigate the effects of flushing operation in the reservoir in my case we have selected one of the most re- cently constructed project of Ghazi Brotha Hydro Power Pro- ject. The major objected of GBHP is to produce electricity by using hydraulic head between the Ghazi Barrage and Brotha Power House. The section we had selected for my study work was a reservoir created between Tarbela Dam and Ghazi Bar- rage to control the water Flow in the Power Channel. The length of Section is 7 km with average width of 1.25 Km and Average Depth of 6 Km. Maximum water Level of Pound was
340 m. The Live storage Capacity of the reservoir at the time of
construction was 50 Million cubic meter.
In our study work we first calculated the capacity lost till the
latest hydrologic survey i.e 3.786 Million cubic meters which is
approximately 7.5 % of overall storage capacity of the Reser- voir. Then we modeled current conditions of the lake with help
IJSER © 2015 http://www.ijser.org
International Journal of Scientific & Engineering Research, Volume 6, Issue 3, March-2015 1456
ISSN 2229-5518
of HECRAS and performed flushing simulations after reaching successful results we calculated the effects of flushing opera- tion to the bed profiles of the reservoir also calculated the net storage capacity regained that is 0.973 Million cubic meter out of 3.786 million cubic meter deposition. The final results showed that 25.7 % of capacity lost was regained by the flush- ing operation.
we have also validated our results but modeling the pound over initial conditions at the time of construction and running the model over predefined boundary conditions and then compared them with physically observed yearly profiles from hydrologic surveys and validated my model results.
The findings of the study should be practically implemented on the reservoir so that we can get maximum benefits from the reservoir and our hydraulic structures can have more life so that they can contribute to the prosperity of country in a better way.
6-REFERENCES
[1] Ackers, P. and W. R. White. 1973. Sediment transport: new approach and analysis. Journal of Hydraulic En- gineering v.11, p. 2041-2060.
[2] Atkinson, E. 1996. The Feasibility of Flushing Sedi- ment from Reservoirs. Report OD 137, HR Walling- ford.
[3] Basson, G. R. and R. Albert. 1996. Sediment Pass-
Through Operations in Reservoirs. Volume 2 of Al-
bertson et al.
[4] Bechtler, W. and M. Nujia. 1996. Predicting Reservoir
Sedimentation with 2D Model FLOODSIM. Volume 1 of Albertson et al.
[5] Bouchard, J.P., F. Maurel, and Petitjean. 1996. Numeri- cal Modeling of Sediment Suspension in Reservoirs. Volume 1 of Albertson et al.
[6] Brandt, S. A. 2000. A review of reservoir desiltation.
International Journal of Sediment Research v. 3.
[7] Brownlie, W. R. 1981. Prediction of flow depth and
sediment discharge in open channels. Report No. KH-
R-43A, W. M. Keck Laboratory of Hydraulics and Wa-
ter Resources, California Institute of Technology, Pas- adena, California, USA, p. 232.
[8] Chang, H.H., L. L. Harrison, W. Lee, and S. Tu. 1996.
Numerical Modeling for Sediment Pass-Through Res-
ervoirs. Journal of Hydraulic Engineering, ASCE v.
122, No. 7.
[9] Chaudhry, M. A. and H. Rehman. 2007. Approaches to Enhance the Life of Reservoirs. Water Asia Interna- tional Conference and Expo of Water Technologies, p.
3-13, Lahore, Pakistan, January.
[10] Crowder, B.M. 1987. Economic Costs of Reservoir Sed-
imentation: a Regional Approach to estimating cropland erosion damages. Journal of Soil and Water Coservation v. 42, No. 3.
[11] Dawans, P. H, J. Charpie, W. Giezendanner, and H.
Rufwenacht. 1982. Le Degravement La Retenue De Gebidem. Proceedings 14th Congress on Large Dams, ICOLD, Rio de Janeiro, Brazil.
[12] Engelund, F. and E. Hansen. 1967. A Monograph on Sediment Transport in Alluvial Streams, Technisk Vorlag, Copenhagen, Denmark.
[13] Hydrologic Survey Reports for GBHP 2005 to 2011 from Barrage control Building Ghazi Barrage WAP- DA.
[14] Jungkyu A. Numerical Modeling of Reservoir Sedi-
mentation And Flushing Processes. Department of
Civil and Environmental Engineering For the Degree
of Doctor of Philosophy Colorado State University
Fort Collins, Colorado
[15] Karim, F., 1998. Bed material discharge prediction for nonuniform bed sediments. Journal of Hydraulic En- gineering v.6, p. 597-604.
[16] Karim, F., and J. F. Kennedy. 1981. Computer-based predictors for sediment discharge and friction factor of
alluvial streams, Report No. 242, Iowa Institute of Hy- draulic Research, University of Iowa, Iowa City, Iowa.
[17] Mahmood, K. 1987. Reservoir Sedimentation: Impact, Extent, and Mitigation. World Bank Technical Paper Number 71, the International Bank for Reconstruction
and Development.
[18] Morris, G. L. and J. Fan. 1998. Reservoir sedimentation
handbook: Design and management of dams, reser-
voirs, and watersheds for sustainable use McGraw-
Hill.
[19] Morris, G.L. 1995. Reservoir Sedimentation and Sus-
tainable Development in India: Problem Scope and Remedial Strategies. Proceedings: Sixth International Symposium, River Sedimentation, New Delhi, India.
[20] N. Talebbeydokhti. and A. Naghshineh. Flushing Sed- iment through Reservoirs. Iranian Journal of Science &
Technology, Transaction B v. 28.
[21] Shen, H. W. and J. S. Lai. 1996. Sustain reservoir useful
life by flushing sediment. International Journal of Sed-
iment Research v. 11, p. 10-16.
[22] Talebbeydokhti, N. and A. Naghshineh. 2004. Flush-
ing sediment through reservoirs. Iranian Journal of
Science and Technology v.28, p. 119-136.
[23] Volume II of the project completion Report of Ghazi
Barotha Hydropower Project (2005) by Pakistan Hy-
dro Consultant.
[24] White W. R, L. Attewill, J. Ackers, and R. Wingfield.
1999. Guidelines for the flushing of sediment from
reservoirs. HR Wallingford. Report SR 563.
[25] Yang, C. T. 1973. Incipient motion and sediment
transport. Journal of Hydraulic Engineering v.10, p.
1679-1704.
[26] Yang, C. T. 1996. Sediment Transport Theory and
Practice, McGraw-Hill, USA, p. 396.
IJSER © 2015 http://www.ijser.org