International Journal of Scientific & Engineering Research, Volume 5, Issue 4, April-2014 366
ISSN 2229-5518
Investigating the Normal Operating Mode of
Abule-Egba Distribution Grid with Respect to Bus
Voltages, Line Currents and Line Flow
1Ademola Abdulkareem, 2Ayokunle A. Awelewa, 3J. O. Olowoleni, 4J. O. Ibironke
Abstract: This paper carries out the power flow studies of the distribution network of Abule-Egba regional area using the Run Load-Flow Functionality (RLFF) of the ETAP software developed algorithm. The part of real network of Abule-Egba distribution network was modeled and simulated through load- flow analysis. This work generates report on the load-flow and the real and reactive power loadings of each transformer unit of the network. This report was analyzed using simulation by the plotting of graph imported into Matlab software environment. The result obtained for the bus voltage and current level, transformer rating and load distribution efficien- cy based on voltage and current variations under the existing normal operational mode were compared and analyzed with the reaction of surrounding network under abnormal condition when a three-phase fault system is simulated. By comparing these results (as shown in table 1), the reaction of the electrical system of Abule-Egba
to three-phase fault at the various feeders can be predicted
.Index Terms— Power flow, modeling, simulation, RLFF ETAP, transformer loading, voltage level, current level, three-phase fault, capacitor banks
1 INTRODUCTION
—————————— ——————————
Electricity distribution is the final stage in the delivery (before retail) of electricity to end-users. A distribution system's net- work carries electricity from the transmission system and de- livers it to consumers and hence it is the most visible part of the supply chain, and as such, the most exposed to the critical observation of its users. The primary function of an energy system is to provide real and reactive powers demanded by the various loads connected, at the same time, frequency and bus voltage must be kept within the specified tolerance. There- fore, in order to discover the best way of operating power sys- tem, it is necessary to investigate the steady-state solution of the network for various generation and load requirements. Power-flow study is the steady-state analysis of an intercon- nected power system during normal operating conditions and it provides the required information regarding bus voltages and power flowing through transmission and distribution lines, transformers, and other elements of power system for a specified load demand subject to the regulation capabilities of generators, condensers, tap changing transformers and phase- shifting transformers. Power-flow studies, commonly referred to as load flow, are essential for power system analysis and design. Load flow studies are necessary for planning, econom- ic operation, scheduling and exchange of power between utili- ties. Load flow study is also required for many other analysis such as; transient stability, dynamic stability, contingency and state estimation by [1]. Grid 330kV daily load flows and line losses of Nigerian transmission Networks are usually comput- ed using the Gauss-Siedel (G.S) and Newton Raphson (N.R) iterative algorithm. However, the load flow iterative solution of G.S, N.R and Fast-decoupled employed to solve the distri- bution grid network power flow have failed in some circum- stances because of excessive computational time due to nu-
merous iterations and also the slow convergence. In addition, when a change is made in a network, such as expansion of grid, it is necessary to frame the new bus admittance from the abinitio [2, 3]].
To overcome the computation of line-flows, bus voltage viola- tion and line losses using load-flow iterative technique, this work is meant to model an electrical distribution grid on a Computer system, making it possible for the simulation of an electrical distribution grid for power flow analysis. Typically, the network includes medium-voltage (less than 50 kV and
33KV for Nigerian system) power lines, electrical substations
and pole-mounted transformers, low-voltage (less than 1 kV) distribution wiring and sometimes electricity meters. Hence the work models and simulates a distribution grid using the “ETAPS” software.
In order to model a distribution grid using ETAP, there is
some key information required to adequately model the dis- tribution grid. They are:
• The one-line diagram of the network which includes
the number of transformers and bus bars in the net- work.
• The rating of transformers in the network and their reactance.
• Information on the bus bars; the major information that can be obtained is the line voltage
• The transmission line parameters required for voltage drop determination
• The peak load
IJSER © 2014 http://www.ijser.org
International Journal of Scientific & Engineering Research, Volume 5, Issue 4, April-2014 367
ISSN 2229-5518
2. Modeling and Data Analysis
Modeling a distribution system requires getting a mathemati- cal model which represents the utilities that distribute electric- ity to final consumers. The utilities involved in the distribution of electricity are
• The distribution lines (11KV, 0.415KV for the Nigerian system).
• The distribution transformers (500kVA, 300kVA,
200kVA, 100kVA, 50kVA).
• The synchronous generator.
• The load.
2.1 Abule-Egba Distribution Grid Data
The one-line diagram of Abule-Egba distribution network is shown in Fig. 1 The utility company has multi-voltage systems with substations and transformer between each of these levels. It consists of one-single 33-kV Ota transmission line feeding Abule-Iroko and Yusuf 11-kV injection substations. The utili- ties which are involved in the distribution of electricity are: The 33-kV Ota transmission lines: 1 X 7.5 MVA 33/11kV, T/S 2
X 40MVA 33/11kV and 2x1.5 MVA 33/11kV transformers [4]
• The 11-kV Abule-Iroko Injection Substation: 12nos of
11/0.415kV distribution transformers rated - 6x500
KVA, 5x300 KVA and 1x50 KVA.
• The 11-kV Yusuf Injection Substation: 28nos of
11/0.415kV distribution transformers rated as - 20x500

KVA, 6x300 KVA and 2x50 KVA.
Figure 1: One-line diagram of Abule-Egba distribution grid [5]
3. Modeling and Simulation of Abule-Egba Dis- tribution Grid
Modeling: As earlier said, one best method to study a system is by making models and doing simulation. The advantage of doing simulation is that we can do changes in the model and see the result of changes.[6] From the single-line diagram of fig.1 of the modeled distribution grid, the procedure adopted (starting from the top down) for the study is as follows:
1. The power grid: This represents the network system up until the secondary distribution. It is set to swing mode because it makes up the difference between the scheduled loads and generated power that are caused by the losses in the network [1].
2. Next is the 33Kv breaker with the following specifica- tions:
Rated kV = 36Kv
Making = 78.7
Rated Amps = 2000A FPC factor = 1.5
AC breaking = 31.5
Model = OX
Manufacturer = Alstom
λA = 0.003 Failure/year
λP = 0.002 Failure/year
µ = 292 Repair/year
MTTF (Mean time to failure) = 200 years
MTTR (Mean time to repair) = 30 hours
Switching time = 30 hours
3. Next is the transmission line which transmits electrici-
ty from the transmission station with its parameters as given below:
Sequence | Resistance R (Ω/km) | Reactance X (Ω/km) |
Positive | 0.00953 | 0.7242 |
Zero | 0.07555 | 0.21753 |
1. After the transmission, is the 33kV bus-bar connected to Yusuf T1 a 33/11kV step down transformer with
the rating:
Primary voltage = 33Kv
Secondary voltage = 11kV Apparent power = 15MVA Maximum MVA = 15MVA
Primary (Full load) Current = 262.4A
IJSER © 2014 http://www.ijser.org
International Journal of Scientific & Engineering Research, Volume 5, Issue 4, April-2014 368
ISSN 2229-5518
As seen from the above the two injection sub stations which take their supply from Ota transmission are Yusuf 33/11KV injection s/s and Abule Iroko 33/11 injection s/s. Inside this substations are feeders which distribute the stepped down voltages to various networks. Under Yusuf injection substa- tion we have:
• Yusuf _11KV_feeder: This feeder feeds the communi- ty called Yusuf. Note that Yusuf injection substation lies within Yusuf community likewise the feeder which feeds the community lies within the substation.
• Agbefa_11KV_feeder: This feeder feeds the Agbefa community or distributes the stepped down voltage to Agbefa community.
We also have the Abule Iroko injection substation and under this substation are:
• Alakuko_11KV_feeder: This feeds Alakuko communi- ty or distributes the stepped down voltage to the Ala- kuko community
• AbuleIroko_11KV_feeder: Just as the Yusuf_11KV_feeder the AbuleIroko_11KV_feeder lies within Abule Iroko community and distributes elec- tricity there.
• Books_11KV_feeder: Finally we have the Books feed- er feeding Books community.
All the above mentioned feeders are modeled in ETAPS as composite networks which when double clicked opens up into a large network of distribution transformers and feeder pillars. A Typical sample model of this composite network is seen in Fig. 10 below and all other feeder pillars follow the same model pattern.
4. Generated Results and Discussion
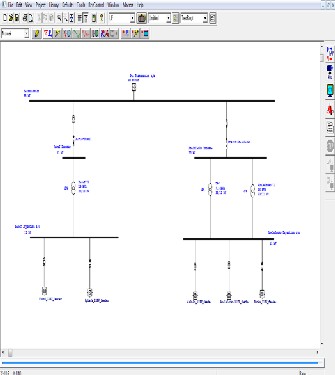
The results of the load flow carried out by using ETAP soft- ware is shown in fig. The simulation displays the flow of real and reactive power in and out of the network, line currents and bus voltages as revealed by the pink colour
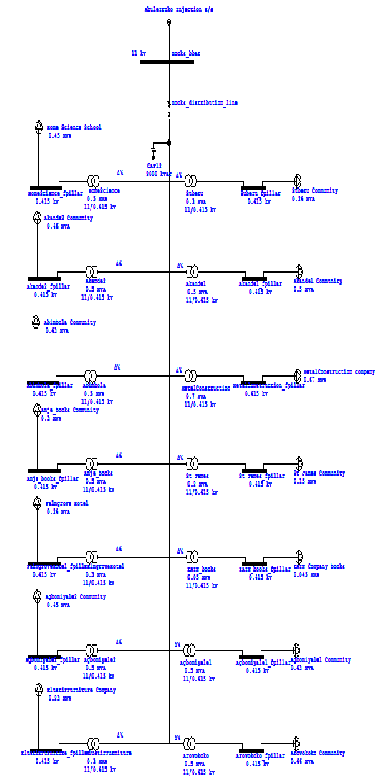
Figure 2: Books_11KV_feeder (A composite network of books community
IJSER © 2014 http://www.ijser.org
International Journal of Scientific & Engineering Research, Volume 5, Issue 4, April-2014 369
ISSN 2229-5518
Figure 3: Modeled distribution network ready for load flow
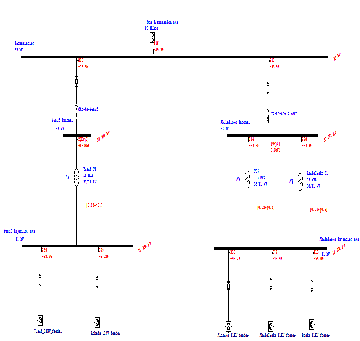
Figure 4: Result of the load flow.
In this research work, the flow of the real and reactive powers in and out of the network was observed and a linear relation- ship between the real and the apparent power of a 3 phase system was established. We also observed the changes in the voltage and current levels on application of a 3-phase fault, and been able to hint that security dispatch operations can be
carried out to avoid the adverse effects of future contingencies via the modeled and simulated network of various feeder.
From the results obtained from the load flow simulation, graphs of the various networks feeder for changes in current, voltage and transformer loading under normal operating con- dition and when the operation is again not normal were plot- ted as shown in the figures below. Also from the graph, the relationships which exist between the plotted parameters were verified for:
• Transformer ratings
• Transformer voltages at normal working condition
• Transformer voltages after fault
• Transformer current at normal working condition
• Transformer current after fault. The graphs that were plotted include
• The transformer rating distribution curve of the net- works.
• The transformer load distribution curve.
• The curve of the comparison between the voltages at normal working condition versus the voltages after fault.
• The curve of the comparison between the current at
normal working condition versus the current after
fault
For the transformer rating and load distribution curve; we
verified the validity of the relationship:
Real power = Apparent power * power factor; which is other-
wise written as:
P(MW) = P(MVA) * cosα, where cosα is the power factor of
PHCN system having its numerical value to be 0.8747.
By determining the line of best fit for the rating we get close to the line of best fit for the transformer loading, the little dis- crepancies resulting from the fact that there were tolerances considered as our initial constraint that you can’t load a trans- former at its maximum rating.
YUSUF FEEDER
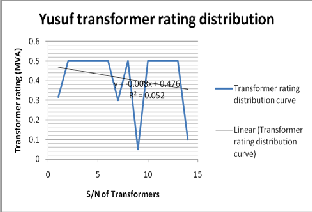
From Fig.5 and Fig. 6 below we see that the rating distribu- tion and the load distribution are linearly related:
IJSER © 2014 http://www.ijser.org
International Journal of Scientific & Engineering Research, Volume 5, Issue 4, April-2014 370
ISSN 2229-5518
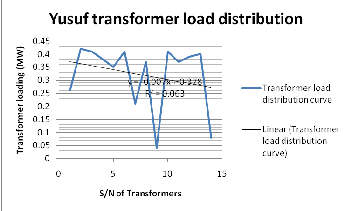
Figure 5: The rating distribution of Yusuf Network 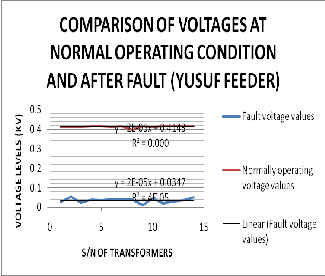
Figure 7: Comparison of voltages before and after fault (Yusuf
Network).
Figure 6: The load distribution of Yusuf Network
From the rating distribution we have the equation of the line of best fit to be:
y = -0.008x + 0.476. (1)
Multiplying this by the power factor which is 0.8747 yields
7 = -0.007x + 0.416 (2)
Which is approximately equal to the equation of the line of best fit for the load distribution—y = -0.007x + 0.378. The dis- crepancy is due to the fact that electrical utilities are not load-
ed at their rated values but at values below [7]. This verifies the linear relationship between the real and apparent power as discussed earlier.
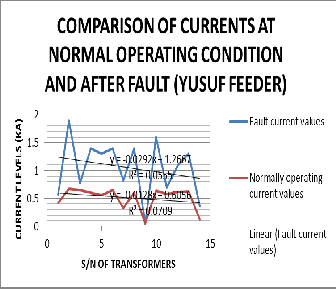
Concerning the fault applied to the 11kV bus-bar at Yusuf in- jection sub-station we observe the network reaction in Fig. 7 and Fig. 8 below:
We know that vrms = VmCos(2πft + αv ) (3) Also irms = Im Cos(2πft + αi ) (4)
Figure 8: Comparison of currents before and after fault (Yusuf
Network)
From the above we have the equation of the line of best fit for both the normal operation and during fault. They are:
y = 0.00002x + 0.4143 (5)
y = 0.00002x + 0.0347 (6)
Since the general equation of a line is y = mx + C where C is the intercept on the (y) axis and the y axis happens to be that of the voltage levels; Then from equation (5) it implies the effective Line-Line voltage as supplied by Yusuf feeder(The feeder that feeds Yusuf community) before fault is 0.4143kV or
414.3 Volts. Also equation (6) implies that the effective (Root
mean square) voltage supplied by Yusuf feeder is 0.0347kV or
IJSER © 2014 http://www.ijser.org
International Journal of Scientific & Engineering Research, Volume 5, Issue 4, April-2014 371
ISSN 2229-5518
34.7V. We note that these values are rms values, hence their peak equivalents are: 585.9Volts and 49.07V. These are their peak values gotten by multiplying their effective voltages by the square root of 2.
The same applies to the current but here during fault [8] the current value bumps up to a value much higher than that of the current supplied by the feeder during normal working condition.
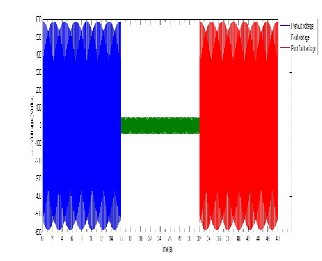
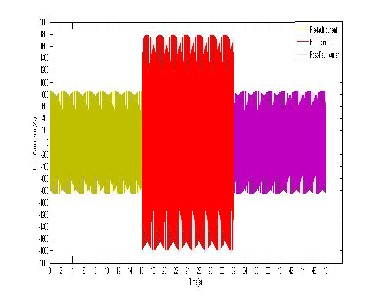
Taking these results to MATLAB, developing an algorithm for the plot we obtain Figure 9 which gives us a clearer picture of how the voltage wave form is both before, during and when the 3-phase fault is cleared.
Figure 10: Yusuf L-L current before during and after fault.
Figure 9: Figure of a Yusuf L-L voltage before during and after fault.
The MATLAB code for developing the algorithm is at the appendix section but in the command window the following commands were entered:
t1 = 0:pi/100:16*pi;
t2 = 16*pi:pi/100:32*pi;
t3 = 32*pi:pi/100:48*pi;
Vprefault = 586.00*cos(2*pi*50*t1); Vfault = 49.09*cos((2*pi*50*t2)-pi); Vpostfault = 586.00*cos(2*pi*50*t3); plot(t1,Vprefault,t2,Vfault,t3,Vpostfault) From equation (4.4)
f = Frequency which is 50Hz for the Nigerian system.
αv = Voltage angle.
Also for the current we have based on Fig. 10 below:
t1 = 0:pi/100:16*pi;
t2 = 16*pi:pi/100:32*pi;
t3 = 32*pi:pi/100:48*pi;
Iprefault = 1791.38*cos(2*pi*50*t1); Ifault = 856.45*cos((2*pi*50*t2)-pi); Ipostfault = 1791.38*cos(2*pi*50*t3); plot(t1,Iprefault,t2,Ifault,t3,Ipostfault) t1 = 0:pi/100:16*pi;
t2 = 16*pi:pi/100:32*pi;
t3 = 32*pi:pi/100:48*pi;
Iprefault = 856.45*cos(2*pi*50*t1);
Ifault = 1791.38*cos((2*pi*50*t2)-pi); Ipostfault = 856.45*cos(2*pi*50*t3); plot(t1,Iprefault,t2,Ifault,t3,Ipostfault)
Hence, for t1, t2, t3 above we say:Cos wave makes one cycle
in 3600 and 3600 = 2π radians since the frequency is 50Hz it
implies the time required to make one complete oscillation is
0.02s which is the inverse of 50Hz. This therefore means that
for every cycle a time of 0.02s elapses. Note the scale on the x axis is 100 to 1 second.
AGBEFA FEEDER
From figures 11, 12, 13 and 14 we observe the rating distribution, load distribution, voltage comparison and current comparison of Agbefa Network.
IJSER © 2014 http://www.ijser.org
International Journal of Scientific & Engineering Research, Volume 5, Issue 4, April-2014 372

ISSN 2229-5518
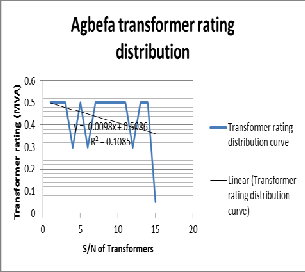
Figure 11: The rating distribution of Agbefa network
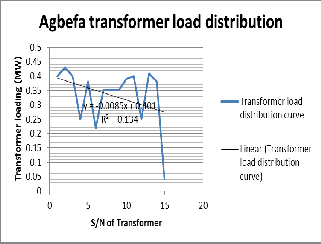
Figure 12: The load distribution of Agbefa network
Figure 14: Comparison of currents before and after fault
(Agbefa Feeder)
Here;
y = -0.00004x + 0.4165 (7)
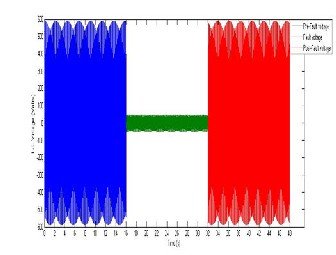
y = -0.00004x + 0.034 (8) From equations (7) and (8) the effective voltages before and during fault are 416.5Volts and 34Volts respectively. Engaging MATLAB command window yields Fig.15 below:
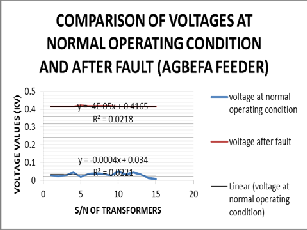
Figure 15: Agbefa L-L voltage before during and after fault.
ig.
Figure 13: Comparison between voltages before and after fault
(Agbefa Network)
t1 = 0:pi/100:16*pi;
t2 = 16*pi:pi/100:32*pi;
t3 = 32*pi:pi/100:48*pi;
Vprefault = 589.02*cos(2*pi*50*t1);
Vfault = 48.08*cos((2*pi*50*t2)-pi); Vpostfault = 589.02*cos(2*pi*50*t3); plot(t1,Vprefault,t2,Vfault,t3,Vpostfault)
For the current here at Agbefa during the 3-phase fault we know from Fig.16 that the effective current values of the
IJSER © 2014 http://www.ijser.org
International Journal of Scientific & Engineering Research, Volume 5, Issue 4, April-2014 373
ISSN 2229-5518
feeder before and at fault are 633A and 1120.5A thus the
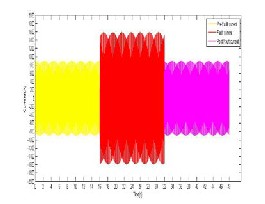
MATLAB plot yields:
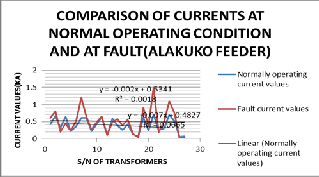
Figure 19: Comparison between voltages before, during and after fault (Alakuko)
Figure 16: Figure of a Agbefa L-L current before during and after fault.
ALAKUKO FEEDER
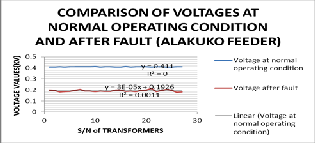
From figures 17, 18, 19 and 20 we observe the rating distribution, load distribution, voltage comparison and current comparison of Alakuko Network.
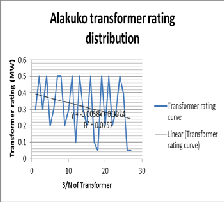
Figure 17: The rating distribution of Alakuko network
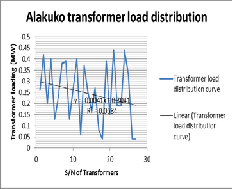
Figure 18: The load distribution of Alakuko network
Figure 20: Comparison between currents before and after fault
(Alakuko Network)
From Figures 17:
y = 0.411 (9)
y = 0.00003x + 0.1926 (10)
From equations 9 and 10 the effective Line-Line voltages before and during fault are 411.0Volts and 192.6Volts respectively. Engaging MATLAB command window yields Fig. 21 below:
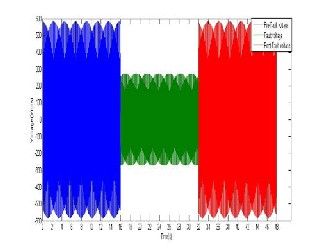
Figure 21: Figure of a Alakuko L-L voltage before during and after fault.
t1 = 0:pi/100:16*pi;
IJSER © 2014 http://www.ijser.org
International Journal of Scientific & Engineering Research, Volume 5, Issue 4, April-2014 374
ISSN 2229-5518
t2 = 16*pi:pi/100:32*pi;
t3 = 32*pi:pi/100:48*pi;
Vprefault = 581.24*cos(2*pi*50*t1); Vfault = 272.38*cos((2*pi*50*t2)-pi); Vpostfault = 581.24*cos(2*pi*50*t3); plot(t1,Vprefault,t2,Vfault,t3,Vpostfault)
For the current here at Alakuko during the 3-phase fault we
know from Fig.22 that the effective current values of the feeder before and at fault are 482.7A and 534.1A thus the MATLAB plot yields:
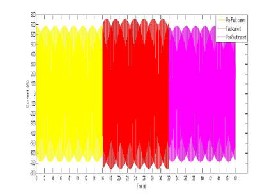
Figure 22: Figure of a Alakuko L-L current before during and after fault.
The commands in MATLAB for the figure above are:
t1 = 0:pi/100:16*pi;
t2 = 16*pi:pi/100:32*pi;
t3 = 32*pi:pi/100:48*pi;
Iprefault = 682.64*cos(2*pi*50*t1);
Ifault = 755.33*cos((2*pi*50*t2)-pi); Ipostfault = 682.64*cos(2*pi*50*t3); plot(t1,Iprefault,t2,Ifault,t3,Ipostfault)
BOOKS FEEDER
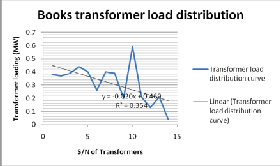
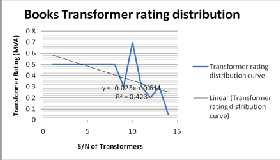
From figures 23, 24, 25 and 26 we observe the rating distribution, load distribution, voltage comparison and current comparison of Agbefa Network.
Figure 24: The load distribution of Books network
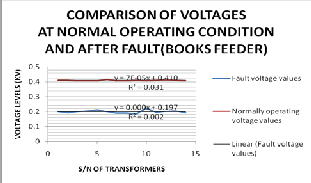
Figure 25: Comparison between voltages before, during and after fault (Books Network)
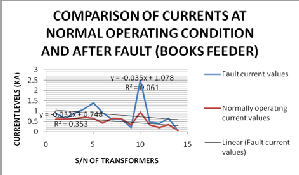
Figure 26: Comparison between currents before and after fault
(Books Network)
From Fig. 27;:
y = 0.00007x + 0.410
y = 0.0000x + 0.197
(11) (12)
Figure 23: The rating distribution of Books network
From equations (11) and (12) the effective Line-Line voltages
before and during fault are 410.0Volts and 197.0Volts respectively. Engaging MATLAB command window yields Fig 46 below:
IJSER © 2014 http://www.ijser.org
International Journal of Scientific & Engineering Research, Volume 5, Issue 4, April-2014 375
ISSN 2229-5518
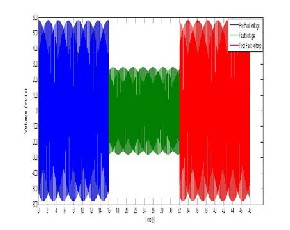
Figure 27: Figure of a Books L-L voltage before during and after fault.
t1 = 0:pi/100:16*pi;
t2 = 16*pi:pi/100:32*pi;
t3 = 32*pi:pi/100:48*pi;
Vprefault = 579.83*cos(2*pi*50*t1);
Vfault = 278.60*cos((2*pi*50*t2)-pi); Vpostfault = 579.83*cos(2*pi*50*t3); plot(t1,Vprefault,t2,Vfault,t3,Vpostfault)
For the current here at Books network during the 3-phase fault we know from Fig. 26 that the effective current values of the feeder before and at fault are 748A and 1078A thus the MATLAB plot yields:
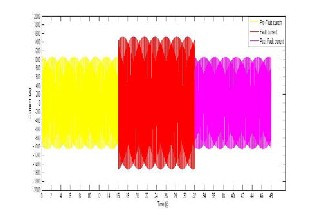
Figure 28: Books L-L current before during and after fault. The commands in MATLAB for the figure above are:
t1 = 0:pi/100:16*pi;
t2 = 16*pi:pi/100:32*pi;
t3 = 32*pi:pi/100:48*pi;
Iprefault = 1057.8*cos(2*pi*50*t1);
Ifault = 1524.5*cos((2*pi*50*t2)-pi);
Ipostfault = 1057.8*cos(2*pi*50*t3);
plot(t1,Iprefault,t2,Ifault,t3,Ipostfault)
ABULE-IROKO FEEDER
From figures 29, 30, 31 and 32 we observe the rating distribution, load distribution, voltage comparison and current comparison of Agbefa Network.
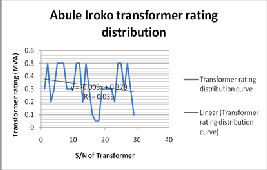
Figure 29: The rating distribution of Abule-Iroko network
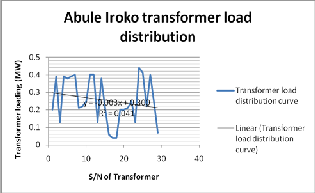
Figure 30: The load distribution of Abule-Iroko network
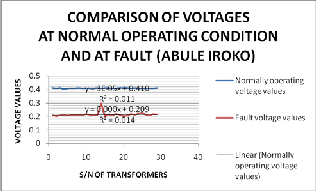
Figure 31: Comparison between voltages before, during and after fault (Abule-Iroko Network)
IJSER © 2014 http://www.ijser.org
International Journal of Scientific & Engineering Research, Volume 5, Issue 4, April-2014 376
ISSN 2229-5518
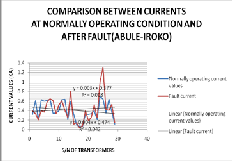
Figure 32: Comparison between currents before and after fault
(Abule-Iroko Network) Here:
y = 0.00003x + 0.410 (13)
y = 0.0000x + 0.209 (14)
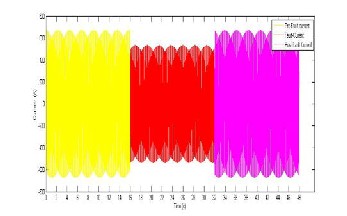
From equations (13) and (14) the effective Line-Line voltages before and during fault are 410.0Volts and 209.0Volts respectively. Engaging MATLAB command window yields Fig. 33 below:
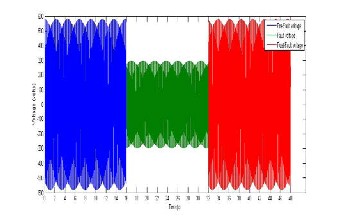
Figure 33: Abule-Iroko L-L voltage before during and after fault.
t1 = 0:pi/100:16*pi;
t2 = 16*pi:pi/100:32*pi;
t3 = 32*pi:pi/100:48*pi;
Vprefault = 579.83*cos(2*pi*50*t1);
Vfault = 295.57*cos((2*pi*50*t2)-pi); Vpostfault = 579.83*cos(2*pi*50*t3); plot(t1,Vprefault,t2,Vfault,t3,Vpostfault)
For the current here at Abule-Iroko network during the 3- phase fault we know from Fig. 32 that the effective current values of the feeder before and at fault are 474A and 377A thus the MATLAB plot yields:
Figure 34: Abule-Iroko L-L current before, during and after fault.
The commands in MATLAB for the figure above are:
t1 = 0:pi/100:16*pi;
t2 = 16*pi:pi/100:32*pi;
t3 = 32*pi:pi/100:48*pi;
Iprefault = 670.34*cos(2*pi*50*t1);
Ifault = 533.16*cos((2*pi*50*t2)-pi); Ipostfault = 670.34*cos(2*pi*50*t3); plot(t1,Iprefault,t2,Ifault,t3,Ipostfault)
Table 1: Abule-Egba Network Simulation Result Comparison
5. Conclusion
From the summarized results shown in table1, it can be con- cluded that modeling and simulation of a distribution grid save cost by procuring strategies to carrying out security dis- patch operation on the grid so as to cater for contingencies in
IJSER © 2014 http://www.ijser.org
International Journal of Scientific & Engineering Research, Volume 5, Issue 4, April-2014 377
ISSN 2229-5518
the electrical grid when they occur. This can be noted via the algorithm used in the research work. This work had focused on the modeling and simulation of Abule-Egba distribution grid through load flow analysis, generates the report on the load flow to observe the relationship between the real and reactive power loadings of each transformer unit of the net- work and analyzed the generated report using the simulation by the plotting of graphs.
This work verified that the linear relationship between
the real and apparent power holds true in the tested distribu- tion grid. The work also provides insight into the behavior of the electrical system of Abule-Egba distribution networks which can aid prediction of the reaction of the electrical sys- tem to a 3-phase fault at the various feeders or busbars consid- ered in the network.
References
[1] H. Sadaat, “Power System Analysis’ Published by McGraw-Hill pub - lishing company limited, New Delhi, 2006
[2] B. R. Gupta, “power System Analysis and Design”, S. Chand, New
Delhi, 2007
[3] D. Das, P. Kaothari and A. Kalam, " Simple and efficient methods for load-flow solution of radial distribution systems.” Electrical power and energy systems, Vol.17, No. 5, pp. 335-346, Oct. 1995
[4] PHCN one-line diagram of Abule-Egba distribution grid showing the interconnected feeders
[5] PHCN Abule-Egba distribution grid components and rated values
[6] M. I. Bhalla, “Preceeding of National Conference on regulation in In frastructure services, New Delhi, India, 2000
[7] IEEE Standards Board, 1997. Approved by American National Stand ard Institute. IEEE Recommended Practice for industrial and comer cial power system analysis (IEEE std 399-1991)
[8] D. Shirmohammad and C. S. Cheng, “ A three-phase power flow method for real time distribution system analysis, IEEE trans. on pow er system, vol.10, No. 2, May 1995.
IJSER © 2014 http://www.ijser.org


