International Journal of Scientific & Engineering Research, Volume 4, Issue 8, August-2013 611
ISSN 2229-5518
A.Valliammai1, , K.Balathanduytham2 , D.Tamilmani3, C.Mayilswami4
Abstract— W ith the increasing use of groundwater for various activities the fast decline in groundwater takes place. In order to prevent the aquifer from fast depletion, the artificial recharge is resorted to. Keeping this in mind to avoid fast decline in groundwater levels in the hard rock regions of Tamil Nadu, a study has been undertaken to identify the favourable areas for artificial recharge and suggest suitable recharge structures to augment the aquifer system. The analysis was carried out in Kinathukadavu block of Coimbatore District, TamilNadu, India using Remote Sensing data and GIS techniques. Initially the source maps namely soil, landuse, geology, geomorphology, lineament and drainage were collected and the thematic layers were prepared. The above maps were prepared using IRS-1C LISS III satellite data and other collateral information collected from the field and digitized. Criterion tables were generated considering the importance of different themes and necessary ranks and weights were assigned to each theme. Using ARC/INFO GIS software, the above themes have been integrated and the areas suitable for artificial recharge have been identified. From the weighted overlay analysis, it was found that the entire watershed comes under the moderate potential recharge zone.Based on this finding the artificial recharge structures were to be identified and implemented to the augment recharge of groundwater.
Index Terms — Geology, Geomorphology, Hydrological soil group, Thematic layer, Weighted overlay
—————————— ——————————
Groundwater is a dynamic and replenishable natural resource, but in hard rock terrains, availability of groundwa- ter is of limited extent. Occurrence of groundwater in such hard rocks is essentially confined to fractured and weathered horizons. As it is the largest available source of fresh water lying beneath the ground it has become crucial not, only for targeting of ground water potential zones, but also monitor- ing & conservation of this important resource. Besides tar- geting of groundwater, to delineate the groundwater re- charge zones is also an important factor for identifying arti- ficial recharge structures (Saraf and Choudhury, 1997).
Remote sensing and GIS are playing a rapidly increas- ing role in the field of hydrology and water resources devel- opment. Remote sensing provides multi-spectral, multi- temporal and multi-sensor data of the earth’s surface (Choudhury, 1999). One of the greatest advantages of using remote sensing data for groundwater investigations and monitoring is its ability to generate information in spatial and temporal domain, which is very crucial for successful analysis, prediction and validation (Saraf, 1999).
---------------------------------------------------------------
Dr.A.Valliammai, Assistant Professor (SWC), Water, Technology Centre, Tamil Nadu Agricultural University, Coimbtore, India. vallimei@gmail.com
Er.K.Balathanduytham, Senior Research Fellow (SWC), Water, Technolo- gy Centre, Tamil Nadu Agricultural University, Coimbtore, India Dr.D.Tamilmani, Professor (SWC), AEC&RI, Tamil Nadu Agricultural University, Coimbtore, India
Dr.C.Mayilswami, Professor (SWC), Water, Technology Centre, Tamil
Nadu Agricultural University, Coimbtore, India
An integrated study covering the aspect of groundwater re- charge is a crucial requirement of the present day (Choudhury,
1999).The present work is an attempt towards this direction.
The study focuses on development of remote sensing and GIS
based analysis and methodology in groundwater recharge studies in hard rock terrains. In order to demonstrate the inte- grated remote sensing and GIS based methodology has been taken.
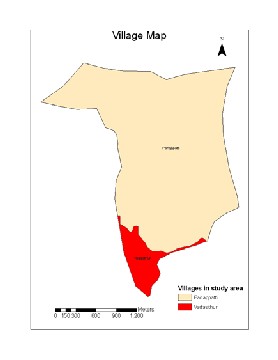
The selected area for study is “Panapatti ” village part of Coimbatore district, Tamilnadu, India with the areal extent of 4.79 sq.km. The study area lies at 100 53’ to 100 54’N latitude and 770 5’ to
770 6’E latitude. (Fig 1).
The study area consists of agricultural land, waste land,
wasteland, water bodies and built-up lands. The landuse/land cover map was derived from IRS, LISS – IV
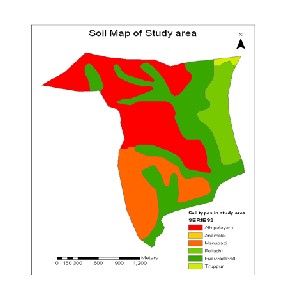
The hydrological soil group ’C’ with slow infiltration and moderate runoff potential and hydrological soil group ’A’ with high infiltration are found in the study area.
The predominant geomorphological features are ped- iment, buried pediment deep, buried pediment shallow and valley floor. Hornblende Biorite Gneiss are the main geologi- cal features that are found in this block.
IJSER © 2013 http://www.ijser.org
International Journal of Scientific & Engineering Research, Volume 4, Issue 8, August-2013 612
ISSN 2229-5518

The spatial data collected and used in the study are, Survey of India (SOI) Toposheet (1:50,000), Village map (1:50,000), Watershed map (1:50,000), Soil map (1:50,000), Ge- ology, Geomorphology & Lineament map (1:50,000) and Landuse/ Land cover map (LISS IV – 2003).
ArcGIS 9.2 software acts as a tool for ground water potential study, which was used for integration, manipulation
& analysis of data. Erdas Imagine 8.7 image processing soft- ware is also used in this study for sub-setting and mosaic pur- pose.
The source maps like village, soil, landuse, geology, geo- morphology & lineament and watershed maps were collected from Institute of Remote Sensing, Anna University, Chennai, Tamil Na- du. Toposheets were obtained from SOI, Guindy, Chenni, Tamil Nadu. The source maps were scanned & geo-referenced using ArcGIS 9.2 software.
The thematic layers of soil, landuse, geology, geomor- phology, & etc., were prepared using ArcGIS 9.2 Software.
The toposheets (1:25,000) were collected from SOI, Guindy, Chennai, Tamil Nadu, India. The contour lines at 10 m interval were extracted from toposheets (200 to 1071). From
the contour lines the DEM was developed using TIN tool in
ArcGIS 9.2. From DEM the slope map (%) was derived.
In order to find out the effective recharge zones, the weighted overlay index (spatial anaysist tool from ArcGIS software) was applied according to the priority of thematic layers in the study area. Hence, the following weightage were assigned according to their influencing characters viz., soil=15, Geo- morphology = 25, Land use = 10, Slope =15, Lineament = 15, Drainage=15, Geology=5. During the weighted overlay analy- sis, the rank was assigned in terms of 1, 2, 3 & 4 for each indi- vidual parameter of thematic layers to obtain the recharge zones in terms of good, moderate, poor & very poor zones. The assigned rank and weightage of thematic layers was pre- sented in Table 1.
The remote sensing and GIS based method is found to be very useful in suitability and analysis for artificial recharge sites in the hard rock terrain The analysis of the thematic maps such as geology, geomorphology, soil, drainage, slope and land use maps were considered to be the best way of iden- tifying the potential groundwater recharge zones in hard rock terrain using ArcGIS 9.2 platform.
Infiltration and runoff are greatly depending on land
use/land cover. It is well known that recharge is high in the cultivable land and irrigated land compared to the wasteland and settlements. Hence, this theme is considered as the one of the principle terrain parameters in the recharge site selection. The land use/land cover map was digitized from already exist- ing land use/land cover map obtained from Institute of Re- mote Sensing, Anna University, Chennai. The IRS 1C LISS III satellite image was used to prepare land use/land cover map. It was then updated according to present condition. The classified map of land use/land cover of study area is presented in Fig. 2 and found that 89 percent of the area covers agricultural land and remaining are built up lands and waste lands.
The infiltration of rainfall depends upon the type and thickness of soil present. Hence, soil is also considered as one of the principle terrain parameters in the groundwater re- charge site selection process. Digitized soil map, obtained from Remote Sensing and GIS Centre, Department of Soil Sci- ence and Agricultural Chemistry, TNAU, Coimbatore, in
1:50,000 scale. This soil map was classified according different
soil series (Fig. 3). There are seventeen soil series found in the
study area. Statistic of different soil series is given in Table 2
IJSER © 2013 http://www.ijser.org
International Journal of Scientific & Engineering Research, Volume 4, Issue 8, August-2013 613
ISSN 2229-5518
Sr. No. | Name of the soil series | Area in percentage |
1. | Anamalai | 16.4 |
2 | Athipalayam | 9.10 |
3 | Dasarapatti | 1.40 |
4 | Ethinaickenpatti | 13.10 |
5 | Habitatio | 0.3 |
6. | Kallivaalsu | 6.9 |
7 | Kanjampatti | 1.6 |
8 | Kattamaptti | 1.1 |
9 | Palathurai | 7.8 |
10 | Palvidithi | 9.9 |
11 | Pichanur | 2.5 |
12 | Pilamedu | 7.5 |
13 | Salaiyur | 15.2 |
14 | Sengalam | 5.0 |
15 | Varapatti | 1.3 |
16 | Miscellaneous | 0.02 |
The predominant geomorphologic features are found to be shallow weathered pedipalin (18.42 km2), Moderately pediplain (2.6 km2), and Pedimant (1.45 km2) respectively (Fig.4). Geomorphology exercises a significant control over groundwater regime. The relief, slope, depth and type of weathered materials and the overall deposition of different land forms play an important role in defining the groundwa- ter regime, more particularly in hard rock areas. The geo- morphic units can be utilized for evaluation and management of groundwater resources.
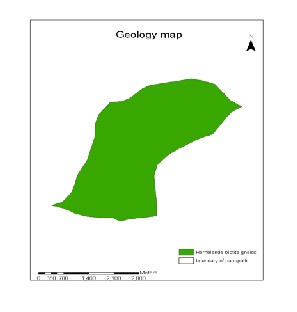
The geology features that are found in the entire
study area are Biotile (Fig 5)
The drainage network tanks were digitized and converted into whole single thematic map. In this region the drainage distri- bution pattern were identified as 1st, 2nd, 3rd order streams. (Fig 6)
The digital representation of the topography is called a Digital Elevation Model. The DEM was prepared by spatial Interpolation of the digitized contour lines using Triangulated Irregular Network (TIN) tool in ArcGIS.
IJSER © 2013 http://www.ijser.org
International Journal of Scientific & Engineering Research, Volume 4, Issue 8, August-2013 614
ISSN 2229-5518
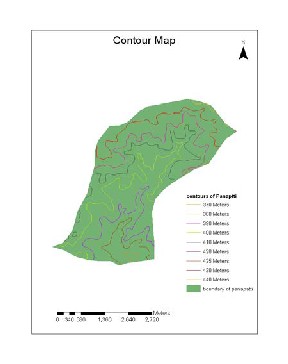
The contour map (10 m contour interval) was ob- tained with the contours range of 370 m to 440m (shown in Fig. 7). From the interpolation of contour lines the DEM was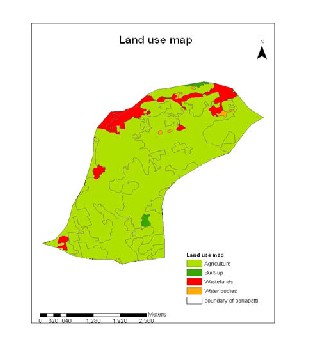
obtained as depicted .The highest elevation shows the terrain of the study area. From the DEM, the slope (%) was derived with the range of 0-5%
Weighted Overlaying Analysis is done by combining the data from the multiple data categories and performing analytical, statistical measurement and other operations on the GIS based
data sets to transform these data into suitable information for a given application. During the process of overlay, the thematic maps and their attributes were intercepted and a new thematic
map with attributes was obtained.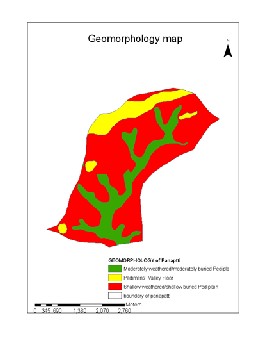
This method is a simple and straightforward method for com- bined analysis of multi class map. In Weighted Overlay Method, the ranks and weights have been assigned to various classes of different themes like geology, geomorphology, land use pattern, soil type, slope and drainage according to its priority and im- portance to support the groundwater recharge. The weightages
IJSER © 2013 http://www.ijser.org
International Journal of Scientific & Engineering Research, Volume 4, Issue 8, August-2013 615
ISSN 2229-5518
of each criterion was finalized on the basis of the ranges of the maximum and minimum values within each theme.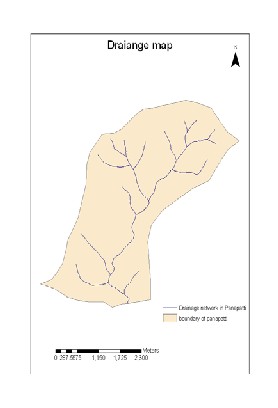
After these weighted overlay analysis the groundwa- ter recharge zones were obtained (Fig.8) in terms of classified zones like good, moderate and poor depending on the poten- tial influencing parameters of ranks and weightages of each thematic layer. From the recharge zone map it was found that the entire area comes under the moderate zone for recharging. The result supports the prevalence of hard rock terrain, which is covering maximum areal extent of 90% of the study area. Based on this finding the artificial recharge structures were to be identified and implemented to the augment recharge of groundwater.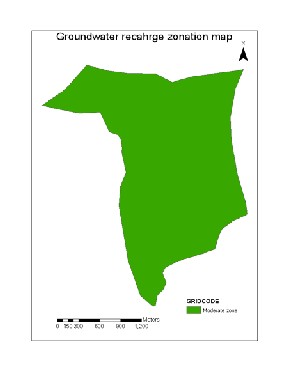
Groundwater is a precious resource of finite extent. With the increasing demands for water due to increasing pop- ulation, urbanization and agricultural expansion, groundwa- ter resources are gaining much attention, particularly in the region of hard rock terrain. Groundwater development pro- grammes need a large volume of data from various sources, time consuming and costly. The integrated remote sensing and geographic information system (GIS) techniques has provided an appropriate platform for convergent analysis of multidisci- plinary data and decision making for artificial recharge of groundwater. The following conclusions are drawn from the above study:
In order to identify the potential recharge zones, vari- ous maps were obtained from different sources and integrated
IJSER © 2013 http://www.ijser.org
International Journal of Scientific & Engineering Research, Volume 4, Issue 8, August-2013 616
ISSN 2229-5518
them into GIS environment for analysis. Thematic maps such as geology, geomorphology, land use/land cover, soil and slope map were prepared using Remote Sensing and GIS. De-
tail characteristics of each theme were studied in accordance with their response to artificial recharge process. After detail study and criteria, ranking and weightage applied for suitable site selection for artificial recharge process, weighted overlay analysis was carried out. Maximum weightage i.e. importance, given to theme, which is most favorable for groundwater re- charge process and low weightage given to theme, which is less favorable for groundwater recharge process. For present study, importance were given in the order of geomorphology
> geology > land use/ land cove >Hydrological soil group >
slope > lineament > drainage. From the recharge zone map it was found that the entire area belongs to moderate zone of recharge.
[1] Choudhury, P. R. 1999. Integrated remote sensing and GIS techniques for groundwater studies in part of Betwa basin, Ph.D. Thesis, Department of Earth Sciences, University of Roorkee, India.
[2} Handbook of Hydrology, 1972. Complied by D.R. Vandersypen, Y.P.
Yadav. Soil Conservation Division. Centre unit for Soil Conser- vation (Hydrology and Sedimentation). Ministry of Agricultur- al, Government of India, New Delhi. Published by Indian Coun- cil of Agricultural Research, New Delhi.
[3] Saraf, A. K. 1999. A report on Landuse Modeling in GIS for Bankura District, Projet sponsored by DST, NRDMS division, Govt. of India.
[4] Saraf, A. K. and Choudhury, P. R., 1997. Integrated Application of Remote
Sensing and GIS Groundwater exploration in hard rock terrain, Pro- ceedings. Int. Symp. on Emerging trends in Hydrology, Department of Hydrology, Roorkee, September 25-27, 1997, Vol. I, 435-442.
[5] Saraf, A.K. and Jain, S.K., 1996. Integrated use of remote sensing and GIS methods for groundwater exploration in parts of Lalitpur District, U.P., International conference on Hydrology and Water
Resources, New Delhi, Dec 20-22, 1993, 251-259.
IJSER © 2013 http://www.ijser.org