International Journal of Scientific & Engineering Research Volume 4, Issue 1, January-2013
ISSN 2229-5518
Hydrochemical characteristic and evaluation of groundwater quality in Wadi As Sab an, western Saudi Arabia
Masoud Eid AL-Ahmadi
Abstract
An attempt has been made for the first time in this area to appreciate the hydrochemical investigation of groundwat er and also to determine the suitability of water for drinking and irrigation purposes. So, to achive this objective a tot al of 41 water samples were collected from hand dug wells locat ed along Wadi As Sab an area and its tributary. Physical and chemical groundwater parameters were determined such as Electrical conductivity(EC) , PH, Total Dissolved Solids (TDS), major ions
(Ca2+, Mg2+, Na+, K+, Cl-, HCO - , SO 2- and NO -). The abundance of the major ions is as follows: Na+ > Ca2+ > Mg2+ > And
3 4 3
Cl- > SO 2- > HCO - > NO -. Groundwat er in the study area is generally hard, fresh to brackish and alkaline in nature.
4 3 3
The dominant hydrochemical facieses of groundwat er are mixed Ca-Mg-Cl and mixed Ca-Cl types in addition to the alkaline earth (Ca2++ Mg2+) exceeds alkalis (Na+ + K+) and strong acid (Cl-+SO 2-) exceeds weak acid (HCO - +CO -).On
4 3 3
the other hand some parameters were calculated in this study such as Sodium Absorption Ratio (SAR), Residual Sodium
Carbonate (RSC), Percent of sodium % and Permeability Index (PI) which were used to det ermine the suitability of groundwater for drinking and irrigation uses.
Key words: Groundwat er quality, Hydrochemical, Wadi As Sab an, Saudi Arabia
1 INTRODUCTION
—————————— • ——————————
Increasing groundwater extraction leads to some
Groundwater is the major source for drinking water where it was estimated that approximately one third of the world’s population used groundwater for drinking [1]. So, groundwater is an important water resource in urban and especially for rural areas in the Kingdom of Saudi Arabia (KSA), which is located in the arid zone belt of the world where the fresh water resources are limited. There are no perennial rivers or surface water, and hence the groundwater is considered as the main water source for drinking, domestic uses and irrigation purposes. The alluvial aquifer depends on direct recharge from rainfall. In western and south western part of the KSA shallow alluvial aquifers and fractured Precambrian basement rocks are available with the most important renewable water resource [ 2].
Wadi As Sab' an is one of the most important wadis in the western part of the KSA to the northeast of Jeddah city. Due to growing population and agricultural expansion has taken place with heavy demand on groundwater resource as a challenging issue in arid region where water resources are limited. Moreover, it is an important agricultural area in the coastal region, which supplies Jeddah and Makkah cities with the requirements of fruits and vegetables.
————————————————
Masoud Eid AL-Ahmadi. Faculty of Earth Sciences, King Abdulaziz University, Associate Professor of Hydrogeology, P.O. BOX 80206, Jeddah, 21589, Saudi Arabia, E-mail: m_al_ahmadi@yahoo.con
serious consequences like water-level decline,
increasing salinity, change in agricultural land and
increasing people migrating to major cities.
There has been a tremendous increase in demand
for groundwater and hence determination of its
quality becomes necessary to assess the utility of this resource. Groundwater in wadi As Sab' an area is the only resource which is used for drinking and irrigation purposes where resident mainly depends on groundwater for their daily life.
In this study the hydrochemical investigation is carried out in wadi As Sab' an area for chemical characteristics determinations for the purpose of groundwater suitability for drinking and irrigation purposes.
2 DESCRIPTION OF THE STUDY AREA Wadi As Sab' an is located in the Rabigh region of western part of the KSA and it is bounded by latitudes 22º 20' and 22º 28' N and longitudes 39º
50' and 40º 05' E (Fig.1). It is about 80 km northeast of Jeddah City. This wadi is considered as part of the scarp-Hijaz Mountains of the Arabian Shield where it extends from north to south parallel to Read Sea.
The Wadi As Sab' an area is characterized by an average elevation of about
1200 m above mean sea level (amsl) in the
mountainous part that is totally made up of
Precambrian basement rocks,
International Journal of Scientific & Engineering Research Volume 4, Issue 1, January-2013
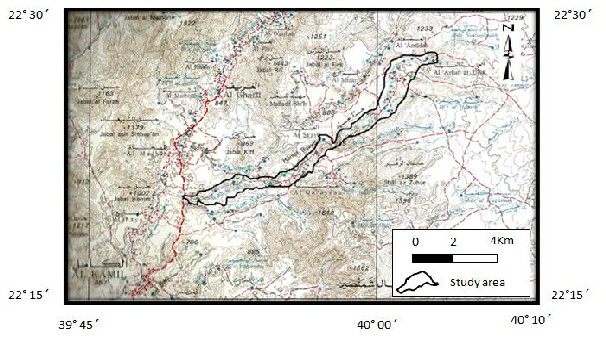
Fig. 1 Location map of study area
whereas the wadi floor is a plain with an elevation varying between 480 and 720m amsl.
The area is characterized by hot summer and mild winter with low rainfall. The air temperature ranges between 40ºC (summer) and
20ºC (winter). The precipitation in western part of
the KSA is characterized by scare and predictable
but by very extensive local storms. Runoff occurs as flash floods associated with heavy short- duration storms. Most of this runoff water is lost by infiltration through highly permeable alluvial deposits filling the wadi channels, where possible recharge of the underlying shallow aquifer can occur; sometimes the floods and flash floods may reach the Red Sea and lost forever [3]. The rainfall in the study area generally increases from the west to east where it is relatively high in the eastern boundaries of the catchment.
Geologically, the study area is a part of South Hijaz region in the Western part of the KSA. This area occupies a sector of the Arabian Shield which is composed of Precambrian igneous and metamorphic rocks [4]. The dominant rock unit in the study area is alkali olive basalts, subordinate alkali intermediate, minor pyroclastics and some feldspathoidal lava which is represented by Hammah formation as a part of Rahat group of Palaeocene to Miocene age. Quaternary sediments fill the Wadi As Sab' an area with the thickness ranging from 3 to 7m in the upstream while in lower part of the wadi it reaches to 16 m. The
alluvial deposits are products of rock weathering which is mainly composed of medium to corse grained gravel along the wadi channels and fine sands and clay in flat area [4].
The bedrocks of the basin are highly weathered and fractured which are ideal places for groundwater storages. In addition the units are intensively faulted and folded.
In this study field measurements are carried out to invested geology and measurements water level in 41 hand dug wells distributed along wadi As Sab' an and its tributes. Groundwater in the study area is available under water table (unconfined aquifer) conditions in the alluvial deposits, weathered and fractured crystalline rocks. The depth of wells in this area reaches 28.5 m. Most of them are large diameter dug wells with diameters ranging between 3 and 5m. Some of the area is covered by agricultural land. Groundwater is discharge from shallow alluvial aquifer where the depth of water table ranges from 3.5m (well
12) to 26m (well 34) below the ground surface. The levels of water table in the study area are between 717 m amsl in the upstream to 470 m amsl in the downstream. The groundwater flows from northeast toward southwest along the wadi direction. The aquifer of this region is recharge by precipitation and from irrigation return waters but the precipitation recharge is predominant. Groundwater is abstracted for domestic and agricultural uses in order to meet the local requirements.
International Journal of Scientific & Engineering Research Volume 4, Issue 1, January-2013
ISSN 2229-5518
3 MATERIALS AND METHODS
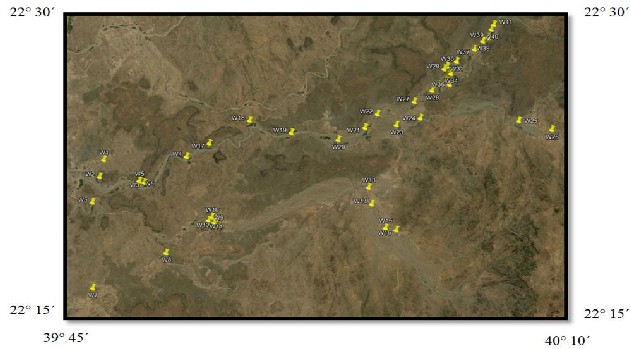
Forty one groundwater samples were collected from different private dug wells, representing the shallow unconfined aquifer. The samples were taken in one liter polyethylene bottles during field study in March 2010. Prior to sampling all the sampling containers were washed and rinsed thoroughly with the groundwater. The locations of sampling sites are shown in Fig. 2. Great care was taken for the spatial distribution of the samples.
Fig. 2 Location map of groundwater samples in the study area
On the other hand, the water samples were taken after intensive pumping of the wells in order to avoid any local contamination or evaporation. The selected wells are used for domestic and agricultural purposes as the only major resource
for the people in the area. All the samples were
analysis for major ions (calcium Ca2+, magnesium
Mg2+, sodium Na+, potassium K+, bicarbonate
- was determined by titration against standard HCl. Cl- was estimated by titration against standard solution of AgNO3. Sulfate (SO42-
) was determined gravimetrically. Ca2+ and Mg2+
were analyzed by compleximetric
titration against standard EDTA solution. Na+ and
K+ were analyzed by flame photometry. NO3
was determined colorimetrically using
spectrophotometric technique [5]. The analytical precision for the measurements of cations and
anions is indicated by the ionic balance error, which was computed on the basis of ions expressed in milliequivalent per liter.
The analytical precision of ions
measurements was determined by calculating the
absolute error in ionic balance, which was found
less than 10% in all samples.
- , sulfate SO
42-
, and chloride Cl-) and some
RESULTS AND DISCUSSIONS
minor ions (nitrate NO3-) using the standard methods [5]. Some physical parameters like
hydrogen ion concentration (pH) and electrical conductivity (EC) were measured in the situ at the time of sample collections using portable EC and pH-meter. Chemical analyses for major and some minor ions were performed at the Laboratory of Faculty of Earth Sciences, King Abdulaziz University, KSA. Total dissolved solids (TDS) were measured by sample evaporation techniques.
4.1 General parameters
The results of the physical and chemical concentration for all groundwater samples are summarized in the study area (see Table 1). The pH values range between 7.12- 8.15 with an average value of 7.48, which elaborates a trend of alkaline chemical reaction within the groundwater system. The EC values in water samples range from 862 to 8820µs/cm with an average2546
µS/cm which shows that about 16 water samples
International Journal of Scientific & Engineering Research Volume 4, Issue 1, January-2013
ISSN 2229-5518
(39%) are marginal waters (500–1500 µS/cm), while the rest (61%) show brackish water type. The highest value (8820µs/cm) was recorded in well no. 9, which is affected by water-rock interaction and soil erosion. The TDS content is usually the main factor, which limits or helps to determine the use of groundwater for any purpose [6]. These TDS values were found to range from
590 mg/l in upstream part to 5330 mg/l in the downstream with an average value of 571.17 mg/l. The wide variation in the values reflects the change in water level, differential weathering and leaching of minerals into groundwater. The increase in salinity can be explained by the chemical reaction that takes place during water- rock interaction, and led to dissolution and precipitation of minerals phases.
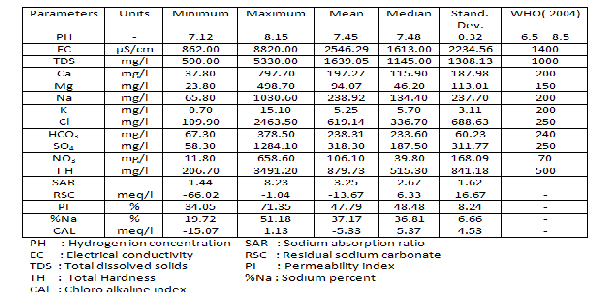
Table 1 Summary Statistics of the hydrochemical variables for the data in the study area
4.2 Cations and Anions chemistry
The major cations and anions make the bulk of groundwater quality. The general dominance of cations was in the order of Na+ > Ca2+ > Mg2+ > K+. Sodium (Na+) is one of the primary natural cation and it is found in the fresh water generally in low concentrations than the other cations (Ca2+ and Mg2+). It is the most dominant constituent in the groundwater in the study area. It was found that the average concentration of Na+ is higher than the concentration of Ca2+ and Mg2+ where the concentration ranges from 65.80 to 1030.60 mg/l. The high values of Na+ is due to weathering of rock forming minerals like sodium plagioclase,
halite and anthropogenic source as domestic and animal wastes [7]. This point is clear as the igneous and metamorphic rocks cover the study area.
Calcium (Ca2+) ion is one of the most
abundant substances found in natural water in
high quantities. It occurs in the rocks with
minerals which contain feldspars, pyroxenes and
amphiboles. In the present study, it has the second dominance. Calcium concentration in the study area varied widely from 37.80 mg/l to 797.70 mg/l with the mean value of 94.49 mg/l.
Magnesium (Mg2+) is the third cation found in the study area groundwater and it ranges from 23.80 mg/l to 498.70 mg/l with the mean of
94.49 mg/l. Generally Mg2+ concentration in
groundwater remains less than Ca2+, but it was found in this study that (17 %) of the samples
show high Mg2+ concentration over Ca2+. The main source of magnesium in the groundwater is due to ions exchange of minerals in the rocks and soils by water.
Potassium (K+) is the cation which is normally found at low concentrations in groundwater [8]. The concentration of K+ in groundwater sample in the study area has very low values and it ranges between 0.7 mg/l to 15.10 mg/l with a mean value of 5.25 mg/l.
International Journal of Scientific & Engineering Research Volume 4, Issue 1, January-2013
ISSN 2229-5518
The general dominance of anions in the groundwater in wadi As Sab' an area appears in
dominant cations and anion, respectively. The
Ca2+, Mg2+, Na+ and K+ concentrations are
the order of Cl- > HCO - > SO
42-
> NO3-.
represented by medians of 37%, 24%, 38% and 1%
Chloride (Cl-) occurs naturally in all types of water, and it is the most common anion in natural water. Its concentration is the most dominant anion in the groundwater in the study area which ranges between 109.90 mg/l and 2463.50 mg/l with an average of 619.14mg/l, and increases from the recharge to discharge area. High concentration values in the groundwater are due to weathering of minerals, fertilizer, septic tanks and cleachatee from landfile [9] Seven wells (1, 7, 9, 10, 11, 13 and
14) have high chloride contents of about 2000.20,
1013.90, 2463.50, 2443.90, 1059.80, 2253.70 and
2384.80 all in mg/l, respectively. These values
seem to be related to anthropogenic local pollution because they are associated with high nitrate concentration of about 380.50, 658.40, 616.50,
644.20, 179.90, 229.80 and 256.30 all in mg/l, respectively.
Bicarbonate (HCO3-) is the second dominant anions found in the water samples in this study which the concentration is found to be ranging between 67.30 mg/l and 378.50 mg/l with a mean of 238.3 mg/l. It is known that the primary source of HCO3- in the groundwater is from dissolution of minerals such as calcite and dolomite.
Sulfate (SO42-) is the third abundant anion in wadi As Sab' an area where the concentration varies between 58.30 mg/l and 1284.10 mg/l with a mean value of 318.30 mg/l. It is considered as one of the major anions which occur in natural waters from oxidation of sulphate ores, presence of shale and solution of gypsum and anhydrite [10].
Nitrate (NO3-) is found in natural waters because of organic sources or from agricultural and industrial chemicals [11]. It is the next cation found in the study area groundwater where the concentration is found to range between 11.80 mg/l and 658.60 mg/l with an average of
106.10mg/l. It is observed that nearly 19 % of groundwater from the study area is exceeding the permissible limit of WHO (2004) standards[12]. High nitrate concentration results due to solid waste from sewage, septic tanks and from
fertilizers which are used for agricultural practice in the study area.
Figure 3 represent the median of cations and anions in the groundwater in wadi As Sab' an area which shows that Na+ and Cl- are the
of all total cations, respectively. The order of relative abundance of major cations in groundwater in wadi As Sab' an area appears as Na+ > Ca2+> Mg2+ > K+. On the other hand, the concentrations of anions Cl- , HCO - , SO 2- and
3 4
NO - is represented by averages of 53% , 21% ,
22% and 4%, respectively, of the total anions. The
order of relative abundance of major anions in the groundwater is as Cl- > SO42- > HCO3- > NO -.
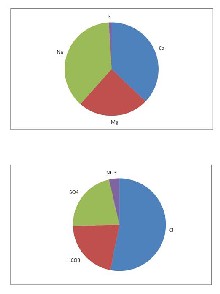
Fig. 3 Pie diagram of Median values of
Major ions(epm)
4.3 Groundwater Processes
The chemical processes study in groundwater helps to understand through plotted X –Y coordinate [13] So, the results of the chemical analyses are used to identify the geological processes and mechanisms in the study area aquifer.
Figure 4A represents plot of the chemical
data as (Ca2+ + Mg2+) versus HCO3- in meq/l. This figure shows that all the data points fall above the line (1:1) which demonstrates an excess of alkalinity in the water that has been balanced by alkalis (Na+ + K+). On the other hand, the plot of (Ca2+ + Mg2+) verses total cations (TC) in figure
4B shows that all points data lie far blew the
International Journal of Scientific & Engineering Research Volume 4, Issue 1, January-2013
ISSN 2229-5518
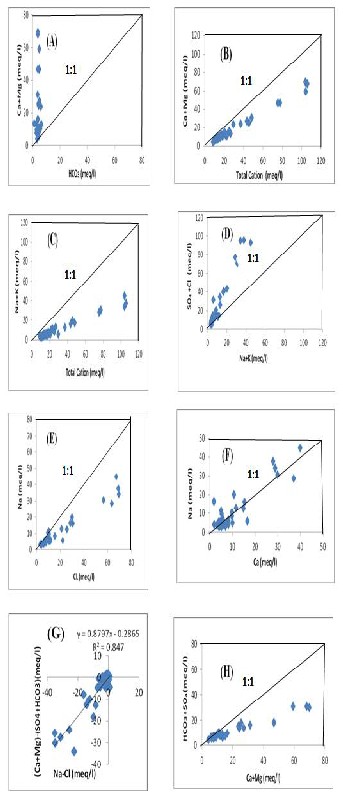
theoretical line (1:1). This gives an indication of alkalis contribution to the major cations due to silicate weathering [14]. Figure 4C shows the plot of Na+ + K+ versus TC where all the samples lie below the line 1:1 suggesting that the cations in the study area groundwater comes from silicate weathering. The plot of (SO42- + HCO -) versus (Na+ + K+) is represents in Figure 4D where it is clear that all the data points fall above the theoretical line 1:1. It shows the increase in alkalis corresponding to a simultaneous increase in Cl- + SO42- which indicates a common source for these ions [15].
Figure 4E displays the concentration of Na+ versus
Cl-, where it is seen that all the samples points lie below and away from the 1:1 line. This gives an indication that a reverse ion exchange could be a minor controlling factor in the chemical evolution in this area. The concentration of Na+ versus Ca2+ is represents by Figure 4F, where it shows the Ca2+/ Na+ ion exchange as increasing content of Ca in the groundwater in this area. Figure 4G shows the relationship between Na+ – Cl- and (Ca2+ + Mg2+ ) – (SO42- + HCO -) with a slope of
0.8797 indicating some level of ion exchange. Graph of (Ca2+ + Mg2+ ) versus (SO42- + HCO3- ) in Figure 4H indicates that all the points fall below the line 1:1 and hence it shows that the deficiency of the ion exchange tendency towards SO42- + HCO - relative to Ca2+ + Mg2+ , therefore, Cl- should balance the excess of Ca2+ + Mg2+ ions.
4.4 Chloro Alkaline index
It is important to understand identification of the chemical reactions between the groundwater and aquifer materials during its movement and time of residence. The chloro-alkaline index (CAI) is suggested by Schoeller [16] and it describes the ion exchange between the groundwater and the water-bearing bed. The index can be expressed as: CAI = [Cl - ( Na + K )] / Cl
where all ionic concentrations are expressed in terms of meq/l.
The values of CAI can be either positive or negative. If the exchange of Na+ and K+ from water with Mg2+ and Ca2+ in the aquifer material the index is positive then it indicates an ion exchange. On the other hand, if the exchange of Ca2+ and Mg2+ of the water is with Na+ and K+ of the aquifer material, then the index is negative which confirms reverse ion exchange.
The values of CAI were calculated for the
groundwater samples in the study using the previous formula as shown in Table 1. The values of CAI shows that 36 samples(88%) of the groundwater samples in the study area has
Fig. 4 Graphs of different parameters
International Journal of Scientific & Engineering Research Volume 4, Issue 1, January-2013
ISSN 2229-5518
Positive values which indicate base-exchange reaction while 5 samples (12 %) have negative value proving the Cation-anion exchange reaction.
4.5 Gibb’s Plots
Gibb’s diagram is widely used to study the relationship of water composition and aquifer lithological characteristics [17] indicating three distinct fields as precipitation dominance, evaporation dominance and rock-water interaction dominance.
Figure 5 shows plot of Gibb’s diagram where it is
clear that the water samples of the study area fall
in the rock-water interaction and evaporation
dominance suggests chemical weathering of rock-
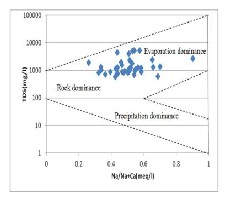
forming minerals and evaporation is the main process that contributes to the ions concentrations in the water.
Fig. 5 Gibbs Diagram of water samples
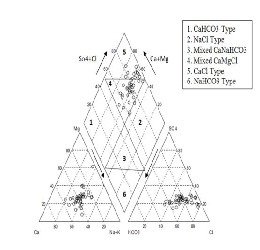
4.6 Hydrochemical Facies
Hydrochemical facies are generally distinct zones that cation and anion concentrations are described within defined composition categories [18]. The facies appears as a function of the lithologic, solution kinetic and flow patterns of the aquifer [19].
Piper diagram [20] is a useful graph, which is used
to explain these facies where the upper part of this
diagram (diamond-shaped) is divided into six
classes as follows: (1) CaHCO3 Type, (2) NaCl Type, (3) Mixed CaNaHCO3, (4) Mixed CaMgCl, (5) CaCl Type and (6) NaHCO3 types. The hydrochemical data of groundwater from study area was plotted on the Piper diagram as in Figure 6 where most of the groundwater samples fall in the field as a mixture of Ca-Mg-Cl and Calcl types. From this figure, it is observed that the alkaline earth (Ca2+ and Mg2+ ) signification exceeds the alkalis (Na+ and K+) and the strong acids (Cl- and SO42-) exceed the weak acid (HCO3- and CO3-). Aquachem software was used for plotting the Piper diagram.
Fig. 6 Hydrochemical classification of groundwater in the study area base on Piper Trilinear diagram
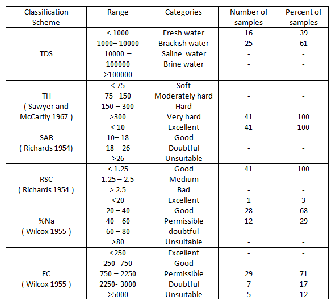
4.7 Drinking and irrigation water quality
The analytical results of water samples have been assessed for drinking suitability and agricultural uses. It is essential to classify the groundwater depending on their hydrochemical properties based on their TDS values [21]; [22]. This is presented in Table 2. It clears from this table and according to WHO (2004) that 39% of the samples is within the permissible limits and the remaining (61%) are exceeding the limits. On the other hand, the classification of groundwater in study area (Table 2) based on the total Hardness [23] shows that all the samples fall in very hard water category. WHO maximum allowable limit of TH for using as drinking water is 500 mg/l. The most desirable limits is 100mg/l. Comparison of the TH results from this area with the maximum limit of WHO shows that 54% of the samples have concentration greater than the maximum allowable limits, and hence, samples cannot be used for domestic purposes.
The assessment of the groundwater
suitability for irrigation purposes needs some
considerations of certain indices which are EC, Sodium adsorption ratio (SAR), Residual sodium carbonate (RSC) and Permeability Index (PI).
Electric conductivity
EC is a very important parameter in classifying water for irrigation purposes. Wilcox [24] classified irrigation waters on the basis of EC into five groups (Table 2). The EC in the groundwater samples in the study area was found to vary from
862 to 8820 µS/cm with an average of 2546.29
µS/cm (Table 1). The variations of EC in this study
shows that 71% of the samples fall on permissible
categories whereas 17% is located on doubtful
categories while the rest (12%) belong to
International Journal of Scientific & Engineering Research Volume 4, Issue 1, January-2013
ISSN 2229-5518
unsuitable categories. On the other hand, water samples falling in doubtful categories can be used if a moderate amount of leaching occurs while the samples which are (12%) cannot be used on soil with restricted drainage (Table 2).
Sodium adsorption ration (SAR)
It is an important factor for determining the
suitability of groundwater for irrigation. This is due to the fact that it measures the effects of alkali/sodium hazard to crops. It can be calculated for the groundwater samples according to the following formula:
According to the classification of water for irrigation by Richards (1954), it is indicated that
100% of the samples have < 1.25 and belong to good category and it is suitable for irrigation (Table 2).
Permeability Index (PI)
It is another parameters which is used for
determining the water for irrigation, and it defined as follows [27]:


(Na+ VHCO3
PI = × 100
(Ca + Mg + Na)

Na
SAR =
j(Ca + Mg)/2
Where all concentrate are in meq/l.
It was found that the SAR ranges between 1.44 and 8.23 with an average 3.25 (see Table 1). According to the classification by Richards [25] the water is excellent for irrigation in this area since none of the samples exceeded the SAR value of 10 (Table 2).
Sodium percent (%Na)
Sodium concentration is also important in
classifying irrigation water because it reacts with
soil, and hence, reduces its permeability. If there is
an excess in concentration of sodium in water, it may produce undesirable effects of Channing soil properties and reducing soil permeability [26]. The sodium percent (%Na) is obtained by using the following equation:
% Na = [( Na + K ) /(Ca + Mg + Na + K )] x 100
Where all the concentrations are expressed in meq/l. The values of sodium percent in the water samples in this area was calculated and found to vary from 19.72% and 51.18% with the average is
37.17 According to Wilcox classification based on
%Na (Table 2) it shows that 3% of samples belong
to excellent category, 68% of them belong to good
category while the remaining sample (29%) belong
to permissible category.
Residual Sodium Carbonate (RSC)
The RSC has been calculated for groundwater
samples in this study in order to determine the
hazardous effects of carbonate and bicarbonate on
the quality of water, which will be used for irrigation purposes:
RSC = (CO3 + HCO3) - (Ca + Mg )
Where all ionic concentration is expressed in meq/l.
The calculated RSC values of groundwater
samples of the study area range from -66.02 to -
1.04 with an average of -13.67 (Table 2).
Where all the ions concentration is expressed in epm.
The PIs of the groundwater is divided into Class I, Class II and Class III types where classes I and II waters are suitable for irrigation with 75% or more of maximum permeability; class III type of waters with 25% maximum permeability [19]. The permeability index has been computed and the values of groundwater samples range from 34% to
71% with an average of 48 % (Table 2), which indicate that the groundwater in the study area can be designated as class II (25-75%) where the groundwater is suitable for irrigation purposes.
Table 2 Classification of groundwater for drinking and irrigation purposes based on TDS, TH, SAR, RSC, %Na and EC.
5 CONCLUSION
Interpretation of hydrochemical analysis reveals that the groundwater in the study area is fresh to brackish, very hard and alkaline in nature. The sequence of the abundance of major ions is in the following order: Na+ > Ca2+ > Mg2+ > K+ and Cl- >
International Journal of Scientific & Engineering Research Volume 4, Issue 1, January-2013
ISSN 2229-5518
SO42- > HCO3- > NO3 . In this area, the dominant hydrochemical facies of groundwater is mixed Ca- Mg-Cl and mixed Ca-Cl types. It was also noticed that alkaline earths (Ca2+ +Mg2+) exceeded alkalis (Na+ + K+) and strong acids (Cl- + SO42-) exceeded the weak acid (HCO3- + CO -). The main processes governing groundwater chemistry in this area are attributed to minerals weathering and dissolution/precipitation processes taking place along weak zone.
Assessment of water samples was done according
to TDS and WHO standards show that most of the
water samples are suitable for drinking. The
suitability of groundwater for irrigation was
evaluated based on quality parameters like: SAR, RSC, EC, %Na and PI classification. The groundwater in the area is found to be good and suitable for irrigation on the bass of SAR, RSC, PI and %Na in all samples, while the EC classification shows that 88% of the water samples are suitable for irrigation but the rest (12%) of samples are not suitable for irrigation however it may be suitable in well-drained soils.
REFERENCES
[1] Nickson, R.T., McArthur, J. M, Shrestha, B ., Kyawnyint, T.O and Lowry, D. (2005) Arsenic and other drinking water quality issues, Muzaffargarh District, Pakistan. Applied Geochemistry, 20(1):55-68.
[2] Al-ahmadi , M.E., El-fiky, A.A. (2009) Hydrogeochemical evaluation of shallow alluvial aquifer of Wadi Marwani, western Saudi Arabia. Journal of King Saud University (Science) (2009) 21, 179–190.
[3] $en, Z. ,(1983) Hydrology of Saudi Arabia, Symposium on Water Resources in Saudi Arabia, Riyadh, P. A68-A94.
[4] Ramsay, C. F. (1986) Geologic Map of the Rabigh Quadrangle, sheet 22D, Deputy Ministry for Mineral Resources, Ministry of Petroleum and Mineral Resources, Jeddah, Saudi Arabia.
[5] American Public Health Association (APHA),
1998. Standard Methods for the Examination
of Water and Wastewater, 20th ed. APHA-
AWWA-WET, Washington, DC.
[6] Nordstrom, P.L., (1987) Groundwater resource of the antlers and Travis peak formations in the outcrop area of North Central Texas.
Texas Water development Board, Report 298. pp280
[7] Deepali Marghade , D. B. Malpe and A. B.
Zade. (2010) Geochemical characterization of
groundwater from northeastern part of
Nagpur urban, Central India. Environ Earth
Sci . DOI 10.1007/s12665-010-0627-y.
[8] Sravanthi K and Sudarshan V ,(1998) Geochemistry of groundwater, Nacharam industrial area, Ranga Reddy district, A. P., India. J. Env. Geochem. 1(2), 81-88.
[9] Loizidou, M., Kapetanios, E.G., (1993) Effect of leachate from landfills on underground water quality. Sci. Total Environ. 128 (1), 69–81.
[10] Prakash , K. L. and Somashekar, R. K. (2006) Groundwater quality - Assessment on Anekal Taluk, Bangalore Urban district, India. Journal of Environmental Biology Vol.
27(4) 633-637.
[11] Feth JH, (1966) Nitrogen compounds in natural water –a review. Water REs. Res.
2(1),41-48.
[12] WHO, (2004) Guidelines for Drinking-Water Quality, vol. 1. Recommendations(3rd). WHO, Geneva
[13] Guler, C., Thyne, G. D., McCray, J. E., & Turner, A. K. (2002) Evaluation of graphical and multivariate statistical methods for classification of water chemistry data. Hydrogeology Journal, 10, 455–474.
[14] Subba Rao, N. (2008) Factors controlling the salinity in groundwater in parts of Guntur district, Andhra Pradesh, India. Environmental Monitoring and Assessment,
138, 327–341.
[15] Datta PS, and Tayagi SK. (1996) Major ion chemistry of groundwater in Delhi area: chemical weathering processes and groundwater flow regime. J. Geol. Soc. India
47(2):179–188.
[16] Schoeller, H. (1977) Geochemistry of groundwater. In: Groundwater studies—an international guide for research and practice. UNESCO, Paris, Ch. 15, 1-18.
International Journal of Scientific & Engineering Research Volume 4, Issue 1, January-2013
ISSN 2229-5518
[17] Gibbs, R J. (1970) Mechanisms controlling world’s water chemistry. Science 170:1088–
1090.
[18] Ophori , D. U. and J. Toth, (1989) Patterns of Groundwater Chemistry, Ross Creek Basin, Alberta, Canada, Groundwater, Vol. 27,, pp.
20-26.
[19] Raju, N., J, Ram, P. and Dey, S. (2009) Groundwater Quality in the lower varuna river basin, Varanasi district, Uttar Pradesh. Journal Geological Society of India, Vol.73, pp 178-192.
[20] Piper, A.M. (1944) A graphic procedure in the geochemical interpretation of water analysis, Union Trans., Jour. Amer. Geophysics, Vol.
25, pp. 914-928
[21] Catroll, D., (1962) Rain water as a chemical agent of geological process: A review. USGS Water Supply, 1533: 18-20.
[22] Freeze, R.A. and Cherry, J.A. (1979) Groundwater. Englewood Cliffs, New Jersy: Prentice-Hall, Inc., 553 p.
[23] Sawyer, G. N., and McCartly, D. L. (1967) Chemistry of sanitary engineers 2nd ed., p.
518. New York: McGraw Hill.
[24] Wilcox, L. V. (1955) Classification and use of irrigation water. Washington: USDA, Circular 969, Wash., U.S. Dept. Agric., DC, p.
19.
[25] Richards, L. A. (1954) Diagnosis and improvement of saline alkali soils: Agriculture, vole 160. Handbook 60. Washington DC: US Department of Agriculture.
[26] KELLEY, W.P. (1951) Alkali soils – their formation properties and reclamation. Reinold Publ. Corp., New York.
[27] Raghunath, H.M. (1987) Groundwater. Wiley
Eastern Ltd., New Delhi, India, pp: 565