International Journal of Scientific & Engineering Research, Volume 4, Issue 6, June-2013 267
ISSN 2229-5518
Sunil P Khadse1 and Satish V Kulkarni2
1Department of Geology, Shri Shivaji Science College, Amravati-444 603.
E- mail: Sunil_khadse@yahoo.com
2Department of Geology, Bharatiya Mahavidyalaya, Amravati-444 605.
E- mail :svk20123@rediffmail.com
Abstract-The assessment of groundwater vulnerability to pollution has been an effective tool for the delineation of protection ones in areas affected by groundwater pollution. In the present study, intrinsic vulnerability and the groundwater pollution risk is assessed for Amravati taluka, Amravati district, Maharashtra using the DRASTIC method. These parameters are imported in a simple linear equation after they have been reduced from the physical range scale to a ten-grade relative scale. The methodology adopted for the evaluation of pollution risk has basic structure of the DRASTIC model, at the same time it incorporated the use of simple statistical techniques for the revision of the factor ratings and weightings of all parameters. The effectiveness of these transformations is based on correlation coefficient of the “aquifer vulnerability” and “nitrates concentration” parameters. Following the above-mentioned modifications, the correlation coefficient between groundwater pollution risk and nitrates concentration was considerably improved to 33% higher than the original method.
Keywords: DRASTIC model, Pollution risk, Intrinsic vulnerability, Amravati taluka.
![]()
Intrinsic vulnerability of an aquifer can be defined as the ease with which a contaminant is introduced into the ground surface and diffuse in groundwater (1Vbra and Zaporozec 1994). It depends on the aquifer characteristics as well as the
geological and hydrological environment. Specific vulnerability is determined by the aquifer intrinsic vulnerability and the contaminant loading that is applied to the specific point of the hydrogeological basin.
The simplest methods of assessing
groundwater vulnerability to pollution are
the rating models. The most widespread method is the DRASTIC method (2Aller et al.1987). It was widely applied all over the world by many scientists (3Evans and Myers 1990; 4Lynch et al. 1997; 5Shukla et al. 2000, 6Zabet 2002). In this paper, DRASTIC method is modified using nitrate concentration as pollution index, on the basis of simple statistical techniques.
The study area, Amravati taluka of Amravati district lies in the north-eastern part of Maharashtra State, covering an area of 898 km2 (Fig. 1). It is bounded by latitude N 20o 45’ to 21o 11’ and longitude
IJSER © 2013 http://www.ijser.org
International Journal of Scientific & Engineering Research, Volume 4, Issue 6, June-2013 268
ISSN 2229-5518
E 77o 35’ to 78o 63’ falling in the Survey of India toposheet No. 55 H/13, 55 H/9,
55G/12, 55G/16 and 55K/4.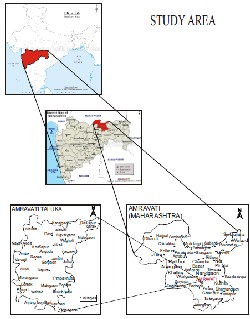
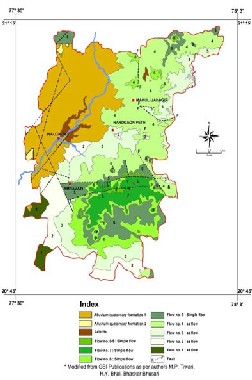
over the Deccan Traps. The detail geology of Amravati taluka has been worked by officers of Geological survey of India (7Kanwar, S.S., Dutta, N.K., Nair, K.K.K., Bhusari, B. 2001, Fig. 2)
Geologically the area is covered by basaltic lava flows of the Deccan Traps belonging to the Upper Cretaceous to Eocene age. The remaining part is underlain by other soft rock formations, particularly the Alluvium, Lameta beds, Gondwana sediments and unclassified metamorphic rocks. The average flow thickness range is 10 to 30 m. About 20% part of the Amravati taluka along the Pedhi basin is occupied by alluvial deposits. The alluvium consists of clay, sand and silts with thickness ranging from 10 to 15 m with a wide aerial extension spread over
184 sq kms. It is of recent age, and lying
From hydrogeological point of view, the main water bearing formations are basaltic lava flows and alluvial formations. Occurrence of ground water in basalt is controlled by degree of weathering, jointing and fracturing while groundwater is generally under unconfined conditions down to depth of 15-20 m. The presence of massive basalt at times gives confining conditions. In alluvium groundwater occurs under phreatic
IJSER © 2013 http://www.ijser.org
International Journal of Scientific & Engineering Research, Volume 4, Issue 6, June-2013 269
ISSN 2229-5518
conditions down to a depth of 80 m., which consist of alternate beds of clayey and sandy soil in younger alluvium. Two to five beds of coarse sand and gravel are encountered within the younger alluvium. The older alluvium consists of clayey soil with one or two thin beds of gravel at the base near the trap basement. In the deeper aquifers, groundwater occurs in confined state.
The spatial variation in depth to water level indicates that water level varies from 2 meter to 16 meter, in general the depth increases on western side of Amravati taluka with few isolated low and high depth in the region. Typically alluvium shows greater depth to water level with less fluctuation. Water level elevation in the taluka varies from 420 amsl in the north to 260 amsl in the south, thus having a groundwater head of 160 meters. Overall direction of groundwater flow is along north to south with a gradient ranging from 11 m/km to 1.9 m/km from north to south end.
The yield of dug wells in basalt varies from varies 5-200 m3/day and depends on extent of fracturing, jointing, massiveness and vesicular nature of basalt with weathered zone at top. In alluvium the yield ranges from 40-300 m3/day depending upon the presence of sand, silt
and clay zones.
Intrinsic vulnerability is assessed using the DRASTIC method which considers seven parameters like depth to groundwater, recharge, aquifer type, soil type, topography, impact of the vadose zone, hydraulic conductivity. These parameters are related by simple linear equation and latter reduced to a ten-grade relative scale as follows:
V(intrin) = D · λD + R · λR + A · λA +
S · λS + T · λT + I · λI + C · λC ----------
where V(intrin) is the intrinsic vulnerability, D is the depth to groundwater, R is the recharge, A is the aquifer type, S is the soil type, T is the topography, I is the impact of the vadose zone, C is the hydraulic conductivity and λ is the weighting coefficient for each factor.
The major drawback of this method is the subjectivity of the determination of the rating scale and the weighting coefficients (1Vbra and Zaporozec 1994,
8Jaipurkar 2009). In the present study,
maintaining the basic structure of the DRASTIC model attempt has been made to improve the evaluation of pollution risk for Amravati taluka.
In DRASTIC intrinsic vulnerability scores and nitrate concentrations (mg/l)
IJSER © 2013 http://www.ijser.org
International Journal of Scientific & Engineering Research, Volume 4, Issue 6, June-2013 270
ISSN 2229-5518
coincidence of the high nitrates with high vulnerability values have been noted but indicate that DRASTIC method over- estimates the vulnerability values in the alluvial aquifer of the study area. Therefore concentration of nitrates and vulnerability was plotted on normal probability scale it gave a non linear relation (Fig. 3a) but when logarithmic transformation of the same was plotted (Fig. 3b), it showed log linear relation. Hence, a modification in the methodology was required using logarithmic transformation rather than normal concentration values.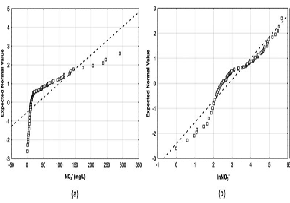
A revision of the rating scales for continuous parameters was done by taking mean of every class of parameter defined in the initial model. Modified rating values were derived using the mean nitrates concentration of each class reduced to a
ten-grade scale. After revision of the rating
scales, the modified DRASTIC model increases the correlation coefficient with nitrates concentration to the value r = 0.68 (Fig. 4).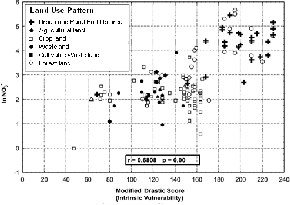
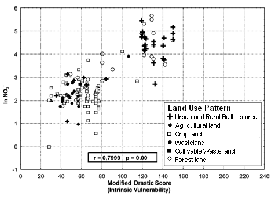
This revision of weighting factors is based on correlation of each parameter with the nitrates concentration. Based on correlation coefficient calculated by Spearman’s rho and Kendall’s tau
IJSER © 2013 http://www.ijser.org
International Journal of Scientific & Engineering Research, Volume 4, Issue 6, June-2013 271
ISSN 2229-5518
(9Kendall 1975) their values reduced to maximum of 5, as defined by the DRASTIC model and new weighting factors were calculated and shown in table
1. Correlation coefficients values and the revised weighting factors are represented in table 2. (Fig. 5).
“Soil type” and “hydraulic conductivity” parameters are not statistically significant and hence excluded. It also indicates that largest modified weighting factor is to “aquifer type”, while “depth to groundwater” and “impact of the vadose zone” are degraded with respect to initials ones. The insignificant correlation between “nitrate concentration” and “soil type” indicates that the topsoil does not influence the nitrates concentration of the groundwater
in the study area (10Lambrakis et al. 2004).
Thus, after the application of the revised weighting factors and the removal of the two non-correlated parameters, Eq. (1) can be formulated as follows: V(intrinsic) = 3 · D + R + 5 · A + 2 · T +
With the application of the above equation, the correlation between vulnerability and nitrates concentration values is further increased to r = 0.79 (Fig. 5). The final original scores and modified scores and weightings are give in table 3.
The DRASTIC method, gives relatively satisfactory results in the evaluation of groundwater intrinsic vulnerability to pollution, but cannot be used for the accurate assessment of the groundwater pollution risk. The DRASTIC method was employed with some modifications upon the factor ratings and weightings, following an optimization procedure using nitrates concentration data. The optimization can be easily achieved using some simple statistical parameters on existing data. Factors such as hydraulic conductivity and soil type do not seem to be related to the nitrates concentration while evaluating vulnerability using DRASTIC methodology.
IJSER © 2013 http://www.ijser.org
International Journal of Scientific & Engineering Research, Volume 4, Issue 6, June-2013 272
ISSN 2229-5518
Original and Modified Drastic Scores and their Correlation coefficients with Nitrate
Drastic Factors | Original Weight | Spearman’s rho coefficient | Kendall’s tau coefficient | Modifed factor weight |
Depth to groundwater | 5 | 0.46 | 0.37 | 3 |
Recharge | 4 | 0.14 | 0.12 | 1 |
Aquifer type | 3 | 0.74 | 0.61 | 5 |
Soil type | 2 | 0.11 | 0.08 | - |
Topography | 1 | 0.29 | 0.22 | 2 |
Impact of Vadose zone | 5 | 0.34 | 0.28 | 2.5 |
Hydraulic conductivity | 3 | -0.01 | -0.01 | - |
Correlation coefficients for the original DRASTIC and the various modified models and corresponding correlation improvement.
Vulnerability model definition | Pearson’s correlation factor | Step correlation improvement (%) | Overall correlation improvement (%) |
V intrinsic (Original DRASTIC modela) | 0.5059 | - | - |
V intrinsic (DRASTIC model, modified factor ratings) | 0.6808 | 17.49 | 17.49 |
V intrinsic (DRASTIC model, modified factor ratings and factor weights) | 0.7999 | 11.91 | 29.4 |
IJSER © 2013 http://www.ijser.org
International Journal of Scientific & Engineering Research, Volume 4, Issue 6, June-2013 273
ISSN 2229-5518

Original and Modified ratings of the seven DRASTIC parameters.
a. Depth to groundwater in m. b. Recharge c. Aquifer Media d. Soil Type
Rang e (m)
Origi nal Ratin g
Mean Nitrate (Mg/lit)
Modif ied rating
Rang e (mm)
Origin al Rating
Mean Nitrate (Mg/lit)
Modif ied rating
Aquifer type
Origin al
Rating
Mean Nitrate (Mg/lit)
Modif ied rating
Soil type
Original
Rating
Mean Nitrate (Mg/lit)
Modified rating
0 - 3 10 -- 0-50 1 7.54 1.8 Younger
Alluvium
7 20.25 4.2 Sandy loam 6 28.89 5
3 - 5 8 70.54 10 50-
100
3 -- -- Older
Alluvium
Highly
8 26.43 3.9 Sandy clay 5 14.28 2.4
5 - 8 5 60.62 7.9 100-
180
6 20.29 6
weathered
& fractured basalt Partially
9 76.56 10 Loam 5 20.62 3.4
8 -12 | 3 | 35.25 | 4.4 | 180- 8 250 | -- | -- | weathered 3 basalt | 14.02 | 1.6 | Sandy clay 4 loam | 22.28 | 3.6 |
12- 15 | 2 | 24.64 | 3.2 | Abov e 250 9 | 36.53 | 10 | Inter flow zones 5 | 18.26 | 2.1 | Clayey loam 3 | 56.64 | 10 |
abov e 15 | 1 | 14.88 | -- | Clay 1 | 18.60 | 2 |
e. Topography (Slope) | f. Impact of Vadose Zone | g. Hydraulic Conductivity | ||||||||||
Range Slope % | Original Rating | Mean Nitrate (Mg/lit) | Modified rating | Geological formations | Original Rating | Mean Nitrate (Mg/lit) | Modified rating | Range (m/day) | Original Rating | Mean Nitrate (Mg/lit) | Modifie d rating | |
0-2 % | 10 | 59.82 | 10 | Alluvial with Silt / clay | 6 | 24.28 | 4.4 | 0.005-0.5 | 1 | 8.68 | 2.3 | |
2-6% | 09 | 29.82 | 5.6 | Alluvial with Sand and gravel | 9 | 32.28 | 9.4 | 0.5-1.5 | 2 | -- | -- | |
6-12% | 05 | 15.56 | 3.2 | weathered and fractured basalt | 8 | 52.45 | 10 | 1.5-3.5 | 4 | -- | -- | |
12-18% | 03 | 9.56 | 1.9 | Poorly fractured basalt | 4 | 12.04 | 2.5 | 3.5-5 | 6 | 26.54 | 7.6 | |
above 18% | 01 | -- | -- | 5-10 | 8 | -- | -- | |||||
ABOVE 10 | 10 | 38.46 | 10 |
![]()
IJSER © 2013 http://www.ijser.org
International Journal of Scientific & Engineering Research, Volume 4, Issue 6, June-2013 274
ISSN 2229-5518
[1] Vrba J, Zaporozec A., “Guidebook on mapping groundwater vulnerability”, International Association of Hydrogeologists. International contributions to hydrogeology, vol. 16, Heise, Hannover, 1994.
[2] Aller L, Bennett T, Lehr JH, Petty RJ, Hackett G : “DRASTIC: a standardized system for evaluating ground water pollution potential using hydrogeologic settings”. EPA-600/2-87-035, 1987. EPA, Washington, DC.
[3] Evans BM, Myers WL: “A CIS-based approach to evaluating regional groundwater pollution potential with DRASTIC”. J Soil Water Conserv. March-April:
242–245, 1990.
[4] Lynch SD, Reynders AG, Schulze RE., “A DRASTIC approach to ground water vulnerability in South Africa”, S African J Sci 93(2):59–60, 1997.
[5] Shukla S, Mostaghimi S, Shanholt VO, Collins MC, Ross BB, “A county-level assessment of ground water contamination by pesticides”, Ground Water Monitor Rev
20(1):104–119, 2000.
[6] Zabet TA , “ Evaluation of aquifer vulnerability to contamination potential using the DRASTIC method”, Environ Geol 43:203–208, 2002.
[7] Kanwar SS., Dutta NK., Nair KKK. and Bhusari B.: District Resource Map, Amravati, Geological Survey of India, Nagpur, 2001.
[8] Jaipurkar, R.J.: “Geo-environmental and geotechnical investigations in Amravati taluka, Amravati District, Maharashtra”, Unpublished Ph.D. thesis submitted to SGB Amravati University, Amravati, pp. 275, 2009.
[9] Kendall MG: Rank correlation methods, 4th edn., Griffin, London, 1975.
[10] Lambrakis N, Antonakos A, Panagopoulos G, “The use of multicomponent statistical analysis in hydrogeological environmental research”. Water Research
38:1862–1872, 2004.
IJSER © 2013 http://www.ijser.org