International Journal of Scientific & Engineering Research, Volume 3, Issue 9, September-2012 1
ISSN 2229-5518
Rajiv Tawde, C.S. Rawat
Abstract—Phase unwrapping has always been a major concern in the field of image processing .In this paper,images having wrapped phase are unwrapped using the graph cut method . The case of eight neighbouring pixel pairs has been considered .Considering more neighbouring pixel pairs helps to get good unwrapped output because every step of unwrapping uses the adjoining pixels as its reference.The unwrapping of the wrapped image is done to make the data available for numerous applications.
Index Terms— Wrapped phase, interferometry, graph cuts, unwrapped phase, neighbouring pixels,interferometry,InSAR.
T
—————————— ——————————
principle of interferometry which makes use of the concept of
here are many applications that produce wrapped phase
images. Examples of these are magnetic resonance imaging
(MRI), synthetic aperture radar (SAR) and fringe pattern anal-
ysis. The wrapped phase images that are produced by these
applications are not usable unless they are first unwrapped so
as to form a continuous phase map. Phase unwrapping is a
basic problem in signal processing. Different methods to
achieve unlocked outputs from locked inputs have been dis-
cussed in [3] and [4]. They can be subdivided into several dif-
ferent categories, viz. network flow, branch-cut, minimum
norm methods as explained in [5],[6],[7]. Phase unwrapping is
the process of recovering the original image from the wrapped
image. Medical, military and industrial applications require the extraction of the unwrapped phase image from the wrapped image. The phase which is obtained has phase jumps, which results in the formation of the wrapped phase.
This wrapped phase is unusable until the phase discontinui- ties are removed. [1][2]Phase unwrapping is the reconstruc- tion of a function on a grid by recovering the image from its wrapped state. We will refer to these two functions as the un- wrapped and wrapped phases, respectively. Various problems such as discontinuities in phase, inadequate sampling rate, etc. affect the unwrapping process. In least-squares methods, un- wrapping is achieved by minimizing the mean square devia- tion between the estimated and unknown discrete derivatives of the unwrapped phase. Least-squares methods are very effi- cient computationally when they make use of fast Fourier transform (FFT) techniques.
An interferometer is an instrument designed to produce opti- cal interference fringes for measuring wavelengths, testing flat surfaces, measuring small distances, etc. Fig. 1 explains the
————————————————
![]() C.S.Rawat is pursuing Phd in ECE Dept.,NIT Rourkela,E-
C.S.Rawat is pursuing Phd in ECE Dept.,NIT Rourkela,E-
mailchandansrawat@gmail.com
superposition to combine or separate waves in a way that will
cause the result of their combination to have some meaningful
property that is diagnostic of the original state of the waves.
This works because when two waves with the same frequency
combine, the resulting pattern is determined by the phase dif-
ference between the two waves—waves that are in phase will
undergo constructive interference while waves that are out of
phase will undergo destructive interference.
Most interferometers use light or some other form of elec- tromagnetic wave. Idealized interferometry involves determi- nation of wavelength obtained by looking at interference fringes between two coherent beams recombined after travel- ling different distances. [3] Typically a single incoming beam of coherent light will be split into two identical beams by a grating or a partial mirror. Each of these beams will travel a different route, called a path, until they are recombined before arriving at a detector. The path difference in the distance tra- velled by each beam creates a phase difference between them. It is this introduced phase difference that creates the interfe- rence pattern between the initially identical waves. If a single beam has been split along two paths then the phase difference is diagnostic of anything that changes the phase along the paths. This could be a physical change in the path length itself or a change in the refractive index along the path [4][5]. In the past, astronomical interferometry used a single baseline to measure the amount of power on a particular small angular scale. Later astronomical interferometers which were used included arrays of telescopes. Interferometry techniques can be used to measure vibrational modes of solid bodies as well as the shape, flatness of optical surfaces, shifts in ground posi- tion or tilt which may indicate long term continental drift, shift in position of large suspended masses in the search for gravi- tational waves. Very long base-line interferometry can even be applied at cosmic distances.
Aerial photography is in use since several years to acquire data for the production of topographic maps. The efficiency of data collected is affected due to clouds and poor sunlight con- ditions. The problem is of particularly serious proportions in the cloud belt region within 15' of the equator and near the poles.
IJSER © 2012
The research paper published by IJSER journal is about Graph Cuts Based Phase Unwrapping 2
ISSN 2229-5518
The use of fine resolution radar systems has eliminated this problem, enabling efficient scheduling of flight operations, regardless poor weather conditions.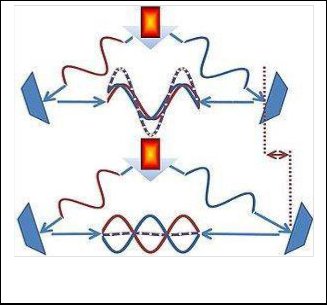
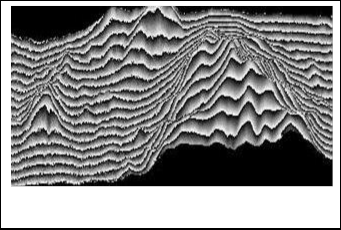
Fig. 2. Wrapped phase image obtained from a simulated InSAR [8]
Fig. 1. Principle of interferometry[12]
SAR interferometric techniques fuse complex images captured by several antennas or at different instants to form interfero- grams . There are certain challenges in producing high resolu- tion topographic images. This is overcome by a variety of im- aging systems by using coherent radiation to illuminate ob- jects. The scattered field returned back to the sensor carries information about the physical and geometrical properties of the imaged objects.
[6] Path following algorithms apply line integration schemes over the wrapped phase image, and basically rely on the assumption that Itoh condition holds along the integration path. Wherever this condition fails, different integration paths may lead to different unwrapped phase values. Path following methods directly apply the concept introduced in the Itoh al- gorithm, of discrete phase integration along a path. Given a starting pixel, for which the absolute phase is known, Itoh method prescribes on how to compute the absolute phase. The Bayesian approach relies on a data-observation mechanism model, as well as a prior knowledge of the phase to be mod- elled.
A wrapped phase image obtained from a simulated InSAR is shown in Fig.2. Images like in Fig.2 do not display much in- formation when seen directly by human eyes. But, such im- ages of geographical locations or physical structures convey a lot of information when processed.
2 PHASE UNWRAPPING BY THE USE OF GRAPH CUTS.
Fig.3 shows a graph cut method which shows a graph where there is a one-to-one correspondence between all the nodes. With such a graph, we can find a minimum cut of the graph. Fig.3 shows the structure of the graph in which first vertices are built and then the edges corresponding to each pair of ad- joining pixels, and then those graphs are joined together .
Fig.4 shows the concept of graph cuts in which a cut is a partition of the vertices of a graph into two disjoint subsets. The cut-set of the cut is the set of edges whose end points are in different subsets of the partition. Edges are said to be crossing the cut if they are in its cut-set.
The size or weight of a cut is the number of edges crossing the cut. In a weighted graph , the same term is defined by the sum of the weights of the edges crossing the cut. In a flow network, an s-t cut is a cut that requires the source and the sink to be in different subsets, and its cut-set only consists of edges going from the source's side to the sink's side .[10]
The image with the wrapped phase is taken into considera- tion. Construct the initial graph and combine it with the main graph. First the initial elements of the map for every horizon- tal and vertical pairs of pixel are categorized depending on whether they belong to the starting bank or the destination bank . Both banks contain pixels in the form (i,j) . If a particu- lar pair of pixels belongs to the starting bank (source), then we proceed further and finally stop when all the pixels belonging to that bank get exhausted. Similar procedure is followed at the other end. Based on this, the phase unwrapping is done using graph cut .[12]
IJSER © 2012
The research paper published by IJSER journal is about Graph Cuts Based Phase Unwrapping 3
ISSN 2229-5518
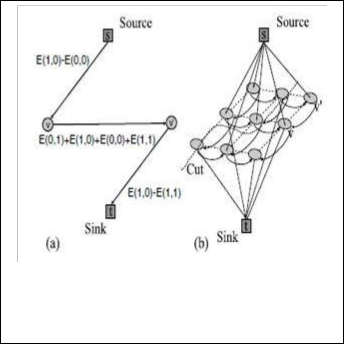
Fig. 5. (a) A directed graph. (b)A cut on the directed graph [9]
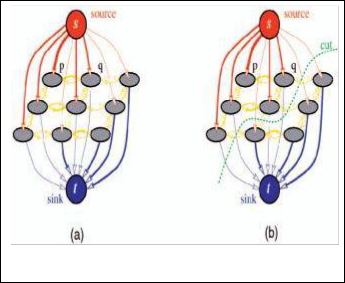
Fig. 3. (a) Elementary graph , where s and t represent source and sink, respectively, and v and v′ represent the two pixels involved in the energy term. In this case E(1, 0)−E(0, 0) > 0 and E(1, 0)−E(1, 1)
>0. (b) The graph obtained at the end results from adding elemen-
tary graphs [8]
3 SIMULATION
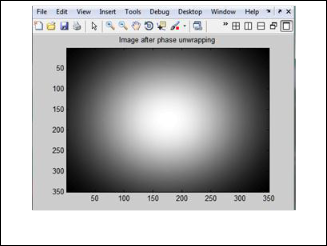
All simulations have been done using MATLAB R2010a on a computer equipped with a 2.13 GHz Intel® Core™ i3 CPU. Fig.6 shows an image having phase wrap. Fig.7 shows an im- age with unwrapped phase using the graph cut method.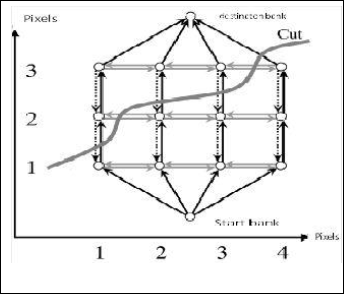
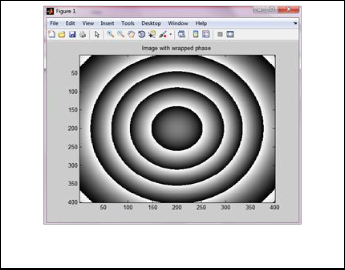
Fig. 4. The concept of graph cuts. [11] Fig. 6. Image having wrapped phase.
In Fig.5, edge costs are reflected by their thickness. Consider a matrix consisting of pixels.Every pixel has its neighbours . Graph cut solutions for two or less neighbouring pixels have been obtained in the past. We have considered the case of eight neighbouring pixels.
The output obtained in Fig.7 has been plotted as a three di- mensional plot .The three dimensional plot of the image with the phase being unwrapped is shown in Fig.8.
Fig.9 shows a difference image which reveals the difference between the original image which had phase wraps and the final output which was recovered from the phase wraps.
IJSER © 2012
The research paper published by IJSER journal is about Graph Cuts Based Phase Unwrapping 4
ISSN 2229-5518
Phase unwrapping using graph cuts gives unwrapped phase image which can be useful for vaious applications such as medical,military,geo-studies and many more fields.The method of phase unwrapping using this tech- nique gives a good result as the discontinuities in the phase can be overcome as smaller sections of the image are individually considered. The difference image clearly shows the eliminated error and explains that the original image with the unwanted phase wraps has been processed successfully to obtain the image without the phase wraps.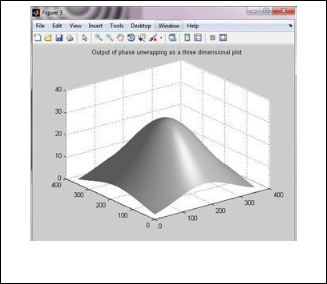
Fig. 7. Image with unwrapped phase
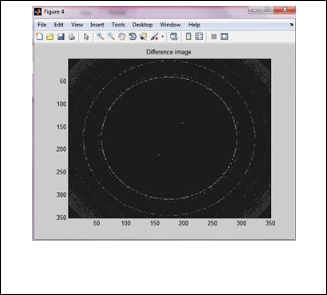
Fig. 8. Image which is phase unwrapped plotted as a three di- mensional view.
[1] K. Itoh, ―Analysis of the phase unwrapping problem,‖ Applied Op- tics, Vol. 21, No. 14, p. 2470, July 15, 1982.
[2] http://hal.inria.fr/docs/00/07/20/67/PDF/RR-4521.pdf
[3] D. C. Ghiglia and M. D. Pritt, Two-Dimensional Phase Unwrapping; Theory, Algorithms and Software. New York: Wiley, 1998.
[4] D. W. Robinson, ―Phase unwrapping methods,‖ in Interferogram Analysis; Digital Fringe Pattern Measurement Techniques, D. W. Robinson and G. T. Reid, Eds. Philadelphia, PA: Inst. Physics, 1993, pp. 194–228.
[5] C.W. Chen and H. A. Zebker, ―Network approaches to two - dimensional phase unwrapping: Intractability and two new algo- rithms,‖ J. Opt. Soc. Amer. A, vol. 17, pp. 401–414, 2000.
[6] M. Costantini, ―A phase unwrapping method based on network
programming,‖ in ESA Workshop on Applications of ERS SAR Inter- ferometry, Zurich, 1996. [Online].Available. http://www.geo.unizh.ch/rsl/fringe96/papers/costantini/.
[7] T. J. Flynn, ―Two-dimensional phase unwrapping with minimum
weighted discontinuity,‖ J. Opt. Soc. Amer. A, vol. 14, pp. 2692–
2701,1997.
[8] Jos´e Bioucas-Dias and Gonc¸alo Valad˜ao, Phase Unwrapping via
Graph Cuts, March 2007
[9] Yuri Boykov,An Experimental Comparison of Min-Cut/Max-Flow Algorithms for Energy Minimization in Vision, IEEE transactions on pattern analysis and machine intelligence, vol. 26, no. 9, September
2004
[10] V. Kolmogorov and R. Zabih, ―What energy functions can be mini- mized via graph cuts,‖ IEEE Transactions on Pattern Analysis and MachineIntelligence, vol. 26, no. 2, pp. 147–159, February 2004.
[11] Hiroshi Ishikawa, IEEE transactions on Pattern Analysis and ma- chine intelligence, vol. 25, no. 10, October 2003
[12] Jos´e M. Bioucas-Dias and Gonc¸alo Valadao, Phase unwrapping: a new max-flow/min-cut based approach, 0-7803-9134 9/05/$20.00
©2005 IEEE
[13] http://en.wikipedia.org/wiki/Interferometry
Fig. 9. Difference between the image having the wrapped phase
& the unwrapped phase.
IJSER © 2012