International Journal of Scientific & Engineering Research, Volume 5, Issue 6, June-2014 863
ISSN 2229-5518
Geotechnical Evaluation of the Escravos Beach Ridge for Onshore Pipeline Route Design, Western Niger Delta, Nigeria
Abam, T.K.S. and Ngah, S.A.
Abstract: This study evaluates the sub-soil geotechnical characteristics and ground conditions prior to excavation and placement of pipeline requirement for the feasibility of the pipeline network at the onshore pipeline route at Escravos terminal, Western Niger Delta, Nigeria. Acquisition of soil samples for geotechnical studies was done by conventional boring method using light shell and auger hand rig. Samples were analyzed in the laboratory using standard analytical procedures. The study reveals that the stratigraphy of the superficial layers indicate a reasonable degree of uniformity from BH2 to BH12 with a top soft organic silty clay underlain by sandy clay that grades into loose to medium fine grained sand towards 10m depth. In BH1, the entire 10m depth consists of sandy formation of loose to medium dense relative density. The water table is close to the ground surface and the sections of the pipeline route are periodically submerged by seasonal and sometimes tidal floods. Results of this study constitute useful preliminary information and data required for future planning and infrastructural development in the area.
Index Terms: Geotechnical, pipeline route, sub-soil, Escravos, Western Niger Delta, Nigeria
—————————— ——————————
Introduction
The Beach Ridge is the new focus of development
with the construction of an export pipeline at Escravos terminal as part of Escravos Export System Project with an onshore length of about
6km. The new export pipeline is routed in a pipeline
corridor where many pipes have already been buried especially the Liquified Natural Gas (LNG) line and Shell Petroleum Development Company (SPDC) trunk. An important requirement for the feasibility of the pipeline network project is knowledge of the sub-soil geotechnical characteristics and ground conditions prior to excavation and placement of pipeline. Geotechnical investigations were needed specifically to determine the sub-soil stratigraphy and geotechnical properties from soil samples obtained at appropriate levels. Knowledge of this will guide in the assessment of ground conditions for pipeline placement. Geotechnical studies are highly important in such projects. Thus, a good estimate of the risk associated with geotechnical parameters has
become a major issue since most of the new structures are located on sites with difficult conditions [1]. This study therefore forms part of an integrated geotechnical assessment of the project site and discusses the results of sub-soil geotechnical investigations carried out on the onshore pipeline route at Escravos terminal.
Location and Description of the Study Area Escravos Island, located in the eastern part of the Niger Delta is a sandy beach ridge delta front environment of the Nigeria Atlantic coastal setting (Fig.1). The area is characterized by active wave attack on active beaches on the seaward sides. The surrounding Escravos River is characterized by fairly strong wave activity and tidal currents. Soil formation and plant growth on beach ridge is prevalent. The prevalent mangrove marshy swamp and criss-crossing creeks impose obvious difficulties in assessing the pipeline route.
• T.K.S. Abam is a Professor of Engineering Geology and currently the Director Institute of Geosciences and Space Technology, Rivers State University of Science and Technology Port Harcourt, Nigeria. .Tel +234 803 310 0474. Email: groundscan@yahoo.com
IJSER © 2014
• Dr S.A. Ngah is a Senior Research Fellow at the Institute ohtftp://www.ijser.org
Geosciences and Space Technology, Rivers State University of
Science and Technology, Port Harcourt, Nigeria. Tel: +234 803
301 1089. Email: ngahsab@yahoo.com
International Journal of Scientific & Engineering Research, Volume 5, Issue 6, June-2014 864
ISSN 2229-5518
Legend:
Sapele
Niger Delta Rivers State Rivers System Vegetation Built up Area
Map Scale:
2mi
2km
Source: Google Earth, 2013
Escravos
Forcados Burutu
Warri
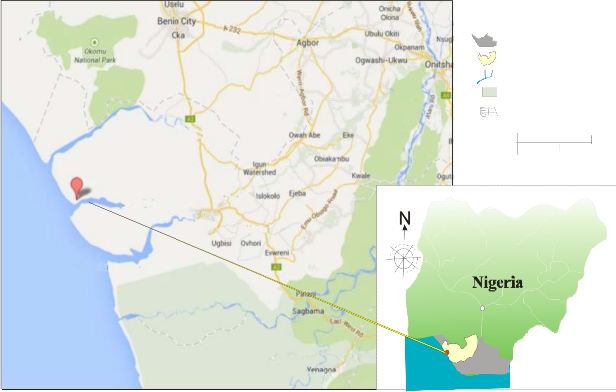
Fig.1. Map of Nigeria showing Niger Delta, Delta State and Escravos, the study location
Stratigraphically, the Niger Delta is divided into Akata, Agbada and Benin Formations in order of decreasing age. It is one of the most important petroleum provinces in the world; as a result the petroleum geology of the area has been a subject of intense study. Unfortunately, the surface and shallow Quaternary cover appear not to have received much attention. The major aquiferous Formation in this study area is the Benin Formation [2], [3]; [4]. It is about 2100m thick at the basin centre [5].
Geology of the area comprises Pleistocene - Recent sediments deposited and redistributed by fluvial and shallow continental shelf hydrodynamic processes [6]; [5]; [7]. The lithofacies include soft organic clay that forms the back swamp and the delta tip consisting mainly of evenly laminated clean grayish fine to medium sands, very fine sands, silts, clayey silt and silty clay with abundant plant debris [8]. Vegetation consists predominantly of mangrove swamps with thick marshy terrain. The ridge is low-
lying in elevation with strong reversal tide and the terrain is submerged in places, at high tide [9]. The ground water level is high to the ground surface with flooded swamps at high tide. The study site is mostly submerged in water to depths varying from
0.2m to 0.5m in places.
Methods of Investigation
Acquisition of soil samples for geotechnical studies was done by conventional boring method using
light shell and auger hand rig. The samples were examined, identified and roughly classified in the
field and later taken to the laboratory for tests. A
series of classification, strength and compressibility
tests were carried out on the samples in strict compliance with relevant geotechnical engineering standards including British standards (BS 1377); [10]; [11]; [12]. Laboratory classification tests were conducted on a number of soil samples to verify and improve on the field identification. These tests include natural moisture content, unit weights,
IJSER © 2014 http://www.ijser.org
International Journal of Scientific & Engineering Research, Volume 5, Issue 6, June-2014 865
ISSN 2229-5518
specific gravity, Atterberg limits (liquid and plastic)
and grain size distribution.
Results and Discussion
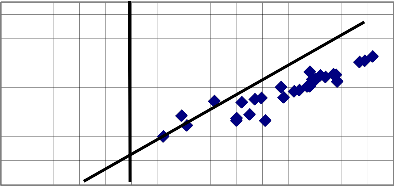
The litho-stratigraphy of the boreholes is presented as Fig.2 while Table 1 shows the engineering properties of the soils along the pipeline route. The top layers of the soil formation on the pipeline route consist of soft organic silty clay underlain by sand. At the the tank farm area, it consists essentially of sands. Fig. 3 is the plasticity chart showing Casagrande classification by Atterberg. Particle size statistics are shown in Table 2 while Table 3 shows
the shear strength parameters of the soils at depth along with ultimate and allowable bearing pressures. Finally, results of soil chemical analysis for organic content and carbonate along the pipeline route are shown as Table 4.
The stratigraphy of the superficial layers indicate a
reasonable degree of uniformity from BH2 to BH12 with a top soft organic silty clay underlain by sandy clay that grades into loose to medium fine grained sand towards 10m depth. In BH1, the entire 10m depth consists of sandy formation of loose to medium dense relative density. The water table is close to the ground surface and sections of the pipeline route are periodically submerged by seasonal and sometimes tidal floods.

STRATIGRA
SOIL PROFILE


BH2 BH3 BH4 BH5 BH6 BH7 BH8 BH9 BH10 BH11 BH12
DEPTH
(m) DESCRIPTION
STRATA PLOT
STRATA PLOT
STRATA PLOT
STRATA PLOT
STRATA PLOT
STRATA PLOT
STRATA PLOT
STRATA PLOT
STRATA PLOT
STRATA PLOT
STRATA PLOT
1 Dark soft organic
silty CLAY
2
3
Gray soft organic
4 silty CLAY
5
Gray soft sandy CLAY
6
7
8
9
Gray silty fine SAND
10
Figure 2: Sub-soil stratigraphy along proposed pipeline route
IJSER © 2014 http://www.ijser.org
International Journal of Scientific & Engineering Research, Volume 5, Issue 6, June-2014 866
ISSN 2229-5518


TABLE 1: ENGINEERING PROPERTIES OF THE SOIL ALONG PIPELINE ROUTE
BH No. | Depth (m) | Natural Moisture Content (%) | Bulk Density (KN/m3) | Liquid Limit % | Plastic Limit % | Plastic Index % | Remarks |
2 | 1.5-1.95 | 130 | 12.3 | 151 | 36.2 | 114.8 | Dark gray Very Soft silty organic Clay |
| 3.0-3.45 | 127 | 12.7 | 139 | 37.0 | 102 | Dark gray Very Soft silty organic Clay |
| 4.50-4.95 | 117 | 13.6 | 142 | 36.5 | 105.5 | Dark gray Very Soft silty Clay |
3 | 1.5-1.95 | 121 | 12.8 | 137 | 36 | 101 | Dark gray Very Soft silty organic Clay |
| 4.5-4.95 | 48 | 15.5 | 90 | 35 | 55 | Dark gray very soft silty Clay |
| 6.00-6.50 | 91 | 14.3 | 97 | 26.5 | 70.5 | Dark gray soft silty Clay |
| 9.00-9.45 | 32 | 18.9 | 101 | 48 | 53 | Dark gray very soft silty sandy Clay |
4 | 1.50-1.95 | 108 | 12.6 | 120 | 33 | 87 | Dark gray very soft silty organic Clay |
| 3.00-3.45 | 101 | 13.4 | 124 | 35.3 | 88.7 | Dark gray very soft silty Clay with fragments of rootlets |
| 6.00-6.45 | 80 | 15.0 | 118 | 25 | 93 | Dark gray very soft silty Clay with fragments of rootlets |
5 | 1.5-1.95 | 108 | 13.8 | 118 | 37 | 91 | Dark gray very soft silty Clay |
| 4.50-4.95 | 84 | 14 | 128 | 37.5 | 90.5 | Dark gray very soft silty Clay |
| 8.25-9.00 | 51 | 18.8 | | | | Dark gray very soft Clayey silty sands |
6 | 1.5-1.95 | 88 | 13.7 | 127 | 36 | 91 | Dark gray very soft silty Clay |
| 6.00-6.45 | 74 | 15.0 | 107 | 26.5 | 80.5 | Dark gray very soft silty Clay |
7 | 1.50-1.95 | 95 | 13.2 | 120 | 34 | 86 | Dark gray very soft silty organic Clay |
| 3.0-3.45 | 82 | 14.3 | 90 | 37 | 53 | Dark gray very soft silty Clay with fragments of rootlets |
| 6.00-6.45 | 63 | 16.0 | 62 | 22 | 40 | Dark gray very soft silty Clay |
8 | 1.50-1.95 | 105 | 12.1 | 122 | 32 | 90 | Dark gray very soft silty organic Clay |
| 3.45-3.75 | 113 | 13.5 | 128.5 | 43.5 | 85 | Dark gray very soft silty Clay |
9 | 1.50-1.95 | 102 | 12.6 | 119 | 32 | 87 | Dark gray very soft silty organic Clay |
| 4.50-4.95 | 62 | 15.5 | 81.5 | 12.5 | 69 | Dark gray very soft silty Clay |
| 6.00-6.45 | 56 | 16.0 | 69 | 12 | 57 | Dark gray very soft silty Clay |
10 | 2.25-3.00 | 85 | 13.3 | 114 | 36 | 78 | Dark gray very soft silty Clay |
| 6.00-6.75 | 62 | 15.2 | 95 | 37 | 58 | Dark gray very soft silty Clay |
11 | 1.50-1.95 | 95 | 12.9 | 108 | 36 | 72 | Dark gray very soft silty organic Clay |
| 3.00-3.45 | 111 | 13.7 | 99.5 | 28 | 71.5 | Dark gray very soft silty Clay |
| 5.25-6.00 | 70 | 15.2 | 71 | 22 | 49 | Dark gray very soft silty Clay |
12 | 3.0-3.50 | 100 | 12.1 | 117 | 36 | 81 | Dark gray very soft silty organic Clay |
| 4.5-4.95 | 104 | 13.4 | 112 | 35 | 77 | Dark gray very soft silty Clay |
| 7.5-7.95 | 37 | 15.6 | 92 | 24 | 68 | Dark gray very soft silty Clay |
IJSER © 2014 http://www.ijser.org
International Journal of Scientific & Engineering Research, Volume 5, Issue 6, June-2014 867
ISSN 2229-5518
PLASTICITY
:
CL - Low
CI - Medium
CH
CI
CL MH or OH
CL
LIQUID LIMIT (%)
Figure 3: Plasticity chart showing Casagrande Soil classification by Atterberg limits

TABLE 2. PARTICLE SIZE STATISTICS
BH No | Depth (m) | D10 (mm) | D30 (mm) | D50 (mm) | D60 (mm) | Cu=D60 /D10 | Cz=D30 2/(D10 *D60 ) | K=C*D102 (m/sec) |
1 | 1.50-1.95 | 0.15 | 0.19 | 0.22 | 0.25 | 1.667 | 0.963 | 0.00225 |
| 3.0-3.45 | 0.16 | 0.19 | 0.21 | 0.23 | 1.438 | 0.981 | 0.00256 |
2 | 9.75-10.0 | 0.16 | 0.18 | 0.21 | 0.23 | 1.438 | 0.880 | 0.00256 |
6 | 7.95-8.0 | 0.17 | 0.19 | 0.22 | 0.24 | 1.412 | 0.885 | 0.00289 |
7 | 7.50-7.95 | 0.16 | 0.19 | 0.21 | 0.22 | 1.375 | 1.026 | 0.00256 |
9 | 7.50-7.95 | 0.17 | 0.19 | 0.21 | 0.22 | 1.294 | 0.965 | 0.00289 |
TABLE 3: SHEAR STRENGTH PARAMETERS OF THE SOILS AT DEPTH ALONG WITH ULTIMATE AND ALLOWABLE BEARING PRESSURE

Borehole Depth Range

(m)
Working Depth
(m)
Cu Φ Ultimate Bearing
Capacity kPa
Safe Bearing Capacity kPa
1 1 1 0 30 334 133.62
2 2 0 31 388 155.22
3 3 0 30 442 176.82
4 4 0 33 496 198.42
5 5 0 32 766 306.42
2 1.5-1.95 1.75 17 0 98.3 39.32
3.0-3.45 3.25 17 0 99.5 39.8
4.5-4.95 4.75 35 5 203.3 81.32
6.00-6.45 6.25 23 0 136.1 54.44
7.5-7.95 7.75 26 0 154.4 61.76
9.75-10 9.85 24 3 144.68 57.872
1.5-1.95 1.75 15 0 86.9 34.76
3 3.0-3.45 3.25 20 0 116.6 46.64
4.5-4.95 4.75 16 3 95 38
6.00-6.45 6.25 21 0 124.7 49.88
7.5-7.45 7.75 23 5 137.3 54.92
9.00-9.45 9.85 18 4 110.48 44.192
IJSER © 2014 http://www.ijser.org
International Journal of Scientific & Engineering Research, Volume 5, Issue 6, June-2014 868
ISSN 2229-5518

9.00-9.45 9.85 18 5 110.48 44.192

Borehole Depth Range

(m)
Working Depth
(m)
Cu Φ Ultimate Bearing
Capacity kPa
Safe Bearing Capacity kPa
1.5-1.95 1.75 18 0 104 41.6
6 3.0-3.45 3.25 16 0 93.8 37.52
4.5-4.95 4.75 26 3 152 60.8
6.00-6.45 6.25 24 4 141.8 56.72
7.5-7.95 7.75 21 3 125.9 50.36
9.00-9.45 9.25 20 3 121.4 48.56
1.5-1.95 1.75 12 0 69.8 27.92
7 3.0-3.45 3.25 18 0 105.2 42.08
4.5-4.95 4.75 18 0 106.4 42.56
6.00-6.45 6.25 35 6 204.5 81.8
1.5-1.95 1.75 14 0 81.2 32.48
8 3.0-3.45 3.25 18 0 105.2 42.08
4.5-4.95 4.75 18 0 106.4 42.56
6.00-6.45 6.25 24 4 141.8 56.72
9.00-9.45 9.85 29 5 173.18 69.272
1.5-1.95 1.75 12 0 69.8 27.92
9 3.0-3.45 3.25 18 0 105.2 42.08
4.5-4.95 4.75 15 0 89.3 35.72
6.00-6.45 6.25 23 10 136.1 54.44
9.00-9.45 9.25 35 3 206.9 82.76
1.5-1.95 15 3 85.5 34.2
10 3.0-3.45 18 5 102.6 41.04
4.5-4.95 17 0 96.9 38.76
6.00-6.45 23 8 131.1 52.44
9.00-9.45 18 5 102.6 41.04
1.5-1.95 13 3 74.1 29.64
11 3.0-3.45 18 5 102.6 41.04
4.5-4.95 18 0 102.6 41.04
6.00-6.45 23 6 131.1 52.44
9.00-9.45 20 3 114 45.6
3.00-3.45 12 0 68.4 27.36
IJSER © 2014 http://www.ijser.org
International Journal of Scientific & Engineering Research, Volume 5, Issue 6, June-2014

ISSN 2229-5518
869
12 4.5-4.95
6.00-6.45
7.50-7.95

9.00-9.45
18 0
17 0
25 3
27 3
102.6
96.9
142.5
153.9
41.04
38.76
57
61.56
I£ER 2014 http://WWW.IISer.org
International Journal of Scientific & Engineering Research, Volume 5, Issue 6, June-2014 870
ISSN 2229-5518
TABLE 4: RESULTS OF CHEMICAL ANALYSIS OF SEDIMENT

pH µs/cm %
S/No. BH No. Depth (m) Electrical Organic Organic Carbonate
Conductivity Carbon Matter
1 1 1.95 7.4 0.57 1.2 0.4
2 4.5 7.7 0.5 0.95 0.25
3 2 3 7.5 16,300 2.6 3.4 2.1
4 6 7.9 16,900 1.9 2.8 1.1
5 3 1.5 7.6 16,560 4.3 6.8 2.3
6 4.5 7.6 16,219 2.1 2.7 0.5
7 4 1.5 7.8 16,920 3.7 7.5 2.1
8 4.5 7.5 16,325 2.5 3.1 1.4
9 5 2.5-3.0 7.74 16,100 3.2 5.52 1.93
10 6 7.9 16,700 1.9 2.4 0.7
11 6 1.5-1.95 7.92 16,900 4.19 7.22 2.11
12 4.5 7.8 15,800 2.4 3.1 1.2
13 7 1.5 7.7 16,100 4.4 7.3 2.3
14 4.5 7.5 16,850 2.2 2.8 0.78
15 8 3 7.8 16,210 2.1 3.9 1.5
16 6 7.7 16,275 1.8 2.2 1.2
17 9 1.5 7.6 16,700 3.8 7.9 2.3
18 6 7.7 16,890 2.3 3.1 1.3
19 10 1.5-1.95 7.77 15,000 4.28 7.38 2.2
20 4.5 7.8 16,350 1.7 3.2 1.6
21 11 1.95-2.25 7.75 14,300 3.96 6.82 2.04
22 6 7.4 16,500 1.4 2.3 1.1
23 12 1.95 7.7 15,400 3.5 6.3 2.1

24 4.5 7.6 16,720 2.1 2.7 1.4
Conclusion
The litho-stratigraphy of the boreholes shows the engineering properties of the soils along the pipeline route. The top layers of the soil formation on the pipeline route consist of soft organic silty clay underlain by sand. At the tank farm area, it consists essentially of sands. The result of this study also revealed the sub-soil geotechnical characteristics and ground conditions prior to excavation and placement of pipeline requirement
for the feasibility of the pipeline network at the onshore pipeline route at Escravos terminal, Western Niger Delta, Nigeria. The stratigraphy of the superficial layers indicate a reasonable degree of uniformity from BH2 to BH12 with a top soft organic silty clay underlain by sandy clay that grades into loose to medium fine grained sand towards 10m depth. The entire 10m depth consists of sandy formation of loose to medium dense relative density in BH1. The water table is close to
IJSER © 2014 http://www.ijser.org
International Journal of Scientific & Engineering Research, Volume 5, Issue 6, June-2014 871
ISSN 2229-5518
the ground surface and the sections of the pipeline route are periodically submerged by seasonal and sometimes tidal floods. This study therefore, highlighted useful preliminary information and data required for future planning and infrastructural development in the study area.
References
[1] M. B. Haddou, A. Essahlaoui, M. Boujlal, A. Elouali and A.Hmaidi. Study of the geotechnical parameters of the different soils by correlation analysis and statistics in the Kenitra Region of Morocco. J. Earth Sci.
& Geotech. Eng., 3(2): 51 – 60, 2013.
[2] Etu-Efeotor, J.O. Preliminary hydrogeochemical investigation of subsurface waters in parts of the Niger Delta. J. Min. Geol. 18(1):103 – 105, 1981.
[3] Etu-Efeotor, J.O and Odigi, M.I. Water supply problems in the Eastern Niger Delta. Jour. Min. Geol. 26(2):279 – 279.1983.
[4] Abam T. K. S. Dynamics and quality of
water resources in the Niger Delta. Proceedings of IUGG 99 Symposium HSS Birmingham) IAHS Publ. No. 259, pp. 429
– 437. 1999.
[5] Short, K. C. and Stauble, A. J. Outline of
Geology of the Niger Delta. American
Association of Geologists, Vol. 51, No. 5, pp. 761 – 779. 1967.
[6] Allen, J. R. L. Late Quatenary Niger Delta and adjacent areas: sedimentary
environment and lithofacies. American
Assoc of Petr Geol, Vol. 49, pp. 549 – 600.
1965.
[7] Amajor, L. C. and Ofoegbu C. O.
Determination of polluted aquifers by stratigraphically controlled biochemical mapping; Example from the Eastern Niger Delta, Nigeria. Groundwater and Mineral Resources of Nigeria, pp. 62 – 73.1988.
[8] Etu-Efeotor, J.O and Akpokodje, E.G.
Aquifer systems of the Niger Delta. J. Min. Geol., 26(2):279 – 284,1990.
[9] Niger Delta Environmental Survey. Physical
Environment Report on the Hydrology of
the Niger Delta. 1999.
[10] Peck, R.B; Hanson W.E and Thornburn T.H.
Foundation Engineering 2nd Edition John
Wiley and Sons 514pgs.1973
[11] Tomlinson M. J. Foundation Design and
Construction 6th Edition, Longman, 536 pp,
1999.
[12] Dun,T.S, Anderson L.R. and Keifer.
Fundamental of Geotechnical Analysis – John Wiley Publisher , 414 pages. 1980.
IJSER © 2014 http://www.ijser.org