
International Journal of Scientific & Engineering Research, Volume 4, Issue 6, June-2013 1149
ISSN 2229-5518
Fuzzy Based Traffic Congestion Detection & Pattern Analysis Using Inductive loop sensor R Rekha, R Karthika
—————————— ——————————
Today, the inductive-loop detector is, by far, the most widely used sensor in modern traffic control systems. Magnetometers, magnetic sensors, video image processors, microwave and laser radar sensors, ultrasonic, acoustic, and passive infrared sensors are also produced commercially and used for various traffic management applications. The optical sensor has found use for detecting priority and over height vehicles. Among the traffic flow sensors mentioned above, the inductive loop detectors are widely used as they provide good sensitivity coupled with a cost effective solution. Research papers discussing improvement of loop detectors for better speed measurement and classification for lane-disciplined traffic conditions were reported.
While single inductive-loop detectors give direct
information concerning vehicle passage and presence, other traffic flow parameters such as density and speed must be inferred from algorithms that interpret or analyze the measured data. When these parameters are calculated from inductive loop data, the values may not have sufficient accuracy for some applications (such as rapid freeway incident detection) or the available information may be inadequate to support the application (such as calculation of link travel time).
Furthermore, the operation of inductive-loop detectors
is degraded by pavement deterioration, improper installation,
and weather-related effects Street and utility repair may also impair loop integrity. Thus, a good loop installation, acceptance testing, repair, and maintenance program is
required to maintain the operational status of an inductive- loop-based vehicle detection system.
The traffic conditions in many countries do not conform to an orderly lane system. In such situations, vehicles occupy any available road area without adhering to a lane system. Thus, there is a need to develop detectors that can sense (bus, car, motor cycle, and bicycle) under heterogeneous and lane-less traffic conditions.
A new and simple inductive loop sensor structure that
senses both large- and small-sized vehicles and differentiates the
large one from the small. The sensor provides a unique output signature for each type of vehicle. The sensor output information is such that it is not only possible to detect and classify the vehicles in an unstructured traffic system
Fig. 1 shows the schematic diagrams of three possible inductive loops for vehicle detection. The coil structure with a large area indicated as “Loop-A” in Fig. 1 is the one in use for lane-based homogeneous traffic and is well suited to detect large vehicles such as car or bus or truck. When such a large vehicle goes over the loop, the change in the inductance LP of the loop will be as indicated by the curve (continuous line) drawn on top of the Loop-A section in Fig. 1. However, if a small vehicle such as a bicycle goes over this loop, the change in the inductance of the loop will be small, and it is detectable only when the object is directly above the coil position, as indicated by the curve drawn with a dotted line in Fig. 1, above
IJSER © 2013 http://www.ijser.org
International Journal of Scientific & Engineering Research, Volume 4, Issue 6, June-2013 1150
ISSN 2229-5518
Loop-A. In all other positions, the resultant change in the inductance of Loop- A will be negligible.
Fig. 1 Pictorial representation of the relative change in inductance for the inductive loops A, B, and C. The continuous curve in the plot shows the relative change in inductance when a large metallic object (such as a bus) moves from left to right at a vertical distance of about 60 cm from the plane of the loop. The dotted curve shows the change in inductance when a small metallic object (e.g., bicycle) moves from left to right. In this case, the object is moving at a distance of about 8 cm above the plane of the inductive loop.
On the other hand, for a coil structure as indicated in “Loop-B,” with a smaller cross-sectional area compared with Loop-A, the relative change in the coil inductance (shown by the curve drawn in dotted line) will be appreciable when a small vehicle approaches, close to the plane (vertically) of the loop. However, the relative change in inductance (indicated by the continuous line, on top of Loop-B) will be small for a large vehicle (bus or truck) moving over Loop-B. Thus, Loop-A is mainly sensitive to large vehicles, and Loop- B is sensitive to small vehicles that go very close (i.e., vertical distance from the loop plane) to the loop.
An inductive-loop detector senses the presence of a conductive metal object by inducing currents in the object, which reduce the loop inductance. Inductive-loop detectors are installed in the roadway surface. They consist of four parts: a wire loop of one or more turns of wire embedded in the roadway pavement, a lead-in wire running from the wire loop to a pull box, a lead-in cable connecting the lead-in wire at the pull box to the controller, and an electronics unit housed in the controller cabinet.
The proposed loop, “Loop-C” in Fig. 1, is formed using a continuous conductor wound as illustrated (shown
more clearly in Fig. 2) to form an outer loop and an inner loop. The loops are formed such that a current flow through the coil produces a magnetic flux in the outer loop to be in line and aiding the flux produced by the inner loop, at the center of the loop.
Fig. 2 New inductive loop suitable to sense small as well as large vehicles
When a large vehicle such as a bus moves over Loop-C, the loop will give a relative change in inductance similar to Loop- A, and when a small object such as a bicycle goes over the loop, it gives a relative change in inductance similar to Loop-B. Thus, a large vehicle (e.g., bus) and a smaller vehicle close to the loop (e.g., bicycle) can be reliably detected with the proposed Loop- C shown in Fig. 1. A detailed 3-D view of the proposed loop is shown in Fig. 2. The loop coil can be placed below or on the surface of the road.
The loop is connected to the measurement system as indicated in Fig. 2. Capacitances C1, C2, and CM along with inductance LP of the loop coil form a resonant circuit. This circuit passes the signal at the resonant frequency to the measurement system and attenuates all the unwanted frequency components that may be picked up by the loop. The measurement system and the loop with inductance LP are connected together using a twisted-pair cable. The voltage across capacitor CM is given to a Data Acquisition System (DAS). The data acquired by the DAS is sent to a computer and a suitable algorithm, implemented in the computer using a virtual instrumentation environment, detects the type and speed of the vehicles, and counts the number of vehicles being sensed.
For the design of the system LabVIEW software in applied in which, it is a graphical programming language that
IJSER © 2013 http://www.ijser.org
International Journal of Scientific & Engineering Research, Volume 4, Issue 6, June-2013 1151
ISSN 2229-5518
uses icons instead of lines of text to create applications. In contrast to text-based programming languages, where instructions determine program execution, LabVIEW uses dataflow programming, where the flow of data determines execution.
In LabVIEW, you build a user interface with a set of
tools and objects. The user interface is known as the front
panel. You then add code using graphical representations of functions to control the front panel objects. The block diagram contains this code. In some ways, the block diagram resembles a flowchart.
LabVIEW ties the creation of user interfaces (called
front panels) into the development cycle. LabVIEW programs/subroutines are called virtual instruments (VIs). Each VI has three components: a block diagram, a front panel and a connector panel. The last is used to represent the VI in the block diagrams of other, calling VIs. Controls and indicators on the front panel allow an operator to input data into or extract data from a running virtual instrument. However, the front panel can also serve as a programmatic interface.
Thus a virtual instrument can either be run as a
program, with the front panel serving as a user interface, or,
when dropped as a node onto the block diagram, the front panel defines the inputs and outputs for the given node through the connector panel. This implies each VI can be easily tested before being embedded as a subroutine into a larger program.
The graphical approach also allows non-programmers to build programs by dragging and dropping virtual representations of lab equipment with which they are already familiar. The LabVIEW programming environment, with the included examples and documentation, makes it simple to create small applications. This is a benefit on one side, but there is also a certain danger of underestimating the expertise needed for high-quality G programming.
Fig. 3 Sensing and classification of number of vehicle and types
For complex algorithms or large scale code, it is important that the programmer possesses an extensive knowledge of the special LabVIEW syntax and the topology of its memory management. The most advanced LabVIEW development systems offer the possibility of building stand- alone applications. Furthermore, it is possible to create distributed applications, which communicate by a client/server scheme, and are therefore easier to implement due to the inherently parallel nature of G.
The fig. 4 shows the result of an traffic congestion area
for an three zone structure. During the vehicle transmission traffic congestion is occurred in zone 1 due to the slow movement of vehicle. In such case alternate route is opened. During the same process zone 2 also congested in traffic which also has an another alternative way for movement of vehicle. But the traffic due in the time for zone 3 is normal due to the fast movement of vehicle.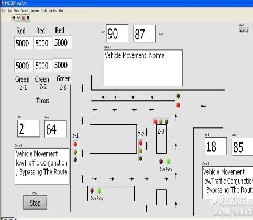
Fig. 4 Traffic congestion detection
.
For the pattern analysis hardware structure is implemented. So from fig 2 the structure is designed with two sizes of sensor loops with inner and outer inductive loop which detects small as well as large vehicles. The loops designed are connected to a resonant circuit in the form of a twisted cable. The resonant circuit provides an amplified circuit which convert analog signal into a digital signal in which MAX232 is provided for the TTL logic. A PIC microcontroller is used for the control of the functions PIC16F877.
IJSER © 2013 http://www.ijser.org
International Journal of Scientific & Engineering Research, Volume 4, Issue 6, June-2013 1152
ISSN 2229-5518
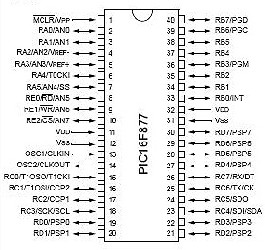
Fig 6(a) shows an vehicle passing through the inductive loop pattern analysis. The traffic congestion is obtained by the speed of the vehicle through the loop by the above fig. 6(b) shows the traffic congestion.
Fig. 5 Structure of PIC16F877
The designed inductive loop structure is connected with the PC using cable connector. So when a vehicle is passing through the sensor loop it produces an analog signal and to convert this ADC is provided with MAX232 and PIC16F877. And the pattern analysis obtained.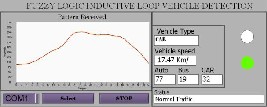
Fig. 6(a) Pattern analysis- Normal traffic
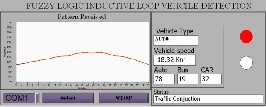
Fig. 6(b) Pattern analysis- traffic congestion
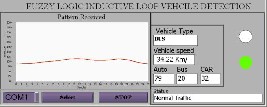
Fig. 6(c) Pattern analysis- again to a normal traffic
An automated vehicle detection system suitable for all the types of traffic condition has been a major stumbling block for the implementation of many Intelligent Traffic management
System (ITS) applications in several countries. Fig. 3. The results show that the new inductive loop system sense and segregate the number of vehicles and their type. The proposed multiple loop system is useful for roads with any type of traffic. Fig. 4. The result shows ITS implementations in countries with all types of traffic conditions providing the detection of traffic congestion. Further by designing an inductive loop structure with PIC microcontroller in fuzzy logic system an accurate pattern analysis can be obtained which is shown in the Fig.6(a),
6(b) and 6(c) .
[1] Traffic Detector Handbook: 3rd Edition- Volume-I, U.S. Dept.
Transp.,Fed. Highway Admin., Washington, DC, Oct. 2006, Pub. No. FHWAHRT-06-108.
[2] Y.-K. Ki and D.-K. Baik, “Model for accurate speed measurement using double-loop detectors,” IEEE Trans. Veh. Technol., vol. 55, no.
4,pp. 1094–1101, Jul. 2006.
[3] W.-H. Lin, J. Dahlgren, and H. Huo, “Enhancement of vehicle speed estimation with single loop detectors,” Transp. Res. Rec., J. Transp. Res. Board, vol. 1870, pp. 147–152, 2004.
[4] S. Meta and M. G. Cinsdikici, “Vehicle classification algorithm based on component analysis for single-loop inductive detector,” IEEE Trans. Veh. Technol., vol. 59, no. 6, pp. 2795–2805, Jul. 2010.
[5] J. Gajda, R. Sroka, M. Stencel, A. Wajda, and T. Zeqlen, “A vehicle classification based on inductive loop detectors,” in Proc. 18th IEEE IMTC, May 2001, vol. 1, pp. 460–464.
IJSER © 2013 http://www.ijser.org