International Journal of Scientific & Engineering Research, Volume 5, Issue 6, June-2014 484
ISSN 2229-5518
FPGA-Based 16-Channel Digital Ultrasound
Receive Beamformer
Mawia Ahmed Hassan
Abstract— Ultrasound imaging is an efficient, noninvasive, method for medical diagnosis. A commonly used approach to image acquisition in ultrasound system is digital beamforming. Digital beamforming, as applied to the medical ultrasound, is defined as phase alignment and summation of signals that are generated from a common source, by received at different times by a multi-elements ultrasound transducer. In this paper implementations of FPGA-based 16- channel digital receive beamformer for ultrasound imaging was presented. The system consists of two 8 channels block to implement the 16-channel and the reconstructed line block. The beamfomer was done by using Xilinx system generator (Xilinx, Inc.) and MATLAB simulink (MathWorks, Inc.). The system was implemented in Virtex-5 FPGA. The total power consumption equals 7875.66 mW and the device utilizationnwas acceptable. The hardware architecture of the design provided flexibility for beamforming.
Index Terms— Ultrasound imaging; Digital receive beamforming; FPGA ; Embedded DSP; FIR Hilbert filter;VHDL.
—————————— ——————————
ltrasound is defined as acoustic waves with frequencies above those which can be detected by the ear, from about
20 KHz to several hundred MHz. Ultrasound for medical applications typically uses only the portion of the ultrasound spectrum from 1 MHz to 50 MHz due to the combined needs of good resolution (small wave length) and good penetrating ability (not too high a frequency) [1]. They are generated by converting a radio frequency (RF) electrical signal into me- chanical vibration via a piezoelectric transducer sensor [2]. The ultrasound waves propagate into the tissues of the body where apportion is reflected, which used to generate the ultra- sound image. A commonly used approach to image acquisi- tion in ultrasound system is digital beamforming. Digital beamforming, as applied to the medical ultrasound, is defined as phase alignment and summation [3] of signals that are gen- erated from a common source, by received at different times by a multi-elements ultrasound transducer [4]. The commonly use arrays are linear, curved, or phase array. The important distinctions arise from the method of beam steering use with these arrays. For linear and curve linear, the steering is ac- complished by selection of a group of elements whose location defines the phase center of the beam. In contrast to linear and
Out 1
8 channel Block #1
Out 2
8 channel Block #2
In 1
In 2
Reconstructed A-Scan
Line
curve linear array, phase array transducer required that the beamformer steers the beam with switched set of array ele- ments [5]. These requirements mention important differences
Fig. 1. Architecture implementation of the FPGA Based 16- channel digital ultrasound receive beamformer blocks
in complexity over the linear and curved array. Beamformer has two functions: directivity to the transducer
(enhancing its gain) and defines a focal point within the body,
————————————————
• Mawia A.Hassan- Sudan Universit of Science & technology- Biomedical
Engineering Department. E-mail: mawiaahmed@sustech.edu.
• Mawia A. Hassan received his B.Sc. degree from the Biomedical Engineer-
ing department at Sudan University of Science & Technology in 2002. He recived his M.Sc. & Ph.D. degrees from the Biomedical Engineering de-
partment at Cairo University in 2007 and 2011 respectively. He is current- ly the head of Biomedical Engineering Department at Sudan university of Sceinec & Technology. His research interests include medical imaging pro- cessing, analysis in particular MRI and ultrasound imaging, and multi- dimensional signal processing for biomedical applications.
from which location of the returning echo is derived.
Different articles introduced the issues involved in digital
beamformer design including the description of its main com-
ponents. Embedded digital beamforming was initially done
using Application-Specific Integrated Circuits (ASICs) [6].
Many approaches also described the digital signal processing
algorithms that can be used in digital beamforming signal
demodulation [7][8][9][10]. Real-time digital ultrasound imag- ing is described in [11].
In this paper, implementations of FPGA-based 16- channel digital receive beamformer for ultrasound imaging was pre- sented.
IJSER © 2014
International Journal of Scientific & Engineering Research, Volume 5, Issue 6, June-2014 485

ISSN 2229-5518
(a)
(b)
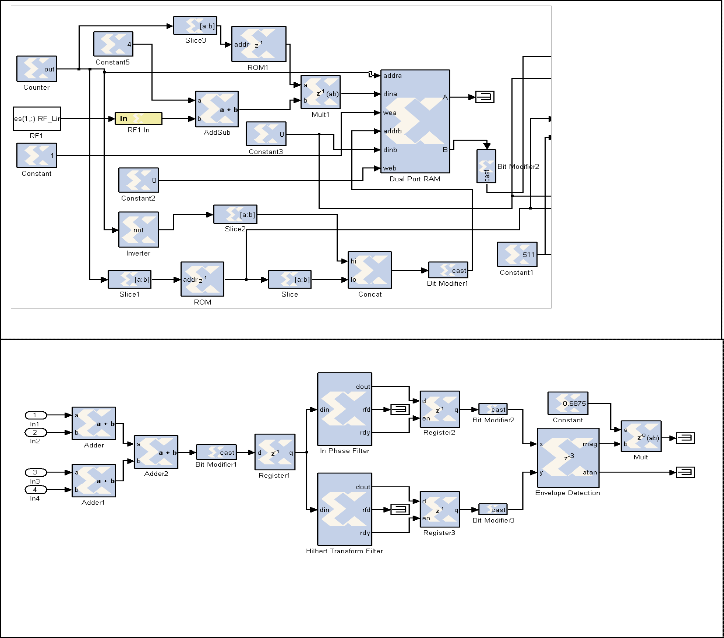
Fig. 2. The inside contents of the implementation blocks.(a) 8-channel block, (b) The reconstructed line block.
Typical architecture implementations of the modular FPGA- based 16 - channel digital ultrasound receive beamformer with embedded DSP for ultrasound imaging is shown in Fig.1. The system consists of: two 8 channels block and reconstructed line block. The beamfomer is done by using Xilinx system generator (Xilinx, Inc.) and MATLAB simulink (MathWorks, Inc.). The system is implemented in Virtex-5 FPGA.
The inside contents of the implementation blocks of one chan- nel were shown in Figure 2. The implementation steps are:
1. The RF data were saved in MATLAB workspace and we used simulink block to read the one dimension RF data from workspace.
2. Then The RF data were converted from double preci- sion data type to fixed point numeric precision for hardware efficiency.
3. Verified the fixed-point Model by comparing the fixed-point results to the floating-point results and de- termined if the quantization error is acceptable.
4. After verified the model, we used a dual port RAM
block (table 1) for the RF Samples with a depth of
1024 data words.
IJSER © 2014 http://www.ijser.org
International Journal of Scientific & Engineering Research, Volume 5, Issue 6, June-2014 486
ISSN 2229-5518
5. Then we filled this continuously with a 10 bit counter via one port.
6. Each time the most significant bit (MSB) of that coun- ter toggles it indicates that one 512 word frame has been written.
7. The second port (for reading) used the inverse MSB,
so while we were writing to the upper memory array,
we were reading the lower memory array and vice
versa.
TABLE 1
![]()
THE RAM BLOCK PARAMETERS
• Writing low 512 addresses - reading high 512 addresses.
• Writing high 512 addresses - reading low 512 addresses.
• The so called "bank switching" was done by the MSB of the addresses, and since they were inversed to each other you achieve the above behavior.
11. We put two comparator and two MUXs (table 3) be-
hind the output of the DP-RAMs Data output for
beamforming.![]()
Parameter
Depth
Initial value vector
Memory Type
Initial value for port A output register
Initial value for port B output register
Provide synchronous reset port for port Aoutput register
Provide synchronous reset port for port B output register
Provide enable port for port A Provide enable port for port B Latency
Port A Port B
Override with doubles
Optimize for
Use core placement information
![]()
Define FPGA area for resource estimation
Value
1024
0
Block RAM
0
0
Off
Off Off Off
1
Read After
Write
Read After
Write Off Area On Off
![]()
![]()
12. As the algorithm describes: One of MUXs data input should be tied to '0'.
13. After delaying each RF channel samples, the summa- tion was applied using M-code block to summate the
8. We used ROM block (table 2) to store the dynamic fo- cusing line.
9. We used the lower 9 bits of the counter for addressing the ROM for the dynamic focusing line values.
TABLE 2
![]()
THE ROM BLOCK PARAMETERS
8 channel signals.
14. The summation of the each two 8 channels is connect- ed to pipe line adder and the output of each adder is connected to another adder to reconstruct one recon- structed the focus ultrasound line.
15. We were modified the bit of the signal to 16 bit using bit modifier block.![]()
Parameter
Depth
Initial value vector
Memory Type
Provide reset port for output register Initial value for output register Provide enable port
Latency Word type Number of bits Binary point
Override with doubles
Optimize for
Use pre-defined core placement information
Define FPGA area for resource estimation
Value
512
Focusing Vector
Block RAM
Off
0
Off
1
Unsigned
9
0
Off Area On
Off
![]()
10. We need to feed the read port address with 9 bits coming from ROM and the inverted MSB of the coun- ter. (We used a Concat Symbol for that purpose). Thus you are always writing on one 512 value block, while simultaneous reading the other. It's like :
IJSER © 2014 http://www.ijser.org
International Journal of Scientific & Engineering Research, Volume 5, Issue 6, June-2014 487
ISSN 2229-5518
16. The Register block (data presented at the input will appear at the output after one sample period).
17. The FIR Hilbert filter block (table 4) for applying the quadrature components.
18. The Fractional delay filter (in-phase filter) block to
compensate the delay when we are being used a high
FIR order.
19. Then we modified the bit of the signals from step 17
and 18 to 16 bit again using bit modifier blocks.
20. The Envelope detection block which was computed
the envelope of the two signals coming from step 17
and 18.
21. In order to obtain performance and logic utilization
figures for the suggestion architecture, it was imple-
mented in the hardware description language
(VHDL).
The system was used to acquire data from a resolution phan- tom. The data acquired from a resolution phantom. This data was collected in IBE Tech Giza, Egypt. The sampling rate was
50 MHz and the number of channels used acquired was 32. The scan depth was 6 cm, the number of channels was 32 channels, and the ADC sampling rate was 50 MSPS. Curve linear array shape transducer was used to acquire the data with central frequency of 3.5 MHz, and element spacing of
0.516 mm. Each ultrasonic A-scan was saved in a record con-
sisted of 4096 RF samples per line each represented in 2 bytes.
The speed of the ultrasound in the phantom was 1540 m/sec.
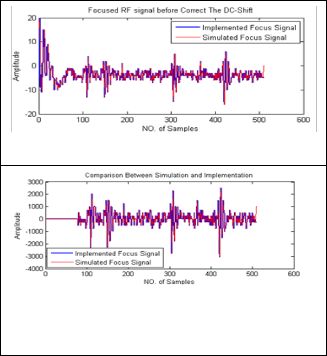
Fig. 3 (a) illustrated one channel after applying the dynamic fo- cusing and before correcting the DC shift for simulated and

implemented signal. As can be seen there is a different in some parts of the implementation signal compared to simulation one. The reason for that was the noise for high power in the beginning of the signal. Figure 3(b) shown the comparison between implemented and simulated focused signal after re- move the noise and also apply TGC to compensate for attenu- ation in the medium. As can be shown the signals look the same.
(a)
(b)
(c)
(a)
(b)
Fig. 3. Comparison between first channel after applying the dy-
namic focusing for simulated and implemented signal.(a) Before
TGC,(b) After TGC.
(d)
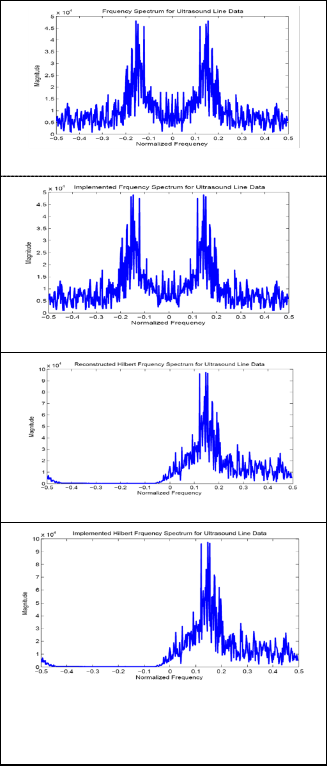
Fig. 4. Frequency spectrums for ultrasound line. (a) Simulated real signal, (b) Implemented real signal, (c) Simulated analytical signal, (d) Implemented analytical signal.
IJSER © 2014 http://www.ijser.org
International Journal of Scientific & Engineering Research, Volume 5, Issue 6, June-2014 488
ISSN 2229-5518
24-tap FIR Hilbert was used for the simulation and implemen- tation of the ultrasound data. Fig. 4(a) and Fig. 4(b) showed the frequency spectrum of simulated and implemented single channel real signal respectively. Fig. 4(c) and Fig. 4(d) were showed the frequency spectrum of simulated and implemented single channel analytical signal respectively. As can be shown the negative frequency was eliminated compared to the simu- lated Hilbert filter frequency spectrum.
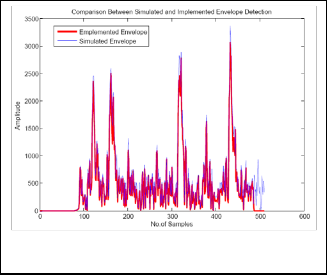
Fig. 5 was described the comparison between simulated and implemented envelope detection of real and quadrature com- ponents. As can be shown the result was acceptable.
Total estimated power con- sumption
- 4130.48
Fig. 5. Comparison between simulated and implemented envelope detection.
Table 5 was shown the summary of the power consumption in
16-channel beamforming implementation on virtex-5. The to-
tal estimated power consumption equal 4130.48 mW. Table 6![]()
TABLE 6
![]()
POWER CONSUMPTION IN THE RECONSTRUCTED LINE
![]()
Power summary I(mA) P(mW)
Total Vccint 1.00V 2759.26 2759.26
Total Vccaux 2.50V 346.94 867.34
Total Vcco25 2.50V 47.43 118.58
Clocks - 30.58
DSP - 1.58
IO - 95.44
Logic - 7.92
Signals - 6.11
Quiescent Vccint 1.00V 2711.04 2711.04
Quiescent Vccaux 2.50V 345.00 862.50
Quiescent Vcco25 2.50V 12.00 30.00
was shown the summary of the power consumption in the reconstructed line implementation on virtex-5. The total esti- mated power consumption equal 3745.18 mW.![]()
Total estimated power con- sumption
- 3745.18
Table 7 and 8 are shown the device utilization summary for the 16-channels beamforming block implementation and the reconstructed line implementation respectively. The tables described used devices, available in the port, and the utiliza- tion in percentage using Virtex-5 FPGA.
The implementation of the system was done in Virtex-5 FPGA. We used three port of Virtix-5, two 8-channel beamforming for the 16-channel beamforming and the other for the reconstruct- ed line. This take an opportunity to build 16-,32-,64-,digital beamforming. The implementation results were shown that the fixed-point Model is the same as the floating point mode and this is an important for hardware efficiency.
Future, the delays applied using dynamic focusing gave a
synchronous in the time of arrival and improved the lateral
resolution. Furthermore, The Hilbert filter is implemented in
the form whereby the zero tap coefficients are not computed
and therefore an order L filter uses only L/2 multiplications.
This was reducing the computational time by a half. The total
estimated power consumption for the 16-channel beamform- ing ports equal to 4130.48 mW and the device utilization was acceptable. Also the total estimated power consumption for the reconstructed line ports equal to 7875.66 mW and the de-
vice utilization was also acceptable.
IJSER © 2014 http://www.ijser.org
International Journal of Scientific & Engineering Research, Volume 5, Issue 6, June-2014 489
ISSN 2229-5518
TABLE 7
DEVICE UTILIZATION SUMMARY IN 16-CHANNEL BEAMFORMING
![]()
Slice Logic Utilization Used Available Utilization
![]()
Number of Slice Registers 276 207,360 1% Number used as Flip Flops 276 - - Number of Slice LUTs 964 207,360 1%
Number used as logic 946 207,360 1%
Number using O6 output
only 594 - -
Number using O5 output
only 237 - -
Number using O5 and O6 115 - - Number used as exclusive
route-thru 18 - -
Number using O6 output
only 255 - -
Number of route-thrus 261 - - Number using O5 output
only 6 - -
Number of occupied Slices 424 51,840 1% Number of LUT Flip Flop
pairs used 995 - -
Number with an unused Flip
Flop 719 995 72%
Number with an unused LUT 31 995 3% Number of fully used LUT-
FF pairs 245 995 24%
Number of unique control
sets 1 - -
Number of slice register sites
lost
to control set restrictions
0 207,360 0%
Number of bonded IOBs 863 1,200 71%
Number of BlockRAM/FIFO 32 - - Number using BlockRAM
only 35 - -
Number of 18k BlockRAM
used 48 - -
Total Memory used (KB) 864 10,368 8% Number of
BUFG/BUFGCTRLs 1 32 3%
Number used as BUFGs 1 - -
Number of DSP48Es 16 192 8%
Average Fanout of Non- 2.14 - -
Clock Nets
[1] D. A .Christensen, Ultrasonic Bioinstrumentation, Jonh Wiley & Sons, New
York, 1988.
[2] J. A Zagzebski , Essentials of ultrasound physics, St Louis, Mo: Mosby,
1996.
[3] R.A. Mucci, “A Comparison of Efficient Beamforming Algorithms,” IEEE Trans. Acoustics, Speech, And Signal Proc., vol. 32. pp. 548-558, 1984.
IJSER © 2014 http://www.ijser.org
International Journal of Scientific & Engineering Research, Volume 5, Issue 6, June-2014 490
ISSN 2229-5518
[4] R. Reeder, C. Petersen, “The AD9271-A Revolutionary Solution for Porta- ble Ultrasound,” Analog Dialogue 41-07,Analog Devices, July 2007.
[5] K. E. Thomenius, “Evaluation of Ultrasound Beamformers,” in Proc. IEEE Ultrason. Symp., 1996, pp.1615-1621.
[6] B.D. Steinberg, “Digital beamforming in ultrasound,” IEEE Transactions on Ultrasonics, Ferroelectrics and Frequency Control, vol. 39, no. 6, 1992, pp.716-721.
[7] C. Fritsch, M. Parrilla, T. Sanchez, O. Martinez, “Beamforming with a reduced sampling rate,” Ultrasonics, vol. 40, 2002, pp. 599–604.
[8] S. R. Freeman, M. K. Quick, M. A. Morin, R. C. Anderson, C. S. Desilets, T. E. Linnenbrink, and M. O’Donnell, “Delta sigma oversampled ultrasound beamformer with dynamic delays,” IEEE Trans. Ultrason., Ferroelect., Freq. Contr., vol. 46, 1999, pp. 320–332.
[9] M. Kozak and M. Karaman, “Digital phased array beamforming using single-bit delta-sigma conversion with non-uniform oversampling,” IEEE Trans. Ultrason., Ferroelect., Freq. Contr., vol. 48, 2001, pp. 922–931.
[10] Mawia A. Hassan and Yasser M. Kadah, “Digital Signal Pro- cessing Methodologies for Conventional Digital Medical Ultra- sound Imaging System,” Proc. American Journal of BiomedicalEngi- neering, vol. 3(1), pp. 14-30, USA, 2013
[11] C. Basoglu, R. Managuli, G. York, and Y. Kim, “Computing requirements
of modern medical diagnostic ultrasound machines,” Parallel Computing,
vol. 24, 1998, pp. 1407-1431.
IJSER © 2014 http://www.ijser.org