International Journal of Scientific & Engineering Research, Volume 4, Issue 9, September-2013 819
ISSN 2229-5518
Estimation of Genetic Diversity in Six Lentil (Lens culinaris Medik.) Varieties using Morphological and Biochemical markers
M. H. Madina1, M. E. Haque2, A. K. Dutta3, M. A. Islam4, A. C. Deb5 and B. Sikdar6*
Abstract-Morphological characters and Electrophoretic SDS-PAGE analysis were performed to established genetic diversity for six important lentil varieties of Bangladesh and to elucidate their genetic relationships. Analyses of variance of morphological characters showed significant differences among varieties. The resulted protein banding pattern showed 57.12% polymorphism and could be considered as general biochemical finger print of the lentil. Dissimilarity index reveals maximum dissimilarity between BARI masur-3 and BARI masur-6 when morphological traits were observed but when seed storage protein profile was observed, distantly related varieties showed the lowest similarity were BARI masur-1 and BARI masur-5. Two dendrograms constructed based on UPGMA using both morphological traits data and SDS-PAGE profiles, revealed two main separate genetic clusters. Principal component analyses supported the result of dendrogram, which proved that BARI masur-1 and BARI masur-5 is the most distant variety among six. So these two varieties can be considered as valuable gene resources for further breeding programs.
Index Terms- Genetic diversity, Lentil, Morphological marker, Protein profiling, UPGMA
--------------------------------------------------------------------------------------------------------------------------------------------------------------------------
1 INTRODUCTION
Lentils are one of the oldest and an important seed legume crops, cultivated worldwide as human food. It is a self pollinated diploid (2n=14) [1] crop with a relatively large genome of 41063 Mbp [2]. It is cultivated mainly for its seed and only red cotyledon type is used as food in Bangladesh. Lentil seeds are valued as a food of both high quality plant proteins (26%) and fiber, in addition, the remaining plant residues can be used as animal feed and fodder for livestock and play an important role in crop rotations because their nitrogen fixing capability. Besides that sprouted lentils now have a reputation as “human food”.
Epidemiological studies suggested that lentils have antioxidant, anticancer and probiotic activity which confer protection against some important chronic diseases [3, 4]. In Bangladesh, production of major food crops such as rice wheat does not meet the present requirements of countries population of about 134 million. Agricultural scientists are faced with the complex and urgent task of bringing the “population-food supply” equation into rational balance. Rice and wheat have been the focus of concerned government effort in research and development. Similar attention was long overdue for the pulse crops, commonly known as poor man’s meat.

M. H. Madina1, M. E. Haque2, M. A. Islam4 & B. Sikdar6: Prof. Joarder DNA and Chromosome Research Lab., Dept. of Genetic Engineering and Biotechnology, University of Rajshahi, Rajshahi 6205, Bangladesh
A. K. Dutta4 & A. C. Deb5: Biometrical Genetic Lab., Dept. of Genetic Engineering and Biotechnology, University of Rajshahi, Rajshahi 6205, Bangladesh
*Corresponding author; Professor & Lab Head, Prof. Joarder DNA
and Chromosome Research Lab., E-mail: bsikdar@yahoo.com
Pulses mainly lentils are vital components in diversification of Bangladesh are predominantly rice-based cropping system. Genetic variation between and within populations of crop species is a major interest of plant breeders and geneticists [5] because it facilities the efficient sampling and utilization of germplasm resource [6]. The breeders must have the idea of choosing the accession that most likely possesses the trait of interest. The knowledge of genetic variation and relationships between populations is important to understand the available genetic variability and its potential use in breeding programs. There are several methods to study genetic diversity such morphological, biochemical and molecular markers. Morphological characterization is the first step in the classification and description of any crop germplasm [7, 8] which is a traditional and one of easiest method for traditional plant breeders in selecting the desirable traits. Considerable variations among the characters for use in breeding and selection programmes have been reported for various morphological characters [9, 10 and 11]. Many workers have been reported on genetic variation in lentil through morphological characters [12, 13] and seed storage protein profile [14, 15, 16 and 17]. Among biochemical techniques SDS-PAGE is widely used due to its simplicity and effectiveness for describing the genetic structures of crop gerplasm [18, 19 and 20]. Seed storage proteins profiling provides aid for identification and characterization of diversity in crop varieties and their wild varieties and phylogenetic relationship of the varieties, generating pertinent information to complement evaluation and passport data [21]. Traditional breeding method is very much important for crop improvement but they proved to be slow in targeting complex trait like grain yield, grain quality and drought or salinity tolerance. Plant descriptors coupled
IJSER © 2003 http//www.ijser.org
International Journal of Scientific & Engineering Research, Volume 4, Issue 9, September-2013 820
ISSN 2229-5518
with biochemical markers as well as seed storage protein provide a valid evidence of diversity as these are least affected by environmental fluctuations [22, 23 and 24]. The main objective of our research was to estimate the potential of SDS-PAGE technique and morphological characters analysis to assess genetic diversity and relatedness among six lentil varieties grown in Bangladesh based on seed storage protein profile and morphological characters to develop an optimized and efficient operational system for their use.
2 MATERIALS AND METHODS
2.1 Plant Materials
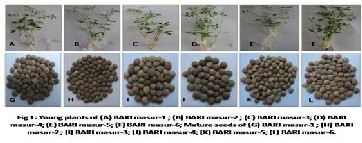
In this study, we used six lentil varieties such as BARI
masur-1(Fig 1A), BARI masur-2 (Fig1b), BARI masur-3 (Fig
1C), BARI masur-4 (Fig 1D), BARI masur-5 (Fig 1E) and BARI masur-6 (Fig 1F) as a plant material for morphological characters analysis which were collected from Biometrical Genetics Laboratory, University of Rajshahi, Bangladesh. Matured seeds of BARI masur-1 (Fig 1G), BARI masur-2 (Fig 1H), BARI masur-3 (Fig 1I), BARI masur-4 (Fig 1J), BARI masur-5 (Fig 1K) and BARI masur-6 (Fig 1L) were used for total seed storage protein profile, which were collected from six lentil varieties after harvesting.
2.2 Morphological Analysis
The plants were sown in the field following Randomized complete block design in the year 2012 in order to obtain the morphological parameters were measured for each lentil varieties viz. date of first flower (DFF), plant height at first flower (PHFF), number of primary branches at first flower (NPBFF), number of secondary branches at first flower (NSBFF), date of maximum flowers (DFF), plant height at maximum flowers (PHFF), number of secondary branches at maximum flowers (NSBMF), individual plant weight (IPW), pod number per plant (PdNPP), pod weight per plant (PdWPP), seed number per plant (SNPP) and seed weight per plant (SWPP).
2.3 Electrophoresis Analysis (SDS-PAGE)
Total seed proteins were extracted from 2 gm matured seeds using protein extraction buffer that containing 0.1 M Tris and pH 7.5 was adjusted. First of all seed coats were removed and seeds were crushed with buffer in morter pestle. Transfer it to eppendorf tube and supernatant was
collected and sample was taken in a water bath at 940 C for
4-5 min. The extracted protein was separated by
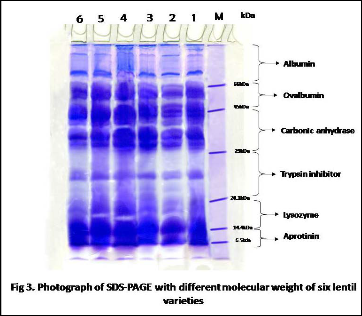
centrifuging the sample at the rate of 13000rpm gradually for 20 min; 45 min and 60 min and finally supernatants were heated in water bath for at 900 C for 5 min prior to loaded on gel. Samples were prepared by mixing 15 µl of extracted protein with loading dye of mercaptoethanol, 0.1% bromophenol blue, 1.5 M tris-Hcl (pH 6.8) containing 15% glycerol, 10% SDS and 8 M urea. The SDS-PAGE was carried out [25] and protein staining was performed using Coomassie Blue [26]. SDS-PAGE was performed with12% separating gel and 5% tacking gel. A vertical slab gel electrophoresis system (SLAB GEL SYSTEM, BIOTECH, YERCAUD-636601) was used. Electrophoresis was carried out at 15v/c for staking gel and 12 v/c for resolving ge. After complete the electrophoresis the gel was stained in Coomassie Brilliant Blue G-250 (1%) and 10% glacial acetic acid for 1 hour and destaining was done in a solution containing 35% methanol and 10% glacial acetic acid by gently shaking until the deep blue background colour disappeared and protein bands were clearly visible. A standard Acculadder molecular weight marker (low range) consisting of albumin (66kDa), ovalbumin (45 kDa), carbonic anhydrase (29kDa), trypsin inhitor (20.1 kDA), lysozyme (14.4 kDa) and aprotinin (6.5 kDa) was for calculating the molecular weights of different protein bands.
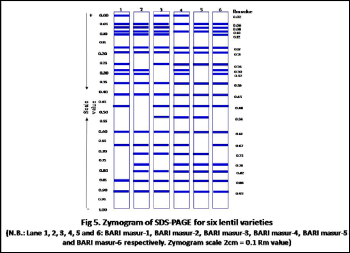
Photographs were taken of gels and zymograms were drawn manually by relative mobility (Rm) of each of the band. Relative mobility (Rm) was measured by the following formula.
Relative mobility (Rm) = 
2.4 Morphological Data Analysis
The collected data were analyzed by two way analysis of variance (ANOVA) and with the obtained values we calculated a matrix of Euclidian distance between the six lentil varieties from the standaadized trait mean values over each varieties using NTSYSpc software version 2.11 [27].Similarly, the standardized trait mean values of each variety were used to perform cluster analysis with the same software.
2.5 Protein Data Analysis
The bands were visually scored as present (1) or absent (0) for seed storage protein gel. Genetic similarities were calculated by Jaccard method [28]. The Jaccard similarity coefficient was used to build an unweighted pair-group method with arithmetic means (UPGMA) clustering procedure of Nested (SHAN) clustering methods [29] and NTSYSpc version 2.11T [27] was used for genetic similarity computing, dendrogram construction and principal component analysis (PCA).
3 RESULTS AND DISCUSSION
IJSER © 2003 http//www.ijser.org
International Journal of Scientific & Engineering Research, Volume 4, Issue 9, September-2013 821
ISSN 2229-5518
Great variations were observed both in qualitative and biochemical characters among six experimental varieties of lentil belong to family Fabaceae. In this present investigation, analysis of variance (ANOVA) of twelve morphological characters showed significant result of six lentil varieties for all the characters (Table 1), which indicating varieties are significantly different from each other. The same result reported in lentil [30, 31 and 32]. Significant variation was found both in cultivated and in wild species of sesamum [33, 34] found. The result of morphological evaluation of the characters showed significant genetic variation of different yield and yield contributing characters in the varieties indicating the scope and their warranty to use in the breeding programmes [35]. Genetic dissimilarity was calculated as Euclidian distance to study genetic variability among varieties for morphological characters and it was ranged from 0.10 to 0.87 (Table 2). Based on Euclidian distance, BARI was noted to be closely related with BARI masur-6 and showed the highest dissimilarity value 0.87. On the other hand, lowest genetic dissimilary relation could be noticed between BARI masur-1 vs. BARI masur-4. Eucliance distance also reported to construct dendrogram in lentil [30]. The genetic distance analysis using unweighted pair group method of arithmetic means (UPGMA) dendrogram was constructed for measuring genetic diversity and relatedness among the accessions (Fig 2). Cluster analysis indicated the extent of genetic diversity that is a practical use in plant breeding [14]. According to morphological dendrogram, it was observed that the varieties were grouped in two clusters: cluster-I and cluster-II (Fig 2). The biggest group cluster-II contained five varieties viz. BARI masur-2, BARI masur-3, BARI masur-4, BARI masur-5 and BARI masur-6, while cluster-I comprised only one varieties (BARI masur-1). From the dendrogram it was cleared that highest variation was formed between BARI masur-3 and BARI masur-6. The results indicate that low or high genetic distance exists respectively between varieties with similar or different origins. UPGMA dendrogram was also used for measuring genetic distance in lentil [30, 31].
Seed proteins have been successfully used to study the variation of seed storage protein in lentil [14, 36]. To find out intervarietal correlation between cultivars, several earlier workers [23, 37] made protein profiling study through SDSPAGE and find almost same observations. Present investigation revealed that protein profiling is one of the basis and reliable methods to detect intervarietal genetic diversity and study phylogenetic relationship among the six lentil varieties. When bands of all varieties were compared, we obtained a total of twenty one bands. Out of them twelve were polymorphic with 57.12% polymorphism (Fig 4). The bands were detected at approximately molecular ranging between 6.5 and 66 kDa and was divided into six regions with intervals of molecular markers (Fig 3).Region I was for albumin protein, had seven bands of more than 66 kDa of which with were polymorphic. Region II was for ovalbumin protein, ranged from 45 kDa to 66 kDa with three protein peptides, of which two were polymorphic. Region III was for carbonic anhydrase protein, ranged from 29 kDa to 45 kDa
with three protein subunits, of which one were polymorphic. Region IV was trypsin inhibitor, ranging from 20.1 kDa to 29 kDa, had four protein bands of which three were polymorphic. Region V was for lysozyme ranged from 14.4 to 20.1 kDa, had two bands and all are polymorphic. Region VI was for aprotinin, ranging from 6.5 kDa to 14.4 kDa had two bands, which was monomorphic. From six type of seed storage protein, albumin protein was abundant in quantity in all the varieties and as well as all the varieties were polymorphic for lysozyme protein.
44 bands were polymorphic among 46 bands with 95.6% polymorphism in lentil [17], 100% polymorphic were reported in oryza sativa L. [38] and 100% polymorphism were found in different five species of Solanaceae [39]. 24 bands were found in lentil [36] in which only five bands were polymorphic with molecular masses ranging from 35 to 116 kDa where 55 protein bands were recorded in lentil [15] ranging from the molecular mass of 14-66 kDa. Out of them 13 bands were polymorphic in nature and they concluded that SDS-PAGE alone did not exhibit high level of intra-specific variation. The relative mobility of seed storage protein was measured ranging from 0.02 to 0.92 (Fig 5). The highest polymorphic bands were found in BARI masur-5 at the position of relative mobility 0.02, 0.12, 0.30,
0.67 and the lowest polymorphic bands were found in BARI masur-4 which exhibited only two polymorphic bands at position 0.07 and 0.12. BARI masur-1 was similar to BARI masur-2 and BARI masur-3 was similar to BARI masur-6 in band number.
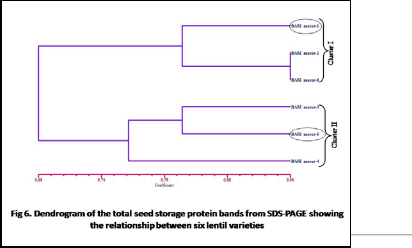
Genetic similarity was analyzed based on Jaccard’s similarity coefficient and it was ranged from 0.57 to 0.90. BARI masur-2 was noted be closely related with BARI masur-6 with the highest similarity coefficient 0.90. On the other hand the highest distant relation i.e. the lowest similarity coefficient could be noticed between BARI masur-
1 vs. BARI masur-5, proceeded by BARI masur-2 vs. BARI
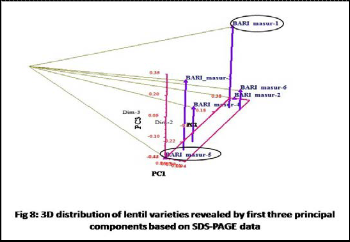
masur-3 and BARI masur-2 vs. BARI masur-5. Dendrogarm was constructed and which showed two main clusters of six lentil varieties. First cluster comprised BARI masur-1, BARI masur-2 and BARI masur-6 and second cluster comprised BARI masur-3, BARI masur-4 and BARI masur-5.Finally Principal component analysis was done to confirm the result of dendrogram. The first three principal components from PCA accounted for 93.21% of the total variation among varieties. The proportion of principal components PC1, PC2 and PC3 were 77.85%, 9.95% and
5.41% respectively. The two dimensional (2D) and three
dimensional (3D) distribution of PCA supported the results of dendrogram i.e. the highest genetic distance was found between BARI masur-1 and BARI masur-5.

IJSER © 2003 http//www.ijser.org
International Journal of Scientific & Engineering Research, Volume 4, Issue 9, September-2013 822
ISSN 2229-5518

plant Error 15 20.03 1.34

N.B.: * and ** represent significant result at 5% and 1%
significance level
TABLE 1

ANOVA FOR THE TWELVE MORPHOLOGICAL CHARACTERS MEASURED IN SIX LENTIL VARIETIES
TABLE 2
EUCLIDEAN DISSIMILARITY MATRIX AMONG SIX LENTIL VARIETIES BASED ON MORPHOLOGICAL CHARACTERS

Date of first flower
Variety 5 413.55 82.71 5.01** Replication 3 277.94 92.64 5.61**
Error 15 247.38 16.49
BARI
masur-1

BARI
masur-1

0.00
BARI
masur-2
BARI
masur-3
BARI
masur-4
BARI
masur-5
BARI
masur-6
Plant height at first
flower
Number of primary branches at first flower
Number of secondary branches at first flower
Date of maximum flowers
Plant height at maximum flowers
Secondary branches at maximum flowers
Individual plant weight
Pod number per

plant
Pod weight per plant
Seed number per
plant
Seed weight per
Variety 5 104.44 20.88 6.99** Replication 3 0.32 0.10 0.03 NS Error 15 44.89 2.99
Variety 5 8.73 1.74 3.35* Replication 3 0.32 0.10 0.20 NS Error 15 7.82 0.52
Variety 5 13.33 2.66 3.54* Replication 3 0.45 0.15 0.20NS Error 15 11.277 0.7518
Variety 5 394.54 78.90 7.13** Replication 3 158.39 52.79 4.77** Error 15 165.8207 11.05471
Variety 5 115.11 23.02 6.60** Replication 3 2.91 0.97 0.27 NS Error 15 52.28143 3.485429
Variety 5 26.95 5.39 11.26** Replication 3 0.73 0.24 0.51NS Error 15 7.180812 0.478721
Variety 5 43.30 8.66 3.46* Replication 3 10.72 3.57 1.43 NS Error 15 37.46868 2.497912
Variety 5 23903.69 4780.73 3.63* Replication 3 792.37 264.12 0.20 NS Error 15 19750.29 1316.686
Variety 5 35.71 7.14 3.04* Replication 3 5.47 1.82 0.77 NS Error 15 35.17255 2.344836
Variety 5 44471.9 8894.38 3.66* Replication 3 1427.549 475.84 0.196NS Error 15 36394.11 2426.27
Variety 5 23.52 4.70 3.52*
Replication 3 1.45 0.49 0.36 NS
BARI
masur-2
BARI
masur-3
BARI
masur-4
BARI
masur-5
BARI

masur-6
0.78 0.00
0.24 0.15 0.00
0.10 0.34 0.29 0.00
0.85 0.14 0.19 0.29 0.00
0.53 0.50 0.87 0.13 0.42 0.00
IJSER © 2 http//www.ij
International Journal of Scientific & Engineering Research, Volume 4, Issue 9, September-2013 823
ISSN 2229-5518
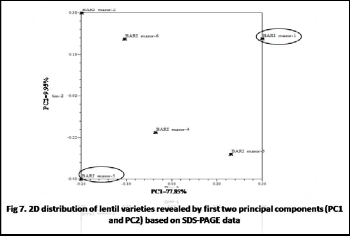
TABLE 3
JACCARD’S SIMILARITY COEFFICIENT MATRIX

AMONG SIX LENTIL VARIETIES BASED ON SEED STORAGE PROTEINS PROFILING
BARI
masur-1
BARI

masur-1
1.00
BARI
masur-2
BARI
masur-3
BARI
masur-4
BARI
masur-5
BARI
masur-6
BARI
masur-2
BARI
masur-3
BARI
masur-4
BARI
masur-5
BARI

masur-6
0.76 1.00
0.76 0.61 1.00
0.71 0.66 0.76 1.00
0.57 0.61 0.80 0.76 1.00
0.85 0.90 0.71 0.76 0.71 1.00
4 CONCLUSION
After all, the two dendrograms based on morphological traits and seed storage protein profiling revealed that BARI masur-3 and BARI masur-6 as well as BARI masur-1 and BARI masur-5 was the distant variety. This difference between two dendrograms can be due to fact the fact that the morphological traits can be influenced by many factors such as: environmental conditions, the sample size, the time of making the measures etc. This study has shown significant genetic variability among the varieties on both morphological and biochemical analysis but the biochemical analysis is more reliable because the varieties are not
SER © 2003
//www.ijser.org
International Journal of Scientific & Engineering Research, Volume 4, Issue 9, September-2013 824
ISSN 2229-5518
influenced by the environmental conditions. So this study demonstrated that determining of genetic variability among six lentil varieties, seed storage protein marker is more precise and reliable than the morphological markers.
5 ACKNOWLEDGEMENTS
The authors are gratefully acknowledged to USDA and MoE, Government of the peoples Republic of Bangladesh for their financial supports. The authors are also grateful to all the members of Professor Joarder DNA and Chromosome Research Lab., Department of Genetic Engineering and Biotechnology, University of Rajshahi, Rajshahi 6205, Bangladesh.
6 REFERENCES
[1] L. Alabboud, Szilagyi, G.V. Roman, “Molecular research on the genetic diversity of lentil genotypes (Lens culinaris) using the RAPD method” Lucrari Stiintifice, Vol 52, 2009, pp
753-757.
[2] K. Arumuganthan and E.D. Earle, “Nuclear DNA content of some important plant species” Plant Molecular Biology Replication, Vol 9, 1991, pp 208–218.
[3] J. Shepherd, S.M. Codde, I. Ford, C.G. Isle, A.R. Loniner, P.W. McFarlane, J.H. Mckillop and C.J. Pachard, “Prevention of coronary heart disease with pravastatin in men with hypercholesterolemia” The New England Journal of Medicine, Vol 333, No. 20, 1995, pp 1301-7.
[4] W.C. Duane, “Effects of legume consumption serum cholesterol, bilary lipids and sterol metabolism in human” Journal of lipid Respiration, Vol, 38, 1997, pp 1120-1128.
[5] M.D. Hayward and E.L. Breese, “Population structure and variability” M.D. Hayward, N.O. Bosemark, I. Romayosa, eds., Plant Breeding: Principles and Prospects, Chapman and Hall, London, pp 7-29, 1993.
[6] A. Maqbool, and D.L. McNeil, “Comparison of crossability, RAPD, SDS-PAGE and morphological markers for revealing genetic relationships within and among Lens species” Theoretical Applied Genetics, Vol 93, 1996, pp-
788-793.
[7] A. Ghafoor, A. Sharif, Z. Ahmad, M.A. Zahid and M.A. Rabbani, “Genetic diversity in Blackgram (Vigna mungo (L.) Hepper)” Field Crop Respiration, Vol 69, 2001, pp 183-190.
[8] H.D. Upadhyaya and R. Ortiz, “A mini core collection for capturing diversity and promoting utilization of chickpea genetic resources in crop improvement” Theoretical Applied Genetics, Vol 102, 2001, 1292-1298.
[9] J.S. Sindhu, H.O. Mishra, Genetic variability in Indian microsperma type lentil. Lens Newsletter, Vol 9, 1982, pp
10-11.
[10] S.R. Ramgiry, K.K. Paliwal and S.K. Tomar, “Variability and correlation of grain yield and other qualitative characters in lentil” Lens Newsletter, Vol 16, 1989, pp 19-
21.
[11] A. Sarker and W. Erskine “Utilization of genetic Resources in lentil improvement. In: Procedings of the Genetic Resources of Field Crops: Genetic Resources Symposium” EUCARPIA, Poznam, Poland, pp 42, 2001.
[12] W. Erskine, and N.A. Choudhary, “Variation between and within lentil landraces from Yemen Arab Republic” Euphytica, Vol 35, 1986, pp 695-700.
[13] W. Erskine, Y. Adham and L. Holly, “Geographic distribution of variation in quantitative traits in a world lentil collection” Euphytica, Vol 43, 1989, pp 97-103.
[14] T. Sultana, A. Ghafoor and M. Ashraf, “Geographic pattern of diversity of cultivated lentil germplasm collected from Pakistanas assessed by protein assays” Acta Biologica Cracoviensia, Series Botanica, Poland, Vol 48,
2006, pp 77-84.
[15] T. Sultana, and A. Ghafoor, “Genetic diversity in ex- situ conserved Lens culinaris for botanical descriptors, biochemical and molecular markers and identification of landraces from Indigenous Genet Resource” Pakistan of Journal Integration of Plant Biology, Vol 50, 2008, pp 484-
490.
[16] A. Ghafoor and M. Arshad, “Seed protein profiling of Pisum sativum (L) germplasm using Sodium dodecyl sulphate polyacrylamide gel electrophoresis (SDS-PAGE) for investigation of biodiversity” Pakistan Journal of Botany, Vol 40, No. 6, 2008, pp 2315-2321.
[17] G.N. Sheikh, S. Ahmad and R. Kudesia, “Estimation of Genetic Diversity in Lentil (Lens Culinaris) Using Protein Profiling and RAPD” International Journal of Current Research, Vol 3, No. 12, 2011, pp 017-021.
[18] R.W. Murphy, J.W. Sites, D. Buth and C.H. Haufler, “Protein and isozyme electrophoresis” D.H. Hillis and C. Moritz, eds., Molecular Systematics, Sinauer Assoc, Sunderland, MA, pp
45-126 1990.
[19] A. Javaid, A. Ghafoor and R. Anwar, “Seed storage proteın electrophoresıs in groundnut for evaluating genetic diversity” Pakistan Journal of Botany, Vol 36, No. 1, 2004, pp 25-29.
IJSER © 2003 http//www.ijser.org
International Journal of Scientific & Engineering Research, Volume 4, Issue 9, September-2013 825
ISSN 2229-5518
[20] F. Anwar, M.I. Bhanger and T.G. Kazi, “Relationships of Rancimat and AOM values at varying temperatures for several oils and fats” Journal of America Oil Chemistry Socity, Vol 80, No. 2, 2003, pp 151-155.
[21] R.H. Sammour, “Using electrophoretic techniques in varietal identification, biosystematic analysis, phylogenetic relations and genetic resources management” Journal of Islamic Academy Science, Vol 4, No. 3, 1991, 221-226.
[22] M. Ahmad, A.G. Fautrier and D.J. Burritt, “Genetic diversity and relationship in Lens Species and their interspecific hybrids as revealed by SDS-PAGE”, New Zealand Journal of Crop and Horticulture Science, Vol 25, No. 2, 1997, pp 99-108.
[23] S.S. Jha and D. Ohri, “Phylogenetic relationships of Cajanus cajan (L.) Mill sp. (Pigeonpea) and its wild relatives based on seed protein profiles” Grace, Vol 43, 1996, 257-
281.
[24] E. Margale, Y. Herve, J. Hu, C.F. Quiro, “Determination of genetic variability by RAPD markers in cauliflower, cabbage and kale local cultivars from France” Genetic Respiration Crop Evolution, Vol 42, 1995, pp 281-289.
[25] U.K. Laemmli, “Cleavage of structural proteins during the assembly of the head of bacteriophage T4 ” Nature, Vol
227, 1970, 680-685.
[26] Hames and Rickwood “Gel electrophoresis of proteins, a practical approach” second edition, Oxford University press, pp 1-147, 1990.
[27] F. Rohlf, “NTSYS-pc numerical taxonomy and multivariate analysis system” version 2.11T, New York, Exeter Software, 2004.
[28] P. Jaccard, “Nouvelles recherches sur la distribution florale” Bull La Socit Vaudoise Sci Nat, Vol 44, 1908, pp
223-270.
[29] R.R. Sokal and P.H.A. Sneath, “Principles of numerical taxonomy. Freeman San Francisco” pp 359, 1963.
30. E. Fikiru, K. Tesfayeand and E. Bekele, “A comparative study of morphological and molecular diversity in Ethiopian lentil (Lens culinaris Medik.) landraces” African Journal of Plant Science, Vol 4, No. 7, 2010, pp 242-254.
[31] S. Roy, M.A. Islam, A. Sarker, Malek, M.Y. Rafii and M.R. Ismail, “Determination of genetic diversity in lentil germplasm based on quantitative traits” Australian Journal of Crop Science Vol 7, No. 1, 2013,14-21.
[32] B.A. Malik, M. Tahir, A.M. Haqani and R. Anwar, “Documentation, characterization and preliminary evaluation of lentil (Lens culinaris) germplasm in Pakistan” LENS Newsletter, Vol 11 No. 2, 1984, 8-11.
[33] E. Ercan, I. Tengiz, C. Duman, O.A. Onbasili and N. Baris, “The effect of tirofiban on C-reactive protein in non- ST-elevation myocardial infarction” American Heart Journal, Vol, 147, No. 1, 2004, pp 1-5.
[34] K.M.S. Raghuwanshi, “Study of genetic variability in sesame (Sesamum indicum L.)” Journal Maharashtra Agriculture University, Vol 30, No. 3, 2005, pp 264-265.
35. A. Tullu, I. Kusmenoglu, K.E. McPhee and F.J. Muehlbauer, “Characterization of core collection of lentil germoplasm for phenology, morphology, seed and straw yields” Genetic Resource Crop Evolution, Vol 48, 2001, pp
143-152.
[36] E. Yüzbaşioğlu, L. Açik and S. Özcan, “Seed protein diversity among lentil cultivars” Biology of Plant, Vol 52, No.
1, 2008, 126-128.
[37] G. Ladizinsky, “The origin of lentil and wild gene pool” Euphytica, Vol 28, 1979, 179-187.
[38] S. Galani, F. Naz, F. Sromro, I. Jamil, Zia-ul-hassan, A. Azhar and A. Ashraf, “Seed storage protein polymorphism in ten elite rice (Oryza sativa L.) genotypes of Sindh” African Journal of Biotechnology, Vol 10, No. 7, 2010, pp
1106-1111.
[39] T.M. Bhat and R. Kudesia, “Evaluation of genetic diversity in high different species of family solanaceae using cytological characters and protein profiling” Genetic Engineering and Biotechnology Journal, Vol, 20, 2011, pp
20-25.
IJSER © 2003 http//www.ijser.org


