International Journal of Scientific & Engineering Research Volume 4, Issue 1, January-2013 1
ISSN 2229-5518
Enhancement of Power System Voltage Stability Using
SVC and TCSC
Deepa Choudhary
Department of electrical engineering
4th sem M.E High Voltage, J.E.C Jabalpur,M.P., India
Deepa828choudhary@gmail.com
Abstract— Voltage stability analysis is essential for a secure power system operation. A lot of works have been developed for this analysis method to improve voltage stability. This paper investigates the enhancement of voltage stability using base case and FACTS devices. The objective of this paper is to enhance voltage stability based on static analysis. The continuation power flow methods are proposed in case of
the increasing loading of contingency. The WSCC 9 bus system is
simulated to test the increasing load ability. The advantage of this simulated method is to develop a simple, fast and convenient procedure which can be applied effectively to enhance the voltage stability.
Keywords— steady state voltage stability, SVC, TCSC, MATLAB, PSAT
I. INTRODUCTION
Many analysis methods of voltage stability determination have been developed on static analysis techniques based on the power flow model since they are simple, fast and convenient to use. These techniques have been practically viable that the voltage collapse is a relatively slow process thus being primarily considered as a small signal phenomenon. Traditionally, it is known that voltage collapse leads to the reason for several blackouts that have occur throughout many areas. The major reasons for voltage collapse are based on increasing loading, large disturbance and line outage. There are many papers investigate voltage stability on dynamic analysis, static analysis and sensitivity characteristics [1-3]. The dynamic analysis [2-3] emphasizes on large disturbance or transient stability occurrence. However, static analysis is considered as a small signal phenomenon, load increasing and line outage. Thus, lot of work is carried out to determine voltage stability on static analysis instead. Generally, when online dynamic voltage stability is not available, static techniques may involve a conventional power flow study. The problem of conventional power flow analysis is the Jacobian of a Newton-Raphson power becomes singular at the steady state voltage stability limited. In this paper, the continuation power flow locates a critical voltage point in P-V curve. The FACTS devices, TCSC & SVC is proposed to compensate the transfer capability of transmission line. The advantages of FACTS are transient stability, voltage stability, and increase or decrease reactive power and voltage adjustment.
II THE CONTINUATION POWER FLOW ANALYSIS
The conventional power flow has a problem in the Jacobian matrix which becomes singular at the voltage stability limit. The voltage stability limit is also called critical voltage or critical point. The continuation power flow analysis uses iterative predictor and corrective steps (Fig. 1). The predictor step will start from point A, which the estimate solution is obtained from tangent of ABC triangle. Then corrector step determines the solution by using conventional power flow.
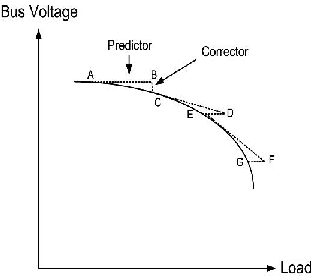
The further increase in load voltage is then predicted on a new tangent predictor.
Fig.1.The predictor – corrector scheme used in the continuation power flow.
The load flow equation consists of load factor (/c) can be written as [4]
F (o, V, A) = 0 ……………… (1) Where
/c = the load parameter,
o = the vector of bus voltage angle, and
V = the vector of bus Voltage magnitude.
From the Newton-Raphson load flow calculation is expressed as:
IJSER © 2013 http://www.ijser.org
International Journal of Scientific & Engineering Research Volume 4, Issue 1, January-2013 2
ISSN 2229-5518


… (2)
The system has N node and Nq number of source including slack bus. The total number of equation equal 2N -Nq - 1.
The new load flow equations consists of load factor (A) are
expressed as:


….. (3) Where
PLi, QLi = the active and reactive power respectively, KLi = the constant for load changing at bus I, and
Sl1base = the apparent power which is chosen to provide
appropriate scaling of A
Then the active power generation term can be modified to
PGi = PGo (1 +AKGi)………………………... (4)
Where
PGo = the initial value of active power generation, PGi = the active power generation at bus i, and
KG i = the constant of changing rate in generation
A. Predictor step
In the predictor step, a linear approximation is used to estimate the next solution in order to adjust the state variables.
Taking the derivative of both side of F (o, V, A) = 0
it can be expressed as:
Fo do + FVdV + F/c d/c = 0…………………… (5)
 =0 ………………….…………….. (6)
B .Corrector step


The load flow equations are selected by
…………………… (7)
Where xk = the state variable selected as continuation
Parameter at k iterative and
1 = the predicted value of xk.
III. THYRISTOR CONTROLLED SERIES COMPENSATION (TCSC)

TCSC is the type of series compensator. The structures of TCSC are capacitive bank and the thyrister controlled inductive brunch connected in parallel as shown in Fig. 2. The principle of TCSC is to compensate the transmission line in order to adjust the line impedance, increase load ability, and prevent the voltage collapse.
Fig. 2. The basic structure of TCSC
The characteristic of the TCSC depends on the relative reactance of the capacitor bank and thyristor branch. The resonance frequency ( ffir ) of LC is express as:


............................... (8)
The principle of TCSC in voltage stability enhancement is to control the transmission line impedance by adjust the TCSC impedance. The absolute impedance of TCSC Which can be adjusted in three modes
Blocking mode: The thyristor is not triggered and TCSC. is operating in pure capacity which the power factor of TCSC is leading.
By pass mode: The thyristor is operated in order to XL =XC. The current is in phase with TCSC
Voltage.
IJSER © 2013 http://www.ijser.org
International Journal of Scientific & Engineering Research Volume 4, Issue 1, January-2013 3
ISSN 2229-5518
Capacitive boost mode: XC > XL, and then Inductive mode:
XL>XC, respectively.
IV. SIMULATION WITH SVC
Consider the figure 3 is the equivalent circuit of TCR .It represents the one phase of SVC used on 735 kv transmission line network. On the secondary of the 735kv/16 kv transformer parallel one TCR branch connected in parallel.
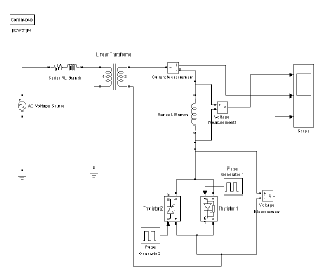
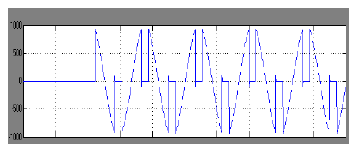
Fig. 3 SVC circuit developed in MATLAB Voltage across reactor (VL)
Firing angle [rad] Current through thyristor (ITCR)
Firing angle [rad]
Voltage across thyristor (VTCR)
Firing angle [rad]
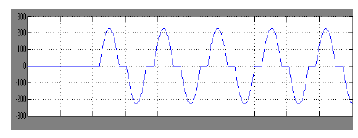
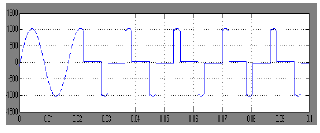
Fig .4 current and voltage for a=120° in TCR
In the above fig 4 current and voltage waveform are shown the firing angle of 120° .only part of sinusoidal voltage is applied to inductor, the current and voltage waveform are not sinusoidal voltage.
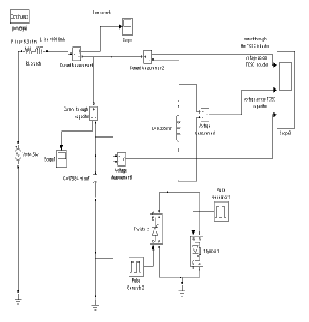
Fig .5 TCSC circuit developed in MATLAB. V.SIMULATION WITH TCSC
In the fig 5 the following parameter: C =176.84!-F,L=6.8mH
,R line = 15.3Q ,Vs=64.5 KV and
w =120n rad/sec. the steady state resonant point is reached at
the value of a for which Xv=Xc i.e ares=136°.
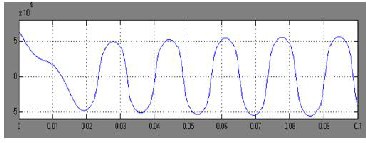
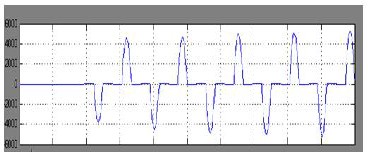
The circuit is energize from zero initial conditions leading to switch on dynamics during the first cycle .the transient settle down in 3 cycles for a firing angle in inductive region
.i.e a=120°(fig .6).the startup strategy with the TCSC being energize to inductive region .For the inductive control.
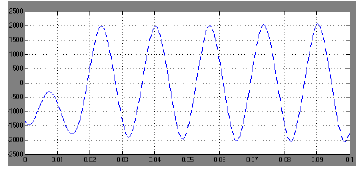
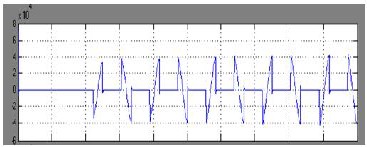
One can observe that capacitor voltage highly distorted (fig
.7).but the line current close to sinusoidal. These results are consistent with those for the kayenta TCSC.
IJSER © 2013 http://www.ijser.org
International Journal of Scientific & Engineering Research Volume 4, Issue 1, January-2013 4
ISSN 2229-5518
Line current
Firing angle [rad]
Fig .6 line current for a=120°.
Current through the TCSC inductor
Voltage across TCSC inductor
Voltage across TCSC capacitor
Firing angle [rad]
Fig .7 steady state capacitor voltage and inductor current and voltage for a=120°.
VI .THE SIMULATION
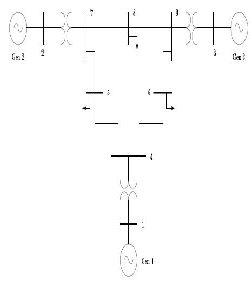
Fig 8.WSCC 9 bus test system
An WSCC 9 bus test system and this test system including 9 buses ,3 generators ,6 lines ,3 transformers and 3 loads is simulated using PSAT .and used to try models and control strategies is presented. The generators are modeled as standard PV buses with both P and Q limits; loads are represented as constant PQ loads. The P and Q load powers are not voltage dependent and are assumed to change as follows [5].

 =
= …………………………..(8)
Where PLo and QLo are the active and reactive base loads. Whereas PL and QL are active and reactive loads at bus L for the current operating point as defined by /c.
IJSER © 2013 http://www.ijser.org
International Journal of Scientific & Engineering Research Volume 4, Issue 1, January-2013 5
ISSN 2229-5518
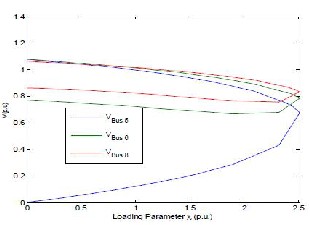
Fig. 9 base case continuation power flow
The profile of the bus voltage magnitudes with the variation in loading are plotted with the use of continuation power flow
and it is shown in fig 9 For the base case the bifurcation point or the maximum loading point where the system jacobion singular is at /c =2.505 p.u,which is equivalent to Pbif =730
MW
In the continuation power flow analysis the element of tangent vector represents differential changes in the state variables in responds to a differential changes in system load. the dv elements of the tangent vector are useful in identifying “weak buses “ that is ,buses which experienced large voltage
variation in respond to change in load .
Voltage sensitivity factor to find the weak bus on the system

VII. RESULTS WITH SVC
In WSCC 9 bus system based on voltage factor above bus 5, 6, and 8 identified as a weakest buses needing Mvar support.
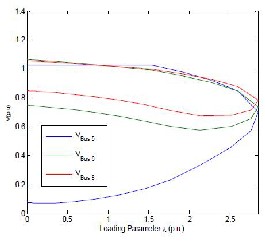
Fig 10. P-V curve for SVC connected at bus 5
As per the above P-V curve SVC connected at bus 5 to improve steady state voltage stability of the system .the new maximum loading condition is the /c= 2.8448 p.u which is equivalent to
Pbif = 869 MW.
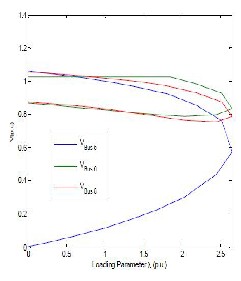
Fig 11. P-V curve for SVC connected at bus 6
As above P-V curve SVC connected at bus 6 to improve steady state voltage stability of the system .the new maximum loading condition is the /c= 2.6501 p.u which is equivalent to Pbif = 834 MW
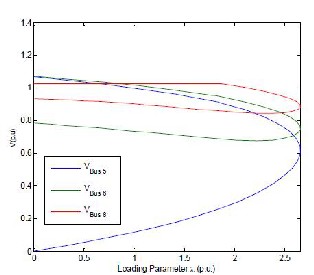
Fig 12. P-V curve for SVC connected at bus 8
As per the above P-V curve SVC connected at bus 8 to improve steady state voltage stability of the system .the new maximum loading condition is the /c= 2.6517 p.u which is equivalent to
Pbif = 835 MW
IJSER © 2013 http://www.ijser.org
International Journal of Scientific & Engineering Research Volume 4, Issue 1, January-2013 6
ISSN 2229-5518
VIII. CONCLUSION
The results presented in this paper clearly show how SVC and TCSC can be used to increase system stability in practical power systems with the use of simulink model. The effects on static voltage collapse or maximum loading level are presented. Based on simulation results obtained in the paper can based on that, base case continuation power results are obtained and the SVC can improve the steady state voltage stability by placing of different location .
IX. REFERENCES
1. G. M. Huang, L. Zhao and X. Song, “A New Bifurcation Analysis for Power System Dynamic Voltage Stability Studies,” IEEE Power
2. R. Natesan and G. Radman,“ Effects of STATCOM, SSSC and UPFC on Voltage Stability,” Proceedings of the system theory thirty- Sixth southeastern symposium, pp. 546-550,
2004
3. P. Kundur, Power System Stability and Control , McGraw- Hill Inc., 1994
4. Nitin boompirom and kitti “static voltage stability enhancement sing FACTS devices”.
5 Federico Milano, Power System Analysis Toolbox
Documentation for PSAT, version 1.3.2, 2004.
IJSER © 2013 http://www.ijser.org


