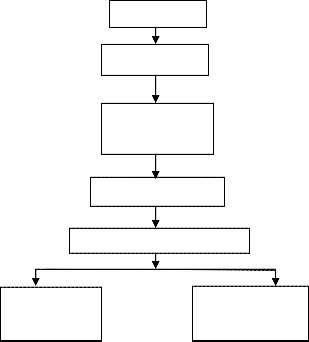
The EMG signal classification involved four step, preprocessing, singular value decomposition, feature Extraction and classification using neural network classifier. The block diagram of proposed method shown in the Fig. 1
International Journal of Scientific & Engineering Research, Volume 4, Issue 6, June-2013 956
ISSN 2229-5518
EMG Signals classification based on singular value decomposition and neural network
Mukesh Patidar | Nitin Jain | Piyush Agrawal |
PG scholar | Lecturer | Lecturer |
Department of ECE | Department of ECE | Department of ECE |
MIT, Mandsaur | MIT, Mandsaur | MIT, Mandsaur |
mukesh.patidar14@gmail.com | nitin.jain@mitmandsaur.info | piyush.agrawal@mitmandsaur.info |
EMG signals, Singular value decomposition, Neural network classifier, Myopathy.
The electromyogram (EMG) signals collected via surface electrodes have provided invaluable insight into the structure and function of skeletal muscle. Amplitude and frequency content of these signals aid in the identification and understanding of the physiology of muscle activity, muscle fatigue, and muscle pathology. Frequently used spectral parameters, such as mean and median power frequencies, are derived via Fourier analysis from the EMG signal [l], and are typically used to track muscular changes which occur in fatigue, during ischemia, and as a result of muscle temperature variation [2].
Nevertheless, the measurement of the duration parameter is a
complicated task depending on the neurophysiologist and/or the computer-aided method used. The description of an extensively accepted criterion that will allocate the computer-aided measurement of this parameter is still absent [3]. On the other hand, frequency domain features of MUPs like the mean or median frequency, bandwidth and quality factor give supplementary information for the assessment of neuromuscular disorders and it has recently been shown that the discriminative power of the MUP mean or median frequency is comparable to
the duration measure [4] or the spike duration measure [5].
Recent advances in computer technology have made automated EMG analysis feasible. Although a number of computer-based quantitative EMG analysis algorithms have been developed, some of them are commercially available, practically none of them have gained broad acceptance for widespread routine clinical use. The autoregressive and cepstral analyses combined with time domain analysis in classification of EMG signals [4]. Also [6] described how the proper use of the wavelet cross- correlation analysis on surface signals of the above two different muscles allows a more comprehensive classification of subjects and, at the same time, a reliable temporal evolution analysis of Parkinson’s disease.
In [7], used MUP parameters as input to a sequential parametric
pattern recognition classifier. In [8], used eight MUP features as input to a statistical pattern recognition technique for classification. The decomposition of superimposed waveforms used a combination of procedural and knowledge-based methods. Finally [9-10] proposed a system called neural network extraction of repetitive vectors for electromyography (NNERVE), and they used the time domain waveform as input to a three-layer artificial neural network (ANN) with a “pseudo unsupervised” learning algorithm for classification. [11] used two different pattern recognition techniques for the classification of MUPs. They used an artificial neural network (ANN) technique based on unsupervised learning, using a modified version of the self-organizing feature maps (SOFM) algorithm and learning vector quantization (LVQ) and a statistical pattern recognition technique based on the Euclidean distance. In addition, [12] used genetics based machine learning as pattern classifiers in EMG. There are numerous limitations in the existing quantitative EMG analysis methods, which limit their wider applicability in clinical practice. Due to a complexity and non-stationarity of sEMG, a large number of studies have focused on the investigation and evaluation of the optimal features obtained from wavelet coefficients [13–16].
In this paper, we present a new method based on singular value decomposition for classification of normal and myopathy EMG signals. The EMG signals represent in matrix form and singular value decomposition used to extract singular value form the matrix representation of EMG signals. The singular value features used as an input to neural network classifier for classification of normal and myopathy EMG signals. The rest of
IJSER © 2013 http://www.ijser.org
International Journal of Scientific & Engineering Research, Volume 4, Issue 6, June-2013 957
ISSN 2229-5518
the paper is organized as follows: The dataset, pre-processing for matrix representation, the singular value decomposition and back propagation neural network classifier are presented in Section 2. The experimental results and discussion for the classification of EMG signals based on the proposed method are provided in Section 3. Finally, Section 4 concludes the paper.
The EMG signal classification involved four step, preprocessing, singular value decomposition, feature Extraction and classification using neural network classifier. The block diagram of proposed method shown in the Fig. 1
EMG signals
Preprocessing
Singular value
Decomposition
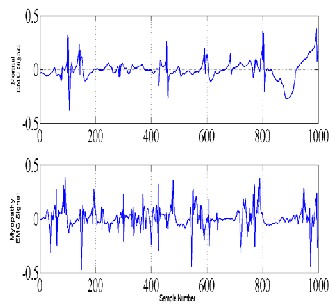
disease, and patient with myopathy due to longstanding history of polymyositis, treated effectively with steroids and low-dose methotrexate [17]. The EMG data were recorded at 50 KHz. healthy EMG data and neuropathic EMG data with each sub-set of 1000 samples were considered for this study. The example of the normal and myopathy EMG signals is shown in Fig. 2.
Normal EMG Signals
Feature Extraction
BP Neural Network
Myopathy EMG Signals
The preprocessing step the signal s[n], where the size of signal is
1000 sample [18]. The EMG signal is non-stationary signal so we assume that in 10 sample signal is stationary. So this EMG signal arrange in the matrix of A is [10×N/10] by using this step the signal is arrange in to a matrix form. The EMG signal can be expressed as:
S11
S12
....................S N
![]()
10
The EMG signal of a normal person and a myopathic patient were collected from the department of neuropathy of Beth Israel Deaconess Medical Center/Harvard Medical School with a
S
21
A = .
.
S 22
....................S
2 =N
10
Medelec™ Synergy N2 EMG Monitoring System [Oxford
Instruments Medical, Old Working, United Kingdom] which
..................................
readily provides rapid quantitative EMG analysis. A 25 mm concentric needle electrode was placed into the tibialis anterior
muscle of these 3 subjects. They were then asked to dorsiflex the
S101 S102 ...............S
10 =N
10
(1)
foot gently against resistance. The needle electrode was repositioned until motor unit potentials (MUP) with a rapid rise time were identified. Then, the data were collected for several seconds. Thus, we have total 2 datasets, one dataset for each category. The example of normal and myopathy EMG signals are shown in the Fig. 1. In this work, we have used the EMG
signal of healthy subject without history of neuromuscular
The SVD algorithm has been commonly used for reducing the noise, which can be defined as an unpleasant signal with small amplitude which randomly varies, added to the signal of interest. Therefore, in this study, the SVD algorithm was applied to the matrix of EMG signal in order to separate the interesting signals from noisy EMG signals and remove noise unnecessarily mixed
IJSER © 2013 http://www.ijser.org
International Journal of Scientific & Engineering Research, Volume 4, Issue 6, June-2013 958
ISSN 2229-5518
within the matrix of EMG signal, instead of adaptive filtering. A singular value decomposition of an M ×N matrix A is of the form,
A= USVT (2)
where U (M×M) and V (N×N) are orthogonal matrices, and S is an M×N diagonal matrix of singular values (SVs) with various components. In S, can be divided into two subspaces, a strong interference subspace and an orthogonal alternate subspace. The strong interference subspace contains the EMG signal of interest, whereas the alternate subspace contains the ambient noise. In this paper, the rank of the matrix (denoted by r) was estimated from the output of the derivative of the normalized SVs with respect to the rank order [19]. Finding the r using the derivative reduces the effect of space intersections on altering the structure of important information in the EMG signal. Given that the derivative is smaller than a predefined threshold, the SVs are considered to be members of Se.
3
2.5
2
1.5
1
0.5
1
0.9
N= Normal EMG signal
M= Myopathy EMG signal
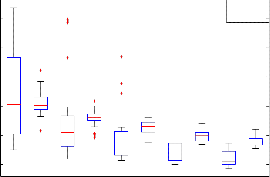
SV1(N) SV1(M) SV2(N) SV2(M) SV3(N) SV3(M) SV4(N) SV4(M) SV5(N) SV5(M)
(a)
N=Normal EMG signal
M=Myopathy EMG signal
Backpropagation (BP) neural networks are widely used nonlinear models for pattern recognition and classification problems. BP is a multilayer perceptron that is composed of several layers of neurons. The error between the desired output and the network output is backpropagated from the output layer to the hidden and input layers to update the weights for network training based on the gradient-descent method. Here, a 3-layer feedforward neural network was utilized, and the number of neurons in the hidden layer was 20. The log-sigmoid function was used as the activation function of the hidden and output layers. The learning constant was 0.1 for network training and iteration number is 2000 for network training [20-21].
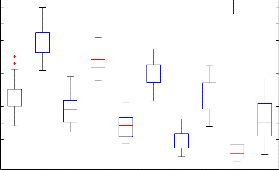
In this study, the EMG signal is represent in the matrix. The matrix of the signal is 10*100 used to find the 10 singular vector by decomposed matrix in to help of singular value decomposition. The singular vector used for classification of normal and myopathy EMG signal by using back propagation neural network. The box plot test has been used to discriminate normal and myopathy EMG signal. The Fig. 3(a) and (b) shows the singular vector for 1 to 5 in (a) and 6 to 10 (b). It is noted that for normal EMG signal the value of singular vector are lesser ass compare to myopathy EMG signal. By using simple threshold it is not possible to classify both classes so that by we used neural network.
0.8
0.7
0.6
0.5
0.4
0.3
0.2
0.1
SV6(N) SV6(M) SV7(N) SV7(M) SV8(N) SV8(M) SV9(N) SV9(M) SV10(N) SV10(M)
(b)
The performance evaluation parameters namely sensitivity, specificity, and accuracy were used. Sensitivity is the probability that the test gives a positive result when abnormal features (i.e., features corresponding to myopathic patients) are tested. The specificity of a test is the probability that a test gives a negative result when normal cases are tested. Accuracy is the ratio of correctly classified samples to the total number of samples used. The whole dataset was divided into two parts. One part used for training (60%) and other part used for testing (40%). The n during the first fold, two parts of the data were used as training data for developing the classifier. The remaining part of the data was used as the test data, and the evaluation parameters, namely, Accuracy, Sensitivity, and Specificity were calculated. This procedure was repeated ten times by using a different test set in each fold. The averages of the performance measures obtained
in each fold were reported as the final performance measures.
SEN (%) =
TP
![]()
TP + FN
×100
IJSER © 2013 http://www.ijser.org
International Journal of Scientific & Engineering Research, Volume 4, Issue 6, June-2013 959
ISSN 2229-5518
SPE(%) =
![]()
ACC (%) =
TN
![]()
TN + FP
TP + TN
×100
×100
[1] Stulen, FB and DeLuca, CJ: Frequency parameters of the
myoelectric signal as a measure of muscle conduction velocity. IEEE Trans Biomed Eng 8515-523, 1981.
TP + TN + FP + FN
Where TP is the true positive, the total number of correctly detected positive events; TN is the true negative, the total number of correctly detected negative events; FP is the false positive, the total number of erroneously positive detection; and FN is the false negative, the total number of erroneously negative detection.
The singular value decomposition process is a useful and powerful method to decompose EMG signal into a set of different singular value. The singular values extracted from the preprocessed EMG signals have been found useful in classification of Myopathy and normal EMG signals. Finally, we conclude that the Singular values are effective for classification of Myopathy and normal EMG signals. The classification results indicated that the neural network had provided 96.75% accuracy in classification of Myopathy and normal EMG signals. Future direction of research may include application of singular value for different psychological states from EMG signals.
[2] Duchene, J., Goubel, F.: Surface electromyogram during voluntary contraction: processing tools and relation to physiological events. Crit Rev Biomed Eng 21(4) 313-397,
1993.
[3] Stalberg E, Andreassen S, Falck B, Lang H, Rosenfalck A, Trojaborg W. Quantitative analysis of individual motor unit potentials: a proposition for standardized terminology and criteria for measurement. J Clin Neurophysiol 3(4):313–48,
1986.
[4] Pattichis CS, Elia AG. Autoregressive and cepstral analyses of motor unit action potentials. Med Eng Phys 21:405–19,
1999.
[5] Pfeiffer G, Kunze K. Frequency analysis and duration of motor unit potentials: reliability and diagnostic usefulness. Elect Clin Neurophrol 89:365–74, 1993.
[6] De Michele G, Sello S, Carboncini MC, Rossi B, Strambi S.
Cross-correlation time–frequency analysis for multiple EMG signals in Parkinson’s disease: a wavelet approach. Med Eng Phys 25:361–9, 2003.
[7] Pattichis CS, Schizas CN, Mittleton LT. Neural network models in EMG diagnosis. IEEE Trans Biomed Eng 1995;
42:486–96.
[8] Loudon GH, Jones NB, Sehmi AS. New signal processing techniques for the decomposition of EMG signals. Med Biol Eng Comput 1992; Nov: 591–9.
[9] Hassoun MH, Wang C, Spitzer AR. NNERVE: neural network extraction of repetitive vectors for electromyography—Part I: algorithm. IEEE Trans Biomed Eng 1994a; 41:1039–52.
[10] Hassoun MH, Wang C, Spitzer AR. NNERVE: neural network extraction of repetitive vectors for electromyography—Part II: performance analysis. IEEE Trans Biomed Eng 1994b; 41:1053–61.
[11] Christodoulou CI, Pattichis CS. Unsupervided pattern recognition for the classification of EMG signals. IEEE Trans Biomed Eng 1999; 46(2):169–78.
[12] Schizas CN, Pattichis CS. Learning systems in biosignal analysis. BioSystems 1997; 41: 105–25.
[13] Chu J. U., Moon I., Lee Y. J., Kim S. K., Mun M. S. A
Supervised Feature–Projection–Based Real–Time EMG
IJSER © 2013 http://www.ijser.org
International Journal of Scientific & Engineering Research, Volume 4, Issue 6, June-2013 960
ISSN 2229-5518
Pattern Recognition for Multifunction Myoelectric Hand Control IEEE/ASME Transactions on Mechatromics. IEEE, 2007. – Vol. 12(3). – P. 282–290.
[14] Wang G., Wang Z., Chen W., Zhuang J. Classification of Surface EMG Signals Using Optimal Wavelet Packet Method Based on Davies–Bouldin Criterion // Medical and Biological Engineering and Computing. – Springer, 2006. – Vol. 44(10). PP. 865–872.
[15] Chan A. D. C., Green G. C. “Myoelectric Control Development Toolbox”, Proceedings of 30th Conference of the Canadian Medical & Biological Engineering Society. –
2007. Vol. 1. PP. M0100-1–M0100-4.
[16] Hu X., Wang Z., Ren X. Classification of Surface EMG Signal Using Relative Wavelet Packet Energy // Computer Methods and Programs in Biomedicine. – Elsevier, 2005. – Vol. 79(3). P. 189–195.
[17] http://www.physionet.org/cgi-bin/atm/ATM.
[18] G. Golub and C. Van Loan, Matrix computation (2nd Ed.) Baltimore, MD; John Hopkins, 1989.
[19] Kirk Baker “Singular Value Decomposition Tutorial” March 29, 2005 (Revised January 14, 2013)
[20] Stuart Russell and Peter Norvig. Artificial Intelligence A Modern Approach. p. 578. "The most popular method for learning in multilayer networks is called Back-propagation. It was first invented in 1969 by Bryson and Ho, but was largely ignored until the mid-1980s."
[21] V. Srinivasan, C. Eswaran, and N. Sriraam, “Approximate entropy-based epileptic EEG detection using artificial neural networks,” IEEE Transactions on Information Technology in Biomedicine, vol. 11, no. 3, pp. 288–295,
2007.
IJSER © 2013 http://www.ijser.org