International Journal of Scientific & Engineering Research, Volume 6, Issue 2, February-2015 396
ISSN 2229-5518
Detection and Segmentation of Ischemic Stroke
Using Textural Analysis on Brain CT Images
Alyaa Hussein Ali, Shahad Imad Abdulsalam, Ihssan Subhi Nema
Abstract— The detection of the brain strokes from Computed Tomography CT images needs convenient processing technique starting from image enhancement to qualify the brain image by isolation process, region growing and logical operators (OR and AND). Morphological techniques (opening and close) with the logical operator produce a good result. These results with the help of the simplest segmentation process, which is the thresholding process, are used to extract a stroke region from the CT image of the brain. The median filter is applied to remove the noise from the image. The statistical features calculated using first-order histogram were utilized in the detection of the stroke region.
Index Terms— Ischemic stroke; CT scan image; Brain segmentation; statistical features.
—————————— ——————————
Medical imaging refers to the techniques and processes which are used to produce images of various parts of the human body for clinical purposes. The quality of
these images plays an important role in the medical field. The success in the diagnosis mainly depends on the accuracy of segmentation algorithm [1, 2]. There are two types of brain stroke; hemorrhage stroke and ischemic stroke [3, 4].
In this paper the stroke is discussed. Ischemic stroke happen when a blood clot blocks the artery supplying blood to the brain. This may occur in two reasons: first one Thrombotic stroke occurs when the artery becomes narrow and the clot is stick on the wall of the artery because of many reasons like fat and cholesterol [5]. The second one Embolic stroke occurs when the clot is stopped the blood vessel in the brain, or comes from other part of the body [3, 4]. Ischemic stroke is a very common disease that affects blood vessels in the brain causing cerebral tissue damage [6]. Computed Tomography (CT) images are widely used to diagnose brain stroke for many reasons, lower cost, sensitiveness to early stroke [1] and non-invasive technique [7].
Andrius U. et. al. describes a new method to segment ischemic
stroke region on computed tomography (CT) images by utiliz-
ing joint features from mean, standard deviation, histogram,
and gray-level co-occurrence matrix methods. Presented un-
supervised segmentation technique shows ability to segment
ischemic stroke region [8]. S. Fueanggan, et. al. resents a new
designed program to initially analyze Ischemic Stroke area
from Computed Tomography Perfusion (CTP) based on Digi-
tal Image Processing Techniques. The new designed software
can specify Ischemic Stroke Area by assigning Threshold level
of CTP from CBV (Cerebral Blood Volume), CBF (Cerebral
Blood Flow) and MTT (Mean Transit Time) images [9]. Santi-
chai Fueanggan, et. al. the objective of this research is to speci-
fy Ischemic Stroke Area by using Digital Image Processing
principle to analyze Computed Tomography Perfusion (CTP)
images from CBV (Cerebral Blood Volume) and CBF (Cerebral
Blood Flow) images. By assigning Threshold level of CBV and
Threshold level of CBF. results will be shown in N-Match
(normal tissue areas), D-Match (dead tissue areas), Mismatch
(blood clot tissue areas) and Undefined area. Then, separate
the brain into left and right to compare distribution of Mis-
match and D-Match information in order to specify Ischemic Stroke Area. As a result of experiment, it is possible to sort elementary information of left and right side of the brain to specify Ischemic Stroke Area to compare the results with brain specialists [10]. Ming Sian, Lee, et. al. in this study propose an Increasing visual perception brain stroke detection system. They used mathematic morphology to extract brain area. Then using median filter to remove noise, and using canny edge detection to find out the edge of the brain tissue, setting peak value in edge histogram as seed to perform region growing. Finally, they can clearly recognize the area of stroke [11].
This paper is concerned with brain strokes and investigates proposed image processing techniques to improve the detec- tion of such strokes. The adopted procedure is illustrated in the flow chart shown in figure 1. The following sections ex- plain the various parts of the proposed method of stroke de- tection.
CT images need preprocessing operations because of unor- ganized nature of the brain tissue that is why we applying method for the diagnosis of the infraction.
The images received from CT scans are usually colored by RGB (red, green and blue) components. However, they are converted into gray-scale image by eliminating brightness in- formation, thus converting the image format 512![]() 512
512![]() 3 color RGB to 512
3 color RGB to 512![]() 512 gray-image [12] as shown in figure (2-a). This image was obtained from CT scanning of the head of a patient suffering from brain stroke.
512 gray-image [12] as shown in figure (2-a). This image was obtained from CT scanning of the head of a patient suffering from brain stroke.
The removal of the bony skull surrounding the brain tissue is considered as a challenge to the brain isolation. This process will allow us to extend the segmentation of the stroke. The following methods and mathematical operation are used to perform the skull removal.
IJSER © 2015 http://www.ijser.org
International Journal of Scientific & Engineering Research, Volume 6, Issue 2, February-2015 397
ISSN 2229-5518
CT scan data
Preprocessing Region growing Mathematical morphology
Opening and closing
Threshold segmentation Median filter Statistical feature
Compare normal and abnormal
Result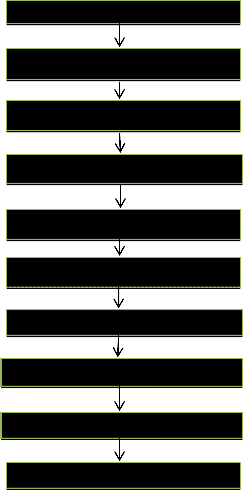
Fig. 1 the diagram for the assumed system for the detection of strokes from CT brain images.
The region growing is a step that groups the pixels or sub- regions into larger regions based on a predefined criteria for growth. A "Region" forms pixels growing with the same inten- sity level which is used to calculate the area of white mater for the skull [13].
To remove the cortex, the logical operator (OR) is applied. This makes the region of study black while the background is converted into white as shown in figure (2-c). We have
————————————————
• Shahad imad abdulsalam/ Ministry of health M.Sc. student, University of
Baghdad, Iraq, PH-009647905583243. E-mail:shahadimad_86@yahoo.com
•Dr.Ihssan Subhi Nema/ Assistant Professor in Neurosurgery, Alnahrain
University, PH-009647901881084. E-mail:ihssansubhe2006@yahoo.com
also used the AND operator which transforms the regain of study into white and background into black as shown in
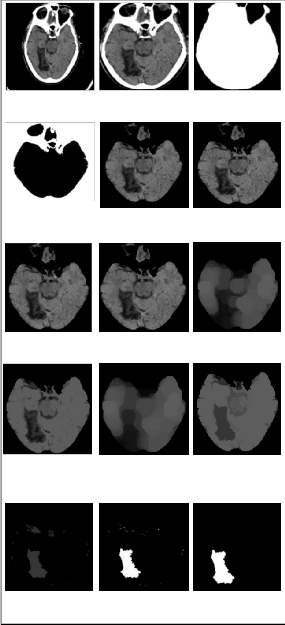
figure (2-b). These two operators were used to extract the brain tissue as can be seen in figure (2-d).
The resulting image need a filtering operation so a median filter of window [3 X 3] was applied on the image for three successive time to remove the noise in the CT image. Smother images were obtained as can be clearly seen in figure (2-e, f, g).
Using morphological techniques called "opening-by- reconstruction" and "closing-by-reconstruction" to "clean" up the image. These operations will create flat maxima inside each object that can be located. Opening is erosion followed by dilation, while opening-by-reconstruction is erosion followed by a morphological reconstruction. Following the opening with a closing can remove the dark spots and stem marks. Compare a regular morphological closing with a closing-by- reconstruction. Reconstruction-based opening and closing are more effective than standard opening and closing at removing small blemishes without affecting the overall shapes of the objects as shown in figure (2-h, i, j, k).
The thresholding technique is the simplest method used in the segmentation process. The process collects all the pixels with a certain threshold and rejects other pixels which have values less than the threshold. After the thresholding procedure is applied the stroke region will be isolated from the brain tissue. The stroke regions will be more clearly visible in the output images.
To obtain an image contain the ischemic stroke the threshold method was applied twice on the image. For each time the threshold value differ from the other. The median filter ap- plied to the segmented image to smooth it and remove the noise, figure (1-l, m, n) shows these result.
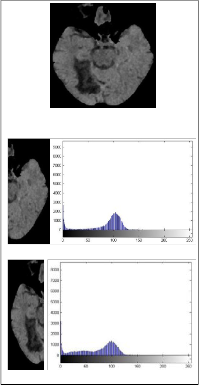
The brain image has been divided into two equal parts one of these parts includes abnormal area and the other one contains the normal area. The statistical features were then calculated from the first-order histogram. Comparisons were made be- tween the histograms of the two parts to check which part car- ries the stroke.
The random variable i represents the gray levels of the image region. The first-order histogram p (i) is defined as: [13]
IJSER © 2015 http://www.ijser.org
International Journal of Scientific & Engineering Research, Volume 6, Issue 2, February-2015 398
ISSN 2229-5518
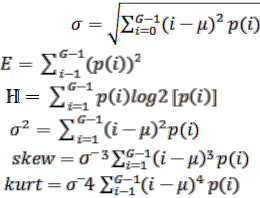
Standard deviation: (3)
Energy: (4) Entropy: - (5) Variance: (6)
Skewness: (7)
Kurtosis: (8)
c) Mask 2 d) Image after remove skull
e) Median filter first time
The first order histogram represents the estimation of the probability density function (PDF) for the selected neighbor- hood [14]. Useful features of the image can be obtained from the histogram; including mean value which represented the white color in the image so the normal part has the higher value of the mean. Variance tells about the intensity variation around the mean. Standard deviation gives the measure of the average contrast so the variance and standard deviation relat- ed to the mean so the normal part is higher. Energy gives indi-
f) median filter
second time
i) Open by re- construction
g) Median filter
third time
j) Open-close
h) open
k) Open-close by reconstruc- tion
cation about the number of gray level in the image the normal part is higher since it has a great number of gray level com- pare with the abnormal part in which there is a stroke which causes a defect in the brain tissue. Entropy represents the uni- formity of the histogram and inversely proportional to the energy so the value for the abnormal part is greater than nor- mal part. Skewness tells the symmetries of the histogram around the mean so for the normal part is higher and for the abnormal part is lower. Kurtosis is the fatness of the histo- gram, for normal part is higher as shown in table (1) and fig- ure (3).
l) Stroke after threshold > 55
m) Stroke after threshold <54
n) median filter after threshold
Fig. 2 images obtained from the Preprocessing and thresholding process
![]() (1)
(1)
P (i) = H (i)/NM
P (i) = is the probability of occurrence of the i.
Where i=0, 1, 2………G-1
G= gray level tone of an image (255), N= number of cells in the
horizontal domain.
M= number of cell vertical domain [15]
Mean: ![]() (2)
(2)
IJSER © 2015 http://www.ijser.org
International Journal of Scientific & Engineering Research, Volume 6, Issue 2, February-2015 399
ISSN 2229-5518
Image after remove skull and median filter triple time
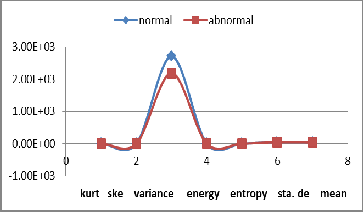
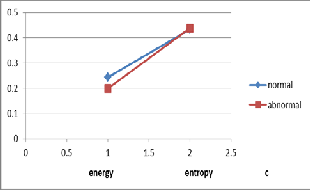
Figure (4) the graph of the statistical features (a, b, c) Normal part and histogram
Abnormal part and histogram
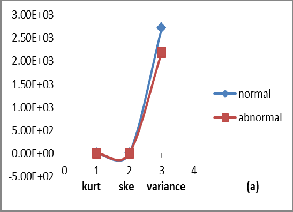
Fig. 3 The histogram for brain parts
Fig. 5 the statistical features for normal and abnormal part
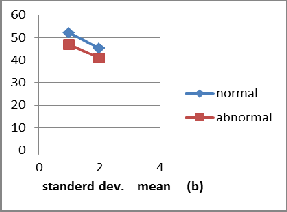
The pre-processing methods are important to make the seg- mentation easier and faster than the familiar process. Features are used to compare between the normal and abnormal parts of the brain. Different pre-processing methods have been used to improve the abnormal part in the statistical features which were obtained from the first-order histogram gives infor- mation about two half. From figure (4) and table (1) the statis- tical features shows higher value for the entropy. Since it rep- resented the randomness in the image and its inversely pro- portional to the energy so the energy value for the abnormal part is lower than normal part this means that the number of gray-level value is higher than the normal part, because ap- pearance of stroke in this part. Skewness and kurtosis shows a lower value for the normal part. The variance which depend on the mean value, and the mean value are lower for abnormal part since the stroke appear more dark than the normal brain tissue and the mean represented the brightness part in the image. This method gives good result about the detection and segmentation of brain stroke with the help of the statistical features.
[1] M. M. Kyaw, "Computer-Aided Detection system for Hemorrhage contained region", International Journal of Computational Science and In- formation Technology, Vol. 1, No. 1, PP: 11-16, Feb 2013.
IJSER © 2015 http://www.ijser.org
International Journal of Scientific & Engineering Research, Volume 6, Issue 2, February-2015 400
ISSN 2229-5518
[2] B. Chanda, D. D. Majumder, Digital Image Processing and Analysis, PHI Learning Private Limited, New Delhi, Isbn 978-81-203-4325-2, 2nd Edition, 2011.
[3] A. Devi, S. P. Rajagopalan, "Brain Stroke Classification Based on Multi-Layer Perceptron Using Watershed Segmentation and Gabor Filter", Journal of Theoretical and Applied Information Technology, Vol. 56
No. 2, PP: 410-416, Oct 2013.
[4] F. Zhu, "Brain Perfusion Imaging–Performance and Accuracy", Centre for Intelligent System and their Applications, School of Information, Uni- versity of Edinburgh, 2012.
[5] H. P. Adams, B. H. Bendixen," Classification of Subtype of Acute Ischemic Stroke Definitions for Use in a Multicenter Clinical Trial", Journal of the American Heart Association, No. 24, PP: 35-41, 1993.
[6] A. V. Wangenheim, R. Charnovscki, "Cyclops Stroke Quantifier - Ischaemic Stroke Detection System Using Dynamic CT", IEEE, Sym- posium on Computer-Based Medical SystemComputer Society, 2002.
[7] E. D. Seletchi, O. G. Duliu, "Image Processing and Data Analysis in
Computed Tomography", Rom. Journ. Phys., Bucharest, Vol. 52, Nos. 5-
7, PP: 667-675, 2006.
[8] U. Andrius, A. D. Romualdas, F. T. Bernd, " Ischemic Stroke Segmen- tation on CT Images Using Joint Features", Institute of Mathematics and Informatics, Vilnius, Vol. 15, No. 2, PP: 283-290, 2004.
[9] S. Fueanggan, S. Chokchaitam, S. Muengtaweepongsa, "Simulation Program of Specifying Ischemic Stroke Area from CT Perfusion im- ages Based on Digital Image Processing Techniques", Medical Signal Processing and Medical Imaging, Conference, 2011.
[10] S. Fueanggan, S. Chokchaitam, S. Muengtaweepongsa, "Ischemic Stroke Analysis of CT perfusion maps Cerebral Blood Volume and Cerebral Blood Flow Based on Digital Image Processing Techniques", IEEE, Biomedical Engineering International Conference, PP: 156-160,
2011.
[11] M. Sian, Ch. Li, Y. Wen, "Increasing Visual Perception Brain Stroke Detection System", IEEE, International Conference on Computing, Meas- urement, Control and Sensor Network, PP: 429-432, 2012.
[12] Vinay Nagalkar and Sunil Agrawal, "Ischemic Stroke Detection Using Digital Image Processing by Fuzzy Methods", International Journal of Latest Research in Science and Technology, Vol. 1, Issue: 4, PP: 345-347, Nov/Dec 2012.
[13] O. E. Ramos, B. Rezaei, "Scene Segmentation and Interpretation Im- age Segmentation using Region Growing", MSc, Thesis, Computer Vi- sion and Robotics, Universitat de Girona, 2010.
[14] N. Aggarwal, R.K. Agrawal ," First and Second Order Statistics Fea- tures for Classification of Magnetic Resonance Brain Images", Journal of Signal and Information Processing, Vol. 3, PP: 146-153, 2012.
[15] Sh. Uyun, S. Hartati, "Selection Mammogram Texture Descriptors Based on Statistics Properties Backpropagation Structure", Interna- tional Journal of Computer Science and Information Security, Vol. 11, No.
5, May 2013.
IJSER © 2015 http://www.ijser.org