International Journal of Scientific & Engineering Research, Volume 3, Issue 10, October-2012 1
ISSN 2229-5518
Design Studies and Optimization of Position of
Strain Gauge
Ashutosh Kumar1, Sachin Kumar Chaturvedi2, Vimal Chaturvedi3, Ramesh Chandra Yadaw4
Abstract— Positioning of Strain Gauge is one of the limiting factor for finding the accurate output signal by using conventional sensors and other electronic devices. Strain gauges and electronic devices are required in some special applications e.g. measurement of deform ations, stresses and pressures inside power generators. The optimum positioning of the strain gauge has been studied using finite element analysis and the findings are presented in the form of stress, strain and displacement plots with respect to centre line distance of sensor's substrate. The study further attempts to suggest in positioning of strain gauge for finding the accurate output signals and good sensitivity from electronic devices and conventional sensors.
Keywords — Strain Gauge, Sensors, Sensitivity, Strain, Stress, Optimization & FEA
—————————— ——————————
1. INTRODUCTION
iezoresistivity is one of the widely utilized physical phenomena in different kinds of sensor devices. Lord
least 200°C) are important for some sensor applications especially in mechanical engineering, power stations, etc.
Kelvin referred that certain metalloid conductors subjected to mechanical strain exhibited a corresponding change in electrical resistance [1]. The basic function of the strain
[2]
Hence for the better sensitivity and output signal, the
gauge is based on transforming the strain in certain
direction as to change its electric resistance. It allows measuring plenty of non-electrical quantities such as deformation, bending, force, acceleration etc. Strain, in fact is a measure of deformation and is measured as a ratio of change in length to original length. It is found under the application of forces and measured by variety of sensors/strain gauges. The strain gauges may be metal strain gauge, semiconductor strain gauge, capacitive strain gauge, piezoelectric strain gauge, mechanical strain gauge, electrical strain gauge, pneumatic strain gauge etc depending upon their suitability for particular applications. Strain gauges have been always a centre of research for their accuracy of output signal for many decades.
Various kinds of sensors of mechanical deformation have been developed. Those based on resistors implanted into a silicon substrate frequently have very good deformation sensitivity, linearity of characteristics, low hysteresis, etc. Higher operational temperatures (e.g. at
————————————————
1Asst. District Panchayati Raj Officer (Technical), Govt. of Uttar Pradesh, India
E-mail:- er.ashu1985@gmail.com
2Asst. Prof., Department of Mechanical Engineering, Brown Hills College of
Engineering and Technology, Dhauj, Faridabad, Haryana, India
3Sr. Lecturer, Department of Mechanical Engineering, Sundeerdeep Engineering
College, Ghaziabad, Uttar Pradesh, India
4Asst. Prof., Department of Mechanical Engineering, Northern India Textile
Research Association Technical Campus, Ghaziabad, Uttar Pradesh, India
present paper attempts to introduce the specific positioning
of the strain gauge on the sensor’s substrate. It somehow
improves the accuracy and performance of the
sensors/strain gauges. These studies have been done with
the help of finite element analysis. The software used for
finite element analysis is Autodesk Inventor Professional-
2013 student edition.
2. ANALYTICAL STUDY
The working principle of the metal strain gage is based on the strain/resistance relationship of electrical conductors which was discovered by Wheatstone and Thomson. Any electrical conductor changes its resistance with mechanical stress, e.g. through tension or compression forces. The resistance change is partially due to the conductor's deformation and partially due to the change in the
resistivity ρ of the conductor material as a result of micro
structural changes. This process is described by the
relationship


= Є (1 + 2ν) + (1) Where,
R = electrical resistance
Є = strain(ΔL/L)
ν = Poisson’s ratio ρ = resistivity
Sensitivity in a strain gauge defines as the behavior of the gauge in responding to strains which are perpendicular and longitudinal to the primary sensing axis of the gauge.
IJSER © 2012 Page | 1
http://www.ijser.org
International Journal of Scientific & Engineering Research, Volume 3, Issue 10, October-2012 2
ISSN 2229-5518
Ideally, it would be preferable if strain gauges were completely insensitive to transverse strains. In practice, most gauges exhibit some degree of transverse sensitivity, but the effect is ordinarily quite small, and of the order of several percent of the axial sensitivity.

The sensitivity(S) of strain gauge defined as the ratio of change of resistance and the strain Є . i.e.


S= = /Є (2)
3. FINITE ELEMENT MODEL AND ANALYSIS
The Finite Element Analysis (FEA) was developed for numerical solving of mechanical stresses, deformations, temperature gradients etc., under elastic (linear) material
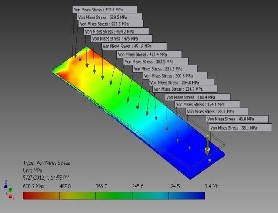
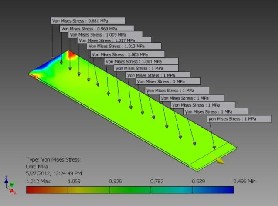
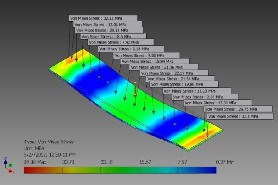
direction of 1N magnitude. The change in state after loading which is shown in the fig. 1.
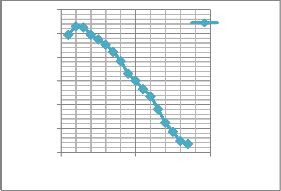
Fig.1: Von Mises Stress distribution along centre line of a cantilever substrate for transverse loading.
600
behavior. In FEA, a distributed physical system to be
analyzed is divided into a number (often large) of discrete elements. The complete system may be complex and irregularly shaped, but the individual elements are easy to analyze. The examined region is covered by a discretization net compiled from a finite number of generally 3D elements. The discrete element can have any shape from the simplest (triangles) to the very complex (tetrahedrons). Generally, the elements may be 1-D, 2-D (triangular or
quadrilateral), or 3-D (tetrahedral, hexahedral, etc.) and
500
400
300
200
100
0
0 10 20
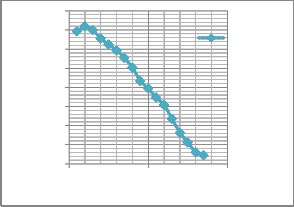
Von Mises
Stress
may be linear or of higher order.
The software Autodesk Inventor Professional-2013 student edition has been used for modeling and analysis of positioning of strain gauge. The material is of isotopic nature. The force is applied in transverse and longitudinal mode as an indication of methodology using Autodesk Inventor Professional-2013 software for studding Von Misses stress, strain & displacement pattern. After finding theses plotted with respect to centre line distance. The findings of the finite element analysis may be summarized in form of stress, strain and displacement of the patterns. The aim of the simulation was mainly optimization of strain gauge position on the substrate along centre line with respect to point of fixation. The assumption for the simulation was the longitudinal and transverse piezoresistivity coefficients are equal, it means, the resistance in longitudinal and transversal direction is same.
4. MODEL ANALYSIS
4.1 Case-I (Substrate with one end fixed & transverse loading)
Here taking a cantilever substrate of a sensor of
20mm*5mm*0.5mm size and a load is applied in transverse
Distance Along center Line (mm)
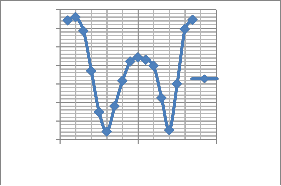
Graph 1: Plot for Von Mises Stress distribution along centre line of a cantilever substrate for transverse loading.
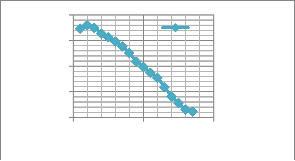
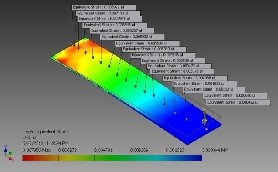
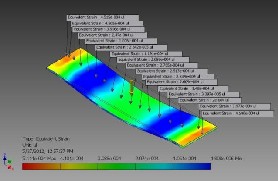
Fig. 2: Equivalent Strain distribution along centre line of a cantilever substrate for transverse loading.
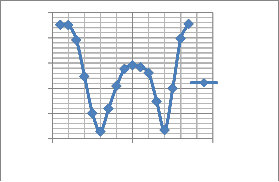
0.008
Equivalent Strain
0.006
0.004
0.002
0
0 10 20
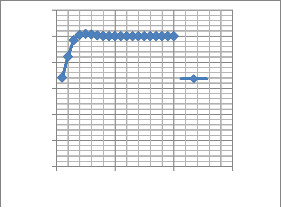
Distance Along Center Line(mm)
Graph 2a: Plot for Equivalent Strain distribution along centre line of a cantilever substrate for transverse loading.
IJSER © 2012 Page | 2
http://www.ijser.org
International Journal of Scientific & Engineering Research, Volume 3, Issue 10, October-2012 3
ISSN 2229-5518
1.6
1.4
1.2
1
0.8
0.6
0.4
0.2
0
Percentage change in resistance
0 10 20
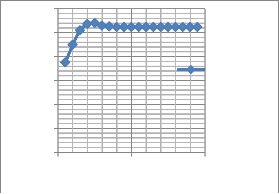
Distance Along Center Line(mm)
Fig. 4: Von Mises Stress distribution along centre line of a cantilever
Graph 2b: Plot for Percentage Change in the resistance along centre line of a cantilever substrate for transverse loading
4.2 Case-II (Substrate with one end fixed & longitudinal loading)
Here taking a cantilever substrate of 20mm*5mm*0.5mm size and a load is applied in longitudinal direction of 1N magnitude. The change in state after loading which is shown in the fig. 3.
Now examine the equivalent strain and von misses
substrate for longitudinal loading.
1.2
1
0.8
0.6
0.4
0.2
0
Von Mises
Stress
stresses at different points using Autodesk inventor
Professional - 2013 Student Edition
0 10 20 30
Distance along center line (mm)
Graph 4a : Plot for Von Mises Stress distribution along centre line of a cantilever substrate for longitudinal loading
0.3
0.25
0.2
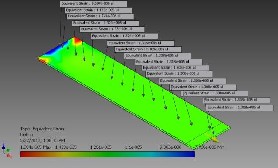
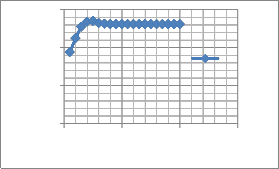
Fig. 3: Equivalent Strain distribution along centre line of a cantilever substrate for longitudinal loading.
0.15
0.1
0.05
0
Percentage
change in resistance
0 10 20
1.5
Distance along Center Line (mm)
1
0.5
0
Equivalen…
0 10 20 30
Distance Along center line (mm)
Graph 4b: Plot for Percentage Change in the resistance along centre line of a cantilever substrate for longitudinal loading.
4.3 Case-III (Substrate with both end fixed & transverse loading)
Here taking a substrate with both end fixed of
20mm*5mm*0.5mm size and a load is applied of 1N
magnitude in transverse direction at mid of the substrate.
Graph 3: Plot for Equivalent Strain distribution along centre line of
cantilever substrate for longitudinal loading.
The change in state after loading which is shown in the fig.
5.
IJSER © 2012 Page | 3
http://www.ijser.org
International Journal of Scientific & Engineering Research, Volume 3, Issue 10, October-2012 4
ISSN 2229-5518
Now examine the equivalent strain and von misses stresses at different points using Autodesk inventor Professional - 2013 Student Edition.
Fig. 5: Equivalent Strain distribution along centre line of a substrate
(both end fixed) for transverse loading.
5
4
3
2 Equivalent
Strain
1
0
0 10 20
Distance along center line(mm)
Graph 5: Plot for equivalent strain distribution along centre line of a substrate (both end fixed) for transverse loading
Fig. 6: Von mises stress distribution along length in a substrate
(both end fixed) for transverse loading.
35
30
25
20
15 Von
10 Mises
Stress
5
0
0 10 20
Distance along center line(mm)
10
8
6
Percentage
4 change in
resistance
2
0
0 10 20
Distance along center line(mm)
Graph 6b: Plot for Percentage change in resistance along centre line of a substrate (both end fixed) for transverse loading.
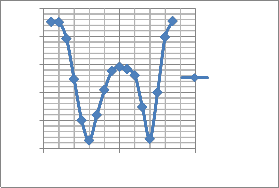
5. RESULTS AND DISCUSSIONS
Above plots expresses the von mises stress distribution, equivalent strain distribution & percentage change in resistance along the length of substrates in different loading conditions. Maximum straining region in substrate indicated by the red color and minimum straining region indicated by blue color. The value of maximum strain in substrate shown by the probe and where the maximum strain found, after and before plots goes downward. The pick point coordinates of the plots locating the optimum position of strain gauge. This way we get a good sensitivity of the sensors/strain gauges. The waviness of plots introduces the tensile & compressive nature of the substrates.
6. CONCLUSIONS
The finite element analysis reveals the information about stress/strain distribution and displacement along the length of patterns under the action of transverse and longitudinal forces. The finite element analysis has been used for obtaining vital information related to stress/strain and has been used for locating the optimum position of strain gauge.
7. REFERENCES
[1] J. Fraden, “Handbook of Modern Sensors (Physics, Design and
Applications)”, American Institute of Physics, New York, 1995
[2] M. Elvenspoek, “Mechanical Microsensors”, Springer, 2001. [3] R.Nakka, “ Mounting strain gauges”,Revision:1.0, June2002. [4] P.Kulha,A.Boura and M.Husak, “Desigh and fabrication of
piezoresistive strain gauges for harsh environment applications”,
ICREPQ’10,Granada(Spain), March 2010
[5] Hu Huang, Hongwei Zhao, Zhaojun Yang,Zunqiang Fan, Shunguang Wan, Chengli Shi and Zhichao Ma, “Design and analysis of a compact precision positioning platform integrating strain gauges and the piezoactuator”, Journal ,Sensors 2012,12,9697-9710, ISSN 1424-
Graph 6a: Plot for Von Mises Stress distribution along length in a
substrate(both end fixed) for transverse loading
8220,July 2012.
IJSER © 2012 Page | 4
http://www.ijser.org