
International Journal of Scientific & Engineering Research, Volume 5, Issue 5, May-2014 1253
ISSN 2229-5518
Design of Connecting Rod For Weight Reduction
Using C70S6 Material
Deepak G. Gotiwale, Shailesh D. Ambekar
—————————— ——————————
The connecting rod or conrod is bridge between the piston to the crank or crankshaft in reciprocating engines. The connecting rod with piston and crank converts linear motion into rotary motion and also rotary motion into linear motion with a simple mechanism.
The aim of this study is to redesign a connecting rod for its
light weight. The weight reduction carried out here, is not only helping in reducing mass from connecting rod, but also helping in for enhancing manufacturing feasibility and cost reduction parameters. In addition to this, while performing weight reduction under fatigue life, software used for this work shows restriction and this is the constraint. Therefore, in weight reduction, the structure modification is carried out by fatigue testing results, FEA results and the design is supported with numerical values.
Serag et al. [1] developed approximate mathematical formulae to define connecting rod weight and cost as objective functions
as well as constraints. The optimization was achieved using a geometric programming technique. Pai[2] presented an approach to optimize the shape of a connecting rod subjected to a load cycle which consisted of the inertia load deducted from gas load as one extreme and peak inertia load exerted by the piston assembly mass as the other extreme.
Yoo et al. [3] performed shape optimization of an engine connecting rod using variational equations of elasticity, material derivative idea of continuum mechanics, and an adjoint variable technique to calculate shape design sensitivities of stress. The results were then used in an iterative optimization algorithm to numerically solve for an optimal design solution.
In the last 50 years, cars have learned to think, adjust, and even protect. High performance is more demanding. Not only for putting a little smile on the face, the majority of people want a machine that will get them from spot A to spot B as easy as possible. Mainly this smile comes by a quick strike of the accelerator. Keeping it in mind, manufacturer has to design lighter, faster, and more efficient engines for this job.
In this project, one component of an engine in particular, the
connecting rod, will be analyzed. Being one of the most integral
parts in an engine’s design, the connecting rod must be able to withstand tremendous loads and transmit a great deal of power. It is no surprise that a failure in a connecting rod can be one of the most costly and damaging failures in an engine.
the help of Pro-E and later on imported in ANSYS for FEA. [7]
Fig. 1 shows a 3D solid model of a connecting rod made with
————————————————
• Deepak G. Gotiwale is student of masters degree program in Mechanical design in Government College of Engineering, Aurangabad(M.S), India ,
PH-919423455287, E-mail: omdeepak2001@gmail.com
• Shailesh D. Ambekar is Faculty in Department of Mechanical Engineering in
Government college of Engineering, Aurangabad(M.S.),India
IJSER © 2014 http://www.ijser.org
International Journal of Scientific & Engineering Research, Volume 5, Issue 5, May-2014 1254
ISSN 2229-5518

20
10
0
-10
-20
-30
0 30 60 90 120 150 180 210 240 270 300 330 360
Fig. 1. 3D Solid model of Connecting rod.
-40
Graph 1. Crank angle Vs Forces
Crank Angle
![]()
Force
Fig. 2. Forces acting on Connecting Rod
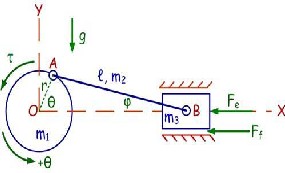
After having a solid model of connecting rod, it can be use for further process and for that, forces or loading need to be calculated.
The load acting on the connecting rod is divided into two types,
1. Maximum compressive load
This load is calculated on the basis of peak firing pressure.
2. Maximum tensile load
This load is calculated on the basis of inertia masses at both
the ends.
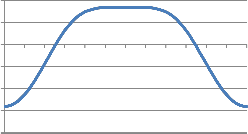
Graph 1 shows tensile and compressive forces acting on a connecting rod with respect to crank angle. This graph can be drawn with the help of equations,![]()
∅ = 𝐚𝐫𝐜𝐬𝐢𝐧[𝑹 × 𝐬𝐢𝐧 𝜽] (1)
𝑳
𝒓 = 𝑹 𝐜𝐨𝐬 𝜽 + 𝑳 𝐜𝐨𝐬 ∅ (2)
In a fatigue test, the infinite life condition is assumed to meet at 5 - 6 million cycles for steels. Therefore for 5 million cycles test, a targeted factor of safety is decided. Therefore for infinite life conditions FOS is the require factor of safety. The targeted failure probabilities of less than 0.01% are followed in automotive industries. For forged components a factor of safety of 1.7 is consider is sufficient considering a normal scatter band width is between 10 and 90%.Generally in Europe, during component sourcing from OEM’s they required FOS of only is 1.6 to 1.7. Here mainly considering the possible scatter of components strength during volume production and also considering variation in engine load (in peak firing pressure variation, miss usages condition), the targeted factor of safety is 2.0. Approach used for testing of connecting rod is as below,
• Take first sample
• Apply a load level, which will be little higher than the estimated fatigue strength until it either fails or sustain at the targeted life.
• If sample fails before achieving its targeted life, then decreased load level by pre-selected decrement.
• Take second sample and tested at this new lower load level.
• If the first sample sustains this load, the load level is increased and second sample is tested at this new increased load level.
Thus specimen is tested in such a manner and sequence that, it
tested above or below the load levels to see whether it sustain
𝑳𝑽𝒆𝒍 = 𝑹 × 𝝎 × 𝐜𝐨𝐬 𝜽
(3)
or fails at this load.![]()
![]()
𝑳 𝐜𝐨𝐬 ∅
𝑽𝒆𝒍 = −𝑹 × 𝐬𝐢𝐧 𝜽 × (𝝎 + 𝑳𝑽𝒆𝒍) (4)![]()
𝟐 𝟐
Thus from the above explanation it is very clear that, the main
focus of this test is on the man value of load level for failure or fatigue strength for the targeted life. However, to evaluate the scatter observed during this testing, the actual testing is little
𝑳𝒂𝒄𝒄 = (−𝑹×𝝎 ×𝐬𝐢𝐧 𝜽)+(𝑳×𝑳𝑽𝒆𝒍 ×𝐬𝐢𝐧 ∅)
𝑳×𝐜𝐨𝐬 ∅
(5)
deviated from the above mentioned procedure.
Though the loads acting on small end and big ends are
𝑨𝒄𝒄 = −𝑹 × 𝝎 × 𝐜𝐨𝐬 𝜽 × (𝝎 + 𝑳𝑽𝒆𝒍) − 𝑹 × 𝐬𝐢𝐧 𝜽 × 𝑳𝑨𝒄𝒄 (6)
different, here testing is performed on small end only
considering a critical area of con rod.![]()
𝑭𝒐𝒓𝒄𝒆 = 𝑾×𝑨𝒄𝒄
𝟏𝟏𝟎×𝐜𝐨𝐬 ∅
(7)
IJSER © 2014 http://www.ijser.org
International Journal of Scientific & Engineering Research, Volume 5, Issue 5, May-2014 1255
ISSN 2229-5518
TABLE 1
LOADS ON CONNECTING ROD
![]()
![]()
Loads | Forces (N) |
Tensile | 17000 |
Compressive | 28000 |
![]()
Connecting rods were tested for small end as per the sequence mentioned above and the results are as shown in graph 2.
As stated above, after qualifying dimensional and metallurgical inspection a connecting rod was taken for testing.
100
90
80
70
60
50
40
30
20
10
0
0.1 1 1.9 2.8 3.7 4.6 5.5 6.4 7.3 8.2 9.1 10
Case I Case II
Case III Case IV
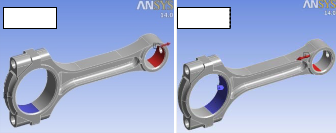
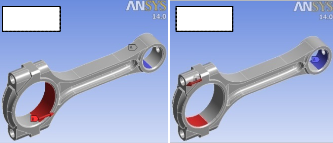
Fig. 4. Boundary conditions.
Fig. 4 shows 4 cases of boundary conditions for connecting rod in which, in case I, crank end is fixed and a tensile load is applied at pin end. In case II crank end is fixed and a compressive load is applied at pin end. In case III pin end is![]()
Load Life Curve
Fatigue Life, Cycles (million)
fixed and a compressive load is applied at crank end. In case
Graph 2. Applied load Vs fatigue life.
Before and after testing it is necessary to check all components for crack and surface defects by dye penetrate method. Three design iterations were done during the fatigue evaluation of the connecting rod. As per the graph shown above for small end failure, considering FOS as 2, the life ranging from 0.5 million to
5 million cycles shows excessive scatter in life of conrod and inconsistency of small end strength. This failure is may be due to variation in metallurgical / physical properties, tolerances and manufacturing quality.
Now using Ansys software the FE analysis of connecting rod
was carried out to determine the stress concentration areas. The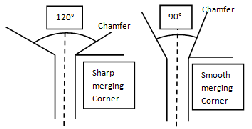
boundary conditions are as shown in fig. 3. FEA results for small end are shown in figure and, indicate stress concentration is more at oil hole chamfer. During testing failures also shows crack initiations in the same region. To overcome this problem it was decided to change oil hole chamfer angle to 90° from 1200 to avoid sharp merging with oil hole inner diameter. Fig. 3 shows proposed modification profile of oil hole.
Fig. 3. Oil hole modification
IV pin end is fixed and a tensile load is applied at crank end.
Meshing is the process used to “fill” the solid model with nodes and elements, i.e., to create the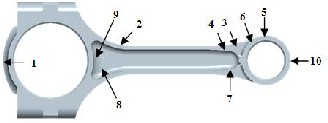
Fig. 5. Point locations for meshing
FEA model. Remember, you need nodes and elements for the finite element solution, not just the solid model. The solid model does not participate in the finite element solution.
In this connecting rod, before finalization of element size for meshing, a meshing convergence is performed by tetrahedral element with various element lengths.
• 2.5 mm (17773 elements)
• 2 mm (24699 elements)
• 1.5 mm (42177 elements)
• 1 mm (95989 elements)
With reference to fig. 5, ten points are located at connecting rod for checking Von Misses stresses for convergence. As per the above explanation, all results of these element lengths are combined to plot a graph. After studying this graph we come to know that, 1mm element length is best suited for meshing,
IJSER © 2014 http://www.ijser.org
International Journal of Scientific & Engineering Research, Volume 5, Issue 5, May-2014 1256
ISSN 2229-5518
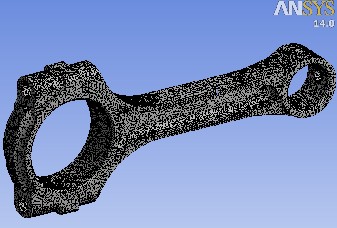
as it helps to achieve connecting rod convergence with uniform element length. This resulted in a mesh with 95989 elements. It can be seen that convergence has been achieved with 1 mm global mesh size. Now comparing two models, it is observed that, percentage difference is only 2.5% between stress values. Hence, the mesh with 95989 elements was used for Finite element analysis of connecting rod.
Fig. 6. Connecting rod meshing with tetrahedral 1mm element length.
As shown in fig. 6, meshing is performed with 1mm global element length with tetrahedral mesh type. It gives uniform distribution of all elements on connecting rod. [6]
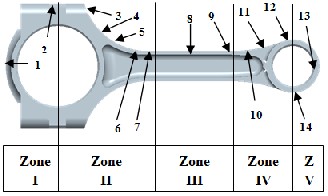
Fig. 7. Stress distribution zones.
In this chapter, to obtain loads acting on the connecting rod and to perform FEA, the load analysis is carried out. For the design and analysis of connecting rod most of the people have used static axial loading criteria only. However, some people have used inertia loads (axial load varying along the length) during the design process. In this paper the investigation of connecting rod is carried out with static axial loading criteria. Fatigue testing range can be simulating by the maximum and minimum static load. As a result of this, finite element analysis was carried out under axial static load with no
dynamic / inertia loads. Therefore in this chapter, the results of the above mentioned analysis are shown and discussed with a view to use them for optimization of connecting rod.
In this chapter results are obtained for static stress analysis in the form of Von-Misses stresses. While performing this static stress analysis in ANSYS, connecting rod was divided in to five different zones for understanding stresses at different locations of connecting rod.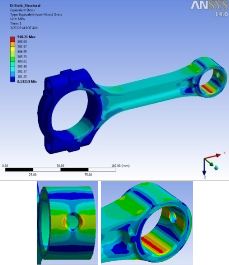
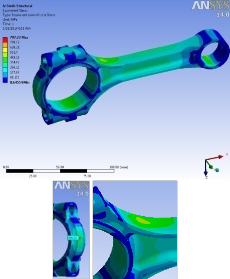
Fig. 8. Von Mises stresses with Crank end fixed and static tensile load at piston pin end.
Fig. 9. Von Mises stresses with Crank end fixed and static tensile load at piston pin end.
IJSER © 2014 http://www.ijser.org
International Journal of Scientific & Engineering Research, Volume 5, Issue 5, May-2014 1257
ISSN 2229-5518
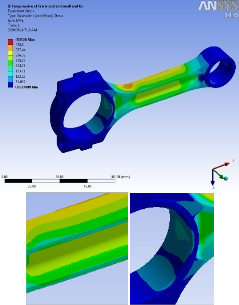
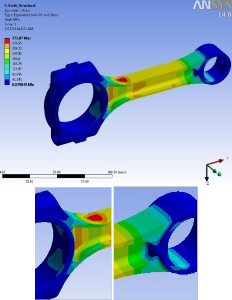
Fig: 10. Von Mises stresses with Crank end fixed and static compressive load at piston pin end.
Fig: 11. Von Mises stresses with piston pin end fixed and static compressive load at the crank end.
![]()
![]()
Fig. 8 to 11 shows results in terms of Von Misses stresses of the connecting rod under static loading. Fig. 8 shows the von Misses stresses in which tensile load applied at the piston pin end, and crank end is fixed. Fig. 9 shows results in terms Von Misses stresses, in which tensile load applied at the crank end, and piston pin end is fixed. Fig. 10 shows results in terms of Von Misses stresses, in which compressive load applied at the
piston pin end, and crank end is fixed. Fig. 11 shows results in terms of Von Misses stresses, in which compressive load applied at the crank end, and piston pin end is fixed. In all cases applied load is 28 KN. Now we will discuss the differences between above mentioned cases. Considering this, as shown in Fig. 7, connecting rod is divided into five zones and comparison is made on the basis of obtained nodes. As per the different zones stress distribution is shown in Fig. 8 to
11 and these results are compared. After comparison with fig.
8 (case I) and 9 (case II) major differences are observed between the results of zone I, and zone II, IV, and V, having nodes 3, 4, 5. In zone II and zone III, node numbers 6 and 7 and node number 8 respectively have very close stress values. In case I, the crank end is fixed while in case II the pin end is fixed. These above mentioned fixed ends not pin joints. Therefore, we can say that, to predict the structural behavior perfectly, results received from zone I, II and zones IV, V from case-I and case-II respectively are not suitable. In case III and case IV, the differences between the stresses at nodes 6, 7, 8, and 9 are small for compressive loading.
Fig. 8 and 9 shows stress distribution for tensile loading and
after analyzing these results of tensile loading, we come to know that, oil hole is the critical region and for this purpose, a enlarge image of that critical region is shown. Similarly, after analyzing stress distribution in fig. 9 we come to know that, web of the connecting rod is the critical region and for this purpose a enlarge image is shown. As shown in fig. 10 and 11 crank end and pin end regions are the critical regions.
In this way, with help of FEA results, few critical regions are
targeted for minimizing its stress intensity.
Connecting rod Specifications:
Diameter of Piston(d) | = | 68.3 mm |
Length of Conrod(2L) | = | 144 mm |
Stroke Length(L) | = | 72 mm |
Speed(n) Maximum Explosion | = = | 3000 R.P.M 37.20 Bar |
TABLE 2
![]()
MATERIAL PROPERTIES
IJSER © 2014 http://www.ijser.org
International Journal of Scientific & Engineering Research, Volume 5, Issue 5, May-2014 1258
ISSN 2229-5518
𝑭𝒄 = 𝑭𝒑 − 𝑭𝒋 = 𝑭𝒑 − 𝑭 (11)
𝐹𝑝 = 𝑃𝑖𝑠𝑡𝑜𝑛 𝑓𝑜𝑟𝑐𝑒
𝐹𝑝 = 𝑃 × 𝐴
𝐹𝑝 = 13622.41 𝑁
Therefore,
𝐹𝑐 = 13622.41 − 7094.11 = 6528.3 𝑁
Now,![]()
𝑭𝒄 = 𝒇𝒄𝑨
(12)
![]()
𝟏+𝑲� 𝒍 �
𝒌
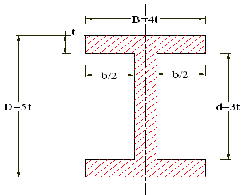
Fig. 12. Conrod I Section
𝐼𝑋𝑋 = 4𝐼𝑌𝑌
𝐼𝑋𝑋 34.91𝑡 4![]()
![]()
=
Where,
𝐴 = 𝐴𝑟𝑒𝑎 𝑜𝑓 𝑐/𝑠 = 11 𝑡2
𝐿 = 𝐿𝑒𝑛𝑔𝑡ℎ 𝑜𝑓 𝑐𝑜𝑛𝑛𝑒𝑐𝑡𝑖𝑛𝑔 𝑟𝑜𝑑 = 144 𝑚𝑚
𝐾 = 𝑅𝑎𝑑𝑖𝑢𝑠 𝑜𝑓 𝑔𝑦𝑟𝑎𝑡𝑖𝑜𝑛 𝑎𝑏𝑜𝑢𝑡 𝑋 − 𝑋 𝑎𝑥𝑖𝑠 = 1.78 𝑡
𝑓𝑐 = 𝐴𝑙𝑙𝑜𝑤𝑎𝑏𝑙𝑒 𝑢𝑛𝑖𝑡 𝑠𝑡𝑟𝑒𝑠𝑠 𝑓𝑜𝑟 𝑑𝑒𝑠𝑖𝑔 𝑁/𝑚𝑚2
𝐼𝑌𝑌
10.91𝑡 4
𝑌𝑖𝑒𝑙𝑑 𝑝𝑜𝑖𝑛𝑡 𝑠𝑡𝑟𝑒𝑠𝑠
500
𝑨 = (𝟓𝒕 × 𝟒𝒕) − (𝟑𝒕 × 𝟑𝒕) = 𝟏𝟏𝒕𝟐 (8)![]()
𝑓𝑐 =
Therefore,
=
𝐹𝑂𝑆![]()
= 275 𝑀𝑃𝑎
2![]()
![]()
𝑲 = �𝑰 = 𝟏. 𝟕𝟖𝒕 (9)
From Eq.(12)
3025𝑡 4 − 6528.3𝑡 2 − 68364.3 = 0
t = 2 mm
𝑟 =
𝑆𝑡𝑟𝑜𝑘𝑒 𝑜𝑓 𝑝𝑖𝑠𝑜𝑛 𝐿![]()
![]()
= =
2 2
72![]()
= 36 𝑚𝑚
2
Fig. 3 shows the Von Misses stress distribution at different
𝑛′ =
𝐿𝑒𝑛𝑔𝑡ℎ 𝑜𝑓 𝐶𝑜𝑛𝑟𝑜𝑑![]()
= 4
𝐶𝑟𝑎𝑛𝑘 𝑟𝑎𝑑𝑖𝑢𝑠
point locations of connecting rod. This plot is a type of summary of above calculated stresses, which tells about critical regions/ stresses.

1000
800
𝜔 =
2𝜋𝑁![]()
=
60![]()
2𝜋 × 3000
60
= 314 𝑟𝑎𝑑/𝑠𝑒𝑐
600
400
![]()
![]()
𝑭 = 𝟏𝟎𝟎𝟎𝑾𝒓𝑽𝟐 𝐜𝐨𝐬 𝜽 ± 𝐜𝐨𝐬 𝟐𝜽
(10)
200
0
1 2 3 4 5 6 7 8 9 10 11 12 13
𝒈𝒓
𝑊𝑟 = 𝑚𝑔 = 19.62𝑁
𝒏′
Locations
![]() Tensile
Tensile ![]() Compressive
Compressive
Graph 3. Von Misses stress distribution at different point locations of conrod
𝑉 = 𝑟 × 𝜔 = 36 × 10−3 × 314 = 11.30 𝑚/𝑠
Now, Inertia forces, from Eq. (10)
Now to understand this graph or stress distribution, we will divide this connecting rod in 3 parts:
• The crank end Zone:
As shown in graph 3 and fig. 6, very low or negligible
𝐹 =![]()
1000 × 19.62 × (11.30)2
9.81 × 36
cos 𝜃 ±![]()
cos 2𝜃
4
stresses are generated near the bolt holes area. The highest von Mises stress in the region is about 177 Mpa.
• The small end zone:
𝐹 = 7094.11 𝑁
As shown in graph 3 and fig. 6, stresses near small end are 443 Mpa. Details of these results are made with table
4.3. Very high stress are generated at oil hole region and
IJSER © 2014 http://www.ijser.org
International Journal of Scientific & Engineering Research, Volume 5, Issue 5, May-2014 1259
ISSN 2229-5518
as shown in Graph 3 and fig. 7, it is 707 Mpa, which
exceeds its yield strength.
• Web zone:
As shown in graph 3 and figure 6, this region faces with
404 Mpa stresses.
Graph 4 shows the factor of safety (FS) on vertical axes, the ratio of yield strength to maximum von Mises stress under service operating condition for fifteen locations with reference to figure 6, over the entire operating load range of the connecting rod. Though the factor of safety for conrod design is unknown, factor of safety used for conrod can be known.
As shown in Graph 4, there is large margin for material
removal from locations 1, 2, 12, 13, 14 and 15. But for locations
3, 4, 9, 10 and 11, the martial removal scope may or may not
exist due to factor safety used.
Therefore by choosing different locations from connecting rod will definitely gives a scope for Weight reduction. Instead of
obtaining weight reduction in the connecting rod geometry.
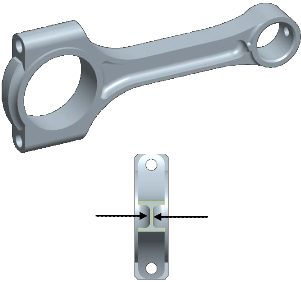
Fig.13 shows a modification in connecting rod geometry
having a mass reduced to 0.380 Kg which is less than that of
original connecting rod. In original connecting rod, rib thickness was 3 mm which is reduced to 2 mm and also the crank area is also modified.
With this modified connecting rod, FEA is performed and the stress distribution is as shown in fig. 14.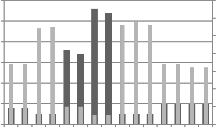
30
25
20
15
10
5
0
1 2 3 4 5 6 7 8 9 10 11 12 13 14 15
Location
![]()
FS ![]() Von Mises Stress (Mpa)
Von Mises Stress (Mpa)
350
300
250
200
150
100
50
0
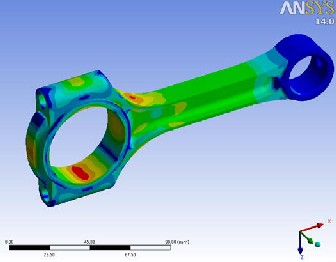
Fig. 14. FEA of Modified Connecting rod.
This overview research report studies the possibilities of weight reduction in forged steel connecting rod. For weight
Graph 4. FS and the maximum Von Mises stress in the whole operating range.
considering stresses at just few locations, the stresses at all the nodes are considered. As per the results, analysis shown in graph 3 and graph 4, several iterations are performed in FEA for
2 mm
Fig. 13. Modified Connecting rod
reduction process, fatigue strength and static strength were considered as a structural factor. First, the connecting rod was
3D modeled. Fatigue testing was performed, and corrections were made in the problematic area. After that load analysis was performed using ansys software.
From the results of the study, following conclusion can be made.
1. During fatigue testing, failure was occurred at the oil hole are and same thing was observed during FEA analysis of the connecting rod. But after changing angle at chamfer, failure was restricted as per the observation made in modified connecting rod geometry.
2. In connecting rod design, fatigue is most important factor.
3. The connecting rod is designed at its maximum engine speed and maximum gas pressure.
4. As per the results received from FEA, there is large margin of material removal from big end area, small end area and area connecting to small end the of connecting rod.
5. As per the results received from analytical calculations, there may be a scope of reduction in its “I- section” thickness.[4,5]
6. The new connecting rod geometry is lighter than original connecting rod.[3]
7. High carbon micro-alloyed steel i.e. C70S6 material has higher mechanical properties and better machinability and lower ductility.
IJSER © 2014 http://www.ijser.org
International Journal of Scientific & Engineering Research, Volume 5, Issue 5, May-2014 1260
ISSN 2229-5518
The authors are very much grateful to mechanical Engineering department, Government College of Engineering Aurangabad, for giving some of the valuable suggestions for the design and analysis of the project with a proper guidance for completion of the project.
1. Serag, S., Sevien, L., Sheha, G., and El-Beshtawi, I., 1989, “Optimal design of the connecting-rod”, Modelling, Simulation and Control, B, AMSE Press, Vol. 24, No. 3, pp. 49-63.
2. Pai, C. L., 1996, “The shape optimization of a connecting rod with fatigue life constraint,” Int. J. of Materials and Product Technology, Vol. 11, No. 5-6, pp. 357-370.
3. Afzal, A. and Fatemi, A., 2004, “A Comparative Study of Forged Steel and PM Connecting Rods,” SAE Technical Paper Series, Paper No. 2004-01-1529,
4. Leela Krishna Vegi and Venu Gopal Vegi. 2003," Design and analysis of Connecting rod using forged steel", ISSN,
Volume 4, Issue 6.
5. RS Khurmi, JK Gupta, 2005, “machine Design”, S.Chand
Publications, New Delhi, 4th edition.
6. ANSYS, "Modeling and Meshing Guide", Analysis Guide,
Version 14.0. ANSYS, Inc. Canonsburg, pp. 28-265.
7. Pro-Engineer, “Part Modelling Guide” Pro-Engineer Guide,
Version 4.0 Pro-E.
8. ASM Hand Book, 2005, "Fatigue and Fracture Mechanics", Volume 19, ASM International, Material Park. Publications", OH.(USA), pp. 15-989.
9. ASM Hand Book, 2005, "Material selection and Design", Volume 20, ASM International, Material Park. Publications",
OH.(USA), pp. 385-521.
IJSER © 2014 http://www.ijser.org