waves (Figure 1)
International Journal of Scientific & Engineering Research, Volume 6, Issue 4, April-2015 339
ISSN 2229-5518
DESIGN AND IMPLEMENTATION OF ECG TELEMETRY SYSTEM BASED ON ZigBee
Akshay Dunakhe, Shripad Kenekar, Santosh Rajgade
Abstract— cardiovascular diseases are nothing but the diseases that involve heart and blood vessels or both. Cardiovascular diseases are one of the leading causes of death in the current scenario across the world. According to W orld Bank the deaths due to cardiovascular diseases have been increased at a faster rate in developed as well as developing countries. One of the most useful methods for the detection and further treatment of the cardiovascular diseases is the ECG system. This paper describes the ECG telemetry system based on ZigBee protocol used for wireless transmission. This system can help the diagnosis of cardiovascular diseases during emergency. In this system we have obtained ECG signal from electrodes placed on the limbs of the patient, the signal is filtered by analog filter system and then it is digitized using on-chip ADC of microcontroller. The digital output from the microcontroller is then fed to ZigBee module. The signal is then transmitted via the ZigBee transmitter receiver which can be displayed on computer and utilized by the doctor for diagnosis of patient.
Index Terms— Biotelemetry, Cardiovascular, Diseases, Electrocardiograph, ECG telemetry, ZigBee
—————————— ——————————
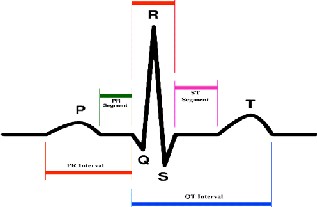
he major function of the heart is to pump the blood. An ECG stands for electrocardiogram which defines graphical representation of an electrical conductivity of the heart occur due to pumping activity of the heart. The electrical conductivity of the heart is exhibited by the four major parts: SA node (Sinoatrial node), AV node (Atrioventricular node), bundle of His and Purkinje fiber. The SA node which is natural pacemaker of the heart creates an electrical impulse. The ECG waveform is nothing but the graphical representation of electrical conductivity of the heart. The typical ECG wave form is characterized by P, QRS and T
waves (Figure 1)
Fig 1: Waves and intervals. Figure provided by Wikipedia. September
15th, 2008.
————————————————
• Shripad Kenekar is currently pursuing Bachelors degree in Instrumentation
Engineering from AISSMS`s IOIT, Pune Maharashtra, India.
• Santosh Rajgade is professor in AISSMS`s IOIT, Pune Maharashtra, India.
Firstly, initiation of pulse of contraction and depolarization of atria results into P wave of ECG. The P wave last for 0.11 sec with the amplitude of 0.25mV. Secondly the QRS complex is combined action of repolarization of atria and depolarization of ventricles. Lastly the T wave is the result of ventricular repolarization. If there is U wave present it is generally considered as the result of after potentials present in the ventricles[1]. The frequency range for ambulatory ECG wave form is 0.05Hz to 150Hz.
Telemetry system incorporates the transmission and reception of measured quantities over the distance. The purpose of telemetry is to obtain the measured data from remote place. ECG telemetry is the part of biotelemetry in which the ECG data from patient end such a hospital, house, or any remote place is transmitted and reception of the data at doctor`s desk is done. Though, the ECG telemetry system includes the web of wires coming from the electrodes, ECG telemetry offers great advantage that it provides isolation between patient and the ground line of recording machine.
The electrodes used here in the system are of pre-gelled disposable electrodes. These electrodes are of simple snap type electrode which ensures the ease of operation. The main reason to use the disposable type of electrode was to enable the patient to place the electrodes on body even in the absence of doctor or care taker. Moreover the pre-gelled ECG electrodes reduce the noise induced due to double layer present between electrode and skin surface.
IJSER © 2015 http://www.ijser.org
International Journal of Scientific & Engineering Research, Volume 6, Issue 4, April-2015 340
ISSN 2229-5518
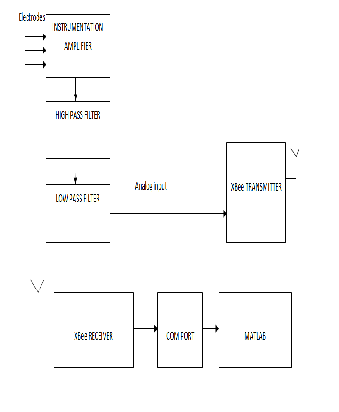
CMRR, adjustable gain and high input impedance. In the case we have used AD620 with gain of 500. High CMRR of the AD620 greatly reduce the interference caused due to common mode voltages.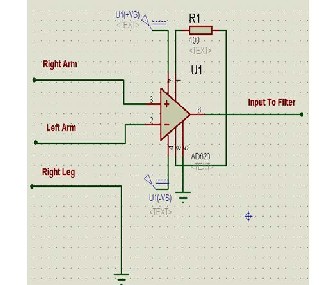
Fig 2: ECG Telemetry Block Diagram
This section describes the ECG telemetry system design. In design procedure of ECG amplifier we have to take in consideration the frequency of ECG signal, the artifacts which may introduce noise in the actual signal. The artifacts that may induce noise are motion artefact, power line noise and base line shift. To reduce baseline shift and the motion artefact we have used band-pass filter. To avoid the interference caused due to 60Hz power line noise we opted to go with battery powered design.
The electrodes configuration used is the Lead I configuration. It is bipolar configuration as it records electrocardiogram from two leads only. The third lead is for reference purpose and is grounded. In Lead I configuration electrocardiogram is recorded from right arm and left arm and the right leg is grounded.
The Lead I configuration is,
Lead I : Left Arm (LA) and Right Arm (RA)[1]
Fig 3: Instrumentation Amplifier using AD620
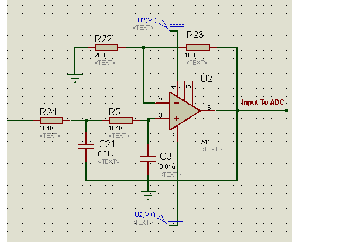
Low-pass filter is the first stage in the band-pass filter. The band pass filter is implemented to reduce the high frequency as well as dc components from the electrocardiogram. The order of filter is second order. We have implemented low-pass filter with high cut off frequency 150Hz. This low-pass filter rejects higher frequency components than 150 Hz.
Filter component values are decided from the following
equation[2]![]()
𝑓 = 1
𝐻 2π�R2 R3 C2C3
Where the R2 , R3 , C2 , C3 are the frequency deciding resistors and capacitors.
The electric signals derived from the heart are very weak in amplitude of the order of 0.025mV to 4mV. Thus, to amplify such a weak biosignal an instrumentation amplifier is used. Instrumentation amplifier offers advantages such as high
IJSER © 2015 http://www.ijser.org
International Journal of Scientific & Engineering Research, Volume 6, Issue 4, April-2015 341
ISSN 2229-5518
Fig 4: Low Pass Filter Design
High-pass filter is the second stage of band-pass filter with low cut off frequency 0.05 Hz and second order. High-pass filter rejects the noise caused because of DC component present in the input signal. The main source of DC component in the electrocardiogram is the voltage generated due to the action of breathing. Thus, to reduce this noise high-pass filter was used. Second order high-pass filter can be formed from second-order low-pass filter simply by interchanging the positions of frequency determining resistors and capacitors [2]. The values of frequency deciding resistors and capacitors is given by the equation[2]![]()
𝑓 = 1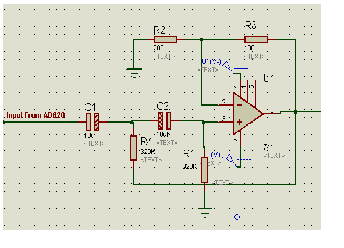
𝐿 2π�R2 R3 C2 C3
Fig 5: High-Pass filter design
In real world the physical data is in analog form which
cannot be understood by the computer. Thus, to transfer this data on computer we had to use device which is able to convert analog data to some discrete values. These discrete values can be understood by the computer and hence can be further processed in computer. The Analog to Digital Converter (ADC) used in this application is the onchip ADC of microcontroller ATmega16. Port A of the ATmega16 is dedicated to analog inputs. Analog signal is given to one of the 8 analog channels available on ATmega16 and is converted to digital form with resolution of 10 bit. The converted data is then sent to wireless communication module via USART of the ATmega16.
ZigBee is IEEE standard based wireless communication technology and is used for monitoring and control applications. The IEEE standard 802.15.4 is the standard designed for Personal Area Network (PAN). The primary purpose of ZigBee protocol is to replace non-standard wireless communication protocols that are exists today. The main reason to use ZigBee protocol was that it offers very low power consumption. Moreover it also provides some features to the user such as standard based communication, world usability, simplicity of design and increased security and reliability. The operating range of ZigBee is typically 2.4 GHz.
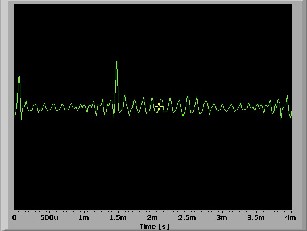
Thus, we have obtained following result from ECG monitoring system which clearly shows the QRS complex which can be used for determining the heart rate of patient.
IJSER © 2015 http://www.ijser.org
International Journal of Scientific & Engineering Research, Volume 6, Issue 4, April-2015 342
ISSN 2229-5518
Fig 4: ECG wave obtained from the designed system
From the literature survey that we did about the conventional ECG system, we observed that the main disadvantage of such system is it consists of a web of wires around the patient which makes the patient uncomfortable as well as for doctor it is difficult to operate. The ECG telemetry that we have designed reduced the use of wires up to certain extent which is beneficial for both the patient as well as doctor. Moreover telemetry system offers advantages such as reduced time consumption as doctor can prepare for an emergency case well in time. The reason behind using ZigBee is that it offers the standard wireless communication technology with minimal power consumption, it is user friendly and also it is cost effective providing ease of programming as compared to GSM.
A. The ECG telemetry system based mobile communication: The ECG stored in the memory of microcontroller can be transmitted to the remote places across the world using GSM Modules.
B. The ECG telemetry system based on Internet:
The system can be designed based on internet as a transmission media which help to transmit the required signal across the world.
We have great pleasure in presenting our project title, “Design and Implementation of ECG Telemetry System Based on ZigBee”. We would like to express our sincere and whole hearted thanks to our guide Prof. S.C.Rajgade who distributed with us his valuable time and knowledge and provided guidance throughout the project work. We would also like to thanks our subject teacher Prof. Dipti P. Inamdar for her valuable guidance.
8 REFERENCES
[1] Leslie Cromwell, Fred J. Weibell, Erich A. Pfeiffer ,“Biomedical Instrumentation and Measurement”, Prentice Hall Of India, 2nd Edition.
[2] Ramakant Gaikwad, ”Op-Amps and Linear Integrated Circuits ”,
th
Pearson Education, 4
Edition.
[3] John G. Webster. Medical Instrumentation Application and Design
[4] Carr J. Joseph, John M. Brown, “Introduction to Biomedical
Equipment Technology”, Pearson Education, Low Price Edition. [5] Naazneen M. G., et al ,”Design and Implementation of ECG
Monitoring and Heart Rate Measurement System”, International
Journal of Engineering Science and Innovative Technology (IJESIT)
IJSER © 2015 http://www.ijser.org