International Journal of Scientific & Engineering Research, Volume 5, Issue 12, December-2014 839
ISSN 2229-5518
Computer-Assisted Structure Verification of
Eudesmane-type Sesquiterpenes using
Generalized Regression Neural Network
(GRNN)
Taye Temitope Alawode*, Kehinde Olukunmi Alawode
Abstract— This work describes procedures utilizing GRNN in the verification of structures of Eudesmane sesquiterpenes from 13C NMR chemical shift values. In the first procedure, the substituent types on skeletons of 291 Eudesmane sesquiterpenes were coded and used as input data for the network. The 13C NMR chemical shift values on the skeleton of the compounds were used as output data. After training, the network was simulated using thirty-four test compounds. Average and standard deviations were used to measure the accuracy of the predictions of the network. The procedure has a high potential to identify the Eudesmane skeleton as a substructure in the test compounds. A related procedure utilizing a GRNN trained employing 13C NMR and coded substituents as input and output data respectively, was able to predict the substituents attached to various sites of the Eudesmane skeleton.
Index Terms— 13C NMR, Eudesmane skeleton, GRNN, Sesquiterpenes, substituents, verification, prediction
—————————— ——————————
1 INTRODUCTION
Organic chemists are constantly faced with the challenge of either verifying chemical structures or elucidating the chemi- cal structures of unknowns. Both processes involve the acqui- sition and analysis of an array of spectral data and both pro- cesses are known to be amenable to algorithmic solutions. Chemists frequently propose chemical structure(s) based on sample origin or knowledge of the potential product(s) of a particular chemical reaction. With this foreknowledge, the approach generally adopted is to acquire and then examine the spectral data in terms of consistency between spectroscop- ic expectations from the proposed structure and experimental data. This workflow requires experience in spectral interpreta- tion, experimental access to the necessary data and, where appropriate, access to software tools for spectral prediction and comparison [1]. Methods for 1D NMR spectral prediction include rule-based approach for particular classes of com- pounds or as a suite of software tools covering one or more NMR active nuclei. Agreement between the recorded and predicted NMR spectral data is the primary tool used to iden- tify the most probable structure in a set of suggested struc- tures. Numerous studies devoted to NMR chemical shift cal- culation have been reported [2-4].
The structure verification process compares a calculated chem-
ical shift or spectrum; either 1D or 2D with the corresponding
experimental data and the structural hypothesis is either ac- cepted, rejected, or can be revised on the basis of visual in- spection or calculated mean or standard deviations [5]. Alter- natively, it may be obvious from this analysis that additional homo- or heteronuclear correlation data must be acquired to verify the structure or to test a revised structure. The two most widely used procedures for predicting NMR spectra are the construction of empirical models[6-8] and the application of prediction algorithms extracted from data collected within

spectral databases[9-10]. Certain applications use both
Kehinde Olukunmi Alawode is a lecturer with the Department of Electrical and Electronics Engineering, Osun State Universi- ty, Osogbo, Osun State, Nigeria. Email: kenyem1@yahoo.com
*Corresponding Author: Taye Temitope Alawode is a lecturer with the Department of Chemical Sciences, Federal University Otuoke, Bayelsa State, Nigeria. Email: onatop2003@yahoo.com approaches simultaneously [11]. Prediction of 13C NMR chem- ical shifts using artificial neural networks (ANN) has also been reported[12-15].
In a previous work[16], we have shown that GRNN, an archi-

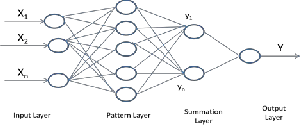
tecture of ANN, could identify the substituents on the skeleton of Eudesmane compounds when 13C NMR chemical shift val- ues at the various positions on their skeletons were used as inputs for the system. (Figs. 1 and 2 shows a single neuron model and the general structure of GRNN) [17]. In this work, we show that GRNN can predict the 13C NMR chemical shift values at the various positions on skeletons of Eudesmane sesquiterpenes. We also demonstrate how these procedures may be used as complementary tools for structure verification and revision of selected Eudesmane sesquiterpenes.
Fig. 1. Single Neuron Model [17]
IJSER © 2014 http://www.ijser.org
International Journal of Scientific & Engineering Research, Volume 5, Issue 12, December-2014 840
ISSN 2229-5518
Fig. 2. General Structure of GRNN[17]
2 EXPERIMENTAL
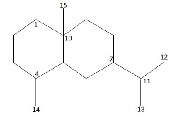
For identification purposes and for structural elucidation of new compounds, it is necessary to have access to extensive list of their structural data. In the present study, we made use of structural (skeletal) 13C data, substituents and stereochemical information of 325 (out of the total 350) eudesmane com- pounds published by Olievera et al (2000) [18]. This infor- mation can be extracted from data of eudesmane sesquiter- penes published in literature by isolating 13C values of the skeletal (carbon) from those of the substituents. The com- pounds left out were those whose substituents were not stated explicitly due to structural complexity. ANNs work through learning method, their training must, therefore, be done with the use of well detailed and correct data to avoid an erroneous learning process. Of the 325 compounds used, thirty-four (34) were reserved for use as test cases (these were not used in training the neural network). The structure of the eudesmane skeleton with the numbering of each carbon atom is shown in Fig. 3.
Fig. 3. The Eudesmane Skeleton[18]
Three Excel worksheets containing coded information on the input and target data for the training and test compounds were prepared. On the first row of the first sheet, the com- pounds were assigned codes 1-291. In the first column of the same sheet, the positions of each carbon atoms on the skeleton (as shown in Figure 3) were coded as 1-15. In preparing the input data, each substituent type (on first encounter) was as- signed 3 number codes. These codes serve to identify the sub- stituent while also taking into account its possible stereochem- istry (α or β) in various positions of the skeletons in other compounds. Carbon positions without substituents were as- signed a code of 0 while α and β positions without substitu- ent(s) were assigned codes of 1 and 2 respectively. For exam- ple, OH group was given a code of 3, an α-OH is given a code of 4 while a β-OH was assigned a code of 5. The designated codes for the substituent(s) (on each compound) were as- signed to their correct position on the skeleton (previously coded 1-15).
On the second excel sheet, the compounds and the positions of the carbon atoms on the skeleton are coded as described pre- viously. The 13C chemical shift data for each Carbon at each of the 15 positions was recorded for each compound. These rep- resent the target data subsequently used in training of the net. A third excel sheet in the format just described was prepared except that it contains the codes for the substituents on the various positions of the eudesmane skeleton of the com- pounds (coded 1-34). Since Artificial Neural Networks learn through examples, the test compounds were selected based on the representativeness of their substitution patterns in the ta- ble of structural information published by Olievera et al (2000) [18]. This was done largely by visual inspection. These repre- sent the input data for the test compounds.
After the construction of the worksheets, the data were trans- ferred into the Neural Network toolbox of MATLAB 7.8.0. From the command window, the ‘nntool’ command was used to designate the imported data appropriately as ‘input’ or ‘tar- get’. Generalized Regression Neural Network was used to train the data at different spread constant values (0.05, 0.5, 1.0,
5.0, 10.0, 15.0, 20.0, 25.0, 30.0, 35.0, 40.0, 45.0, 50.0, 60.0, 70.0,
80.0, 90.0 and 100.0). The effectiveness of each training was
assessed by simulation with the test data (not previously used
for training and therefore unknown to the network). The aim
was to ascertain whether the neural network would be able to predict correctly the 13C NMR chemical shift values on the various positions of the eudesmane skeleton.
We have described a similar procedure previously that could identify the substituents on the Eudesmane skeleton from 13C NMR data. This system utilizes as input 13C NMR chemical
shift values on the skeleton of Eudesmane compounds. The outputs are substituents coded as described above. In order to demonstrate the use of this procedure in revision of structures of Eudesmanes, experimental 13C NMR chemical shift values of 5 compounds (3, 5, 7, 9 and 11) were used as input to the system. The results are presented in Table 2.
3 RESULTS AND DISCUSSION
The structure of any natural product is conventionally divisi- ble into three sub-units: (i) the skeletal atoms; (ii) heteroatoms directly bonded to the skeletal atoms or unsaturations be- tween them; and (iii) secondary carbon chains, usually bound to a skeletal atom through an ester or ether linkage [19]. The procedures adopted in the current work aimed to verify the structure of Eudesmane sesquiterpenes by first establishing the presence of the eudesmane skeleton in a test compounds by comparing the predicted 13C NMR spectral data with the experimental data. This procedure allows the spectroscopist to identify from the experimental data 13C NMR values due to the eudesmane skeleton which are used as input in the second network to identify the substituents on the skeleton of the compounds. The test (Exp.) and the predicted (Pred.) 13C NMR chemical shift data for each of the thirty-four (34) test com- pounds are presented in Table 1. The spread constant values at which the best chemical shift prediction for each compound was obtained is indicated in parenthesis by the compound. The variation of the generalized error with change in spread
IJSER © 2014 http://www.ijser.org
International Journal of Scientific & Engineering Research, Volume 5, Issue 12, December-2014 841
ISSN 2229-5518
constant is an important parameter to access the efficacy of any GRNN. A network that gives a constant error for a broad range of spread constant is considered better since designers can choose from a wide range of spread constant values for their network. In the current work, best results were generally obtained at spread constant values of between 0.5 and 5.0 (with few exceptions in compounds 13, 18, 25, 28 and 32). Er- rors in measurements (estimated as average/ standard devia- tion) generally increased below or above these values.
Since often not the absolute deviation in predicting 13C NMR
chemical shifts are important, but the individual incorrect
predictions at each carbon site on the skeleton (resulting in the
average/standard deviations observed), we count the number
of correct assignments. A predicted value was deemed correct
if it falls within ±2 range from experimentally determined
IJSER © 2014 http://www.ijser.org
International Journal of Scientific & Engineering Research, Volume 5, Issue 12, December-2014 842
ISSN 2229-5518

Table 1: Expected (Exp.) and Predicted (Pred.) 13C NMR Chemical Shift data for test compounds


1(σ =0.5) 2=(σ =5.0) 3(σ = 1.0) 4(σ = 1.0) 5 (σ = 5.0) 6 (σ = 30.0) 7(σ = 1.0) 8(σ =80.0) SITE Exp. Pred. Exp. Pred. Exp. Pred. Exp. Pred. Exp. Pred. Exp. Pred. Exp. Pred. Exp. Pred. C-1 78.9 80.4 84.5 84.6 76.1 76.9 79.0 75.7 70.7 70.6 72.6 72.2 71.6 71.1 75.0 69.2
C-2 26.7 28.7 23.4 23.7 71.3 71.0 23.4 26.5 71.3 70.5 67.7 44.9 70.4 70.5 67.3 53.8
C-3 45.2 41.6 43.0 42.3 32.4 32.5 26.7 22.8 30.9 31.0 44.1 32.1 31.5 31.1 41.1 39.6
C-4 75.4 71.2 82.5 82.4 33.5 33.0 39.9 39.8 39.2 39.3 70.2 45.2 39.8 39.5 72.1 65.1
C-5 55.3 55.3 57.4 54.8 91.4 91.0 88.5 88.2 87 87.2 91.7 87.4 87.6 87.3 91.5 90.7
C-6 69.7 69.8 69.4 70.9 75.1 75.0 32.0 36.3 35.9 37.0 69.2 63.4 36.1 36.0 76.9 71.9
C-7 49.9 49.9 49.8 46.2 53.0 52.5 48.0 47.2 43.7 43.8 54.1 50.6 44.0 43.7 53.6 53.8
C-8 21.2 20.8 23.8 22.1 72.0 72.5 70.0 76.7 31.1 31.2 77.3 60.1 31.3 31.2 73.8 84.0
C-9 41.0 41.4 33.1 30.7 75.7 76.0 74.3 76.1 74.3 74.1 72.3 71.4 73.8 73.5 75.3 72.5
C-10 34.8 39.1 48.5 48.3 49.0 49.0 49.0 50.1 47 47.2 50.1 48.1 47.4 47.0 50.6 52.7
C-11 28.9 28.8 29.6 28.3 81.3 81.5 80.5 81.7 82.3 82.3 84.8 83.7 82.6 82.2 84.4 84.9
C-12 21.2 21.3 21.8 22.7 24.1 24.0 22.9 24.4 24 22.2 26.7 27.6 19.3 19.3 30.0 28.2
C-13 20.8 20.7 21.0 20.3 30.7 30.9 29.9 30.8 30.2 26.3 30.3 28.3 20.1 20.1 26.7 28.5
C-14 21.6 24.7 17.8 23.1 18.7 18.0 16.1 16.9 19.4 21.1 25.5 19.3 24.5 24.2 24.2 23.7
C-15 15.3 14.9 22.8 17.2 13.3 13.1 61.2 61.6 20 24.0 20.7 25.8 30.4 30.2 61.7 58.3
Avg. Dev. 1.39 1.71 0.32 1.79 0.94 6.81 0.15 3.54
Std. Dev. 2.16 2.46 0.41 2.64 1.67 8.85 0.18 5.20
Corr. Ptsa 11 11 15 10 13 6 15 8
aNumber of sites where 13C NMR Chemical Shift values are predicted within ±2 of experimental value
IJSER © 2014 http://www.ijser.org
International Journal of Scientific & Engineering Research, Volume 5, Issue 12, December-2014 843
ISSN 2229-5518

Table 1 (continues): Expected (Exp.) and Predicted (Pred.) 13C NMR Chemical Shift data for test compounds


9(σ =1.0) 10 (σ =5.0) 11(σ =1.0) 12(σ =1.0) 13 (σ = 50.0) 14(σ= 0.5) 15 (σ = 1.0) 16 (σ = 1.0) SITE Exp. Pred. Exp. Pred. Exp. Pred. Exp. Pred. Exp. Pred. Exp. Pred. Exp. Pred. Exp. Pred. C-1 70.0 69.8 76.2 74.3 73.4 73.7 75.3 75.4 68.4 68.5 41.6 44.2 40.5 44.2 41.4 79.9
C-2 67.9 67.9 70.7 68.8 24.0 24.2 25.1 25.2 68.2 68.2 19.2 20.0 20.8 20.0 20.1 28.6
C-3 42.2 42.2 31.7 42.1 38.1 38.3 37.9 38.0 41.9 42.0 41.6 45.4 39.5 45.4 44.5 37.7
C-4 69.6 69.6 34.2 69.8 70.4 70.5 70.5 70.7 69.6 69.8 71.9 71.7 71.8 71.7 77.0 71.9
C-5 91.2 91.2 92.4 93.4 92.6 92.5 92.1 92.2 91.1 91.1 51.0 57.2 53.0 57.2 48.5 47.3
C-6 78.1 78.1 75.5 74.6 78.1 78.2 72.6 72.8 71.7 71.8 77.9 69.4 70.9 69.4 20.5 20.9
C-7 49.2 49.2 65.8 65.0 52.1 54.2 53.2 53.3 49.0 49.1 44.4 50.2 49.8 50.2 41.7 41.3
C-8 34.5 34.5 198.7 197.1 77.2 72.8 78.1 78.3 34.6 34.5 23.2 21.3 26.7 21.3 21.3 20.6
C-9 69.8 69.3 80.4 79.7 76.5 80.2 70.3 70.4 78.1 78.4 39.1 43.5 80.5 43.5 41.5 41.2
C-10 55.1 54.9 52.7 53.1 47.9 48.1 52.4 52.5 55.2 55.3 37.3 34.5 39.4 34.5 34.2 38.7
C-11 84.6 84.5 84.1 85.2 84.1 84.3 82.7 82.8 84.5 84.6 24.0 28.8 28.7 28.8 74.6 74.8
C-12 25.7 26.5 25.6 25.2 29.7 30.0 24.3 24.4 25.5 25.7 22.3 21.3 21.3 21.3 29.9 29.7
C-13 29.4 29.4 31.2 29.3 25.5 25.7 29.5 29.6 25.1 25.2 25.3 20.7 20.4 20.7 29.5 29.7
C-14 25.1 25.0 18.6 24.6 23.7 23.9 22.7 22.8 29.2 29.3 23.4 24.6 29.7 24.6 21.8 22.2
C-15 65.9 65.9 61.0 61.1 13.3 13.6 60.5 60.7 65.2 65.3 19.5 21.3 13.7 21.3 18.4 13.2
Avg. Dev. 0.13 5.75 0.73 0.04 0.06 3.20 5.83 5.97
Std. Dev. 0.27 9.63 1.63 0.05 0.09 4.11 10.36 10.70

Corr. Ptsa 15 12 15 15 15 6 7 9
aNumber of sites where 13C NMR Chemical Shift values are predicted within ±2 of experimental value
IJSER © 2014 http://www.ijser.org
International Journal of Scientific & Engineering Research, Volume 5, Issue 12, December-2014 844
ISSN 2229-5518

Table 1 (continues): Expected (Exp.) and Predicted (Pred.) 13C NMR Chemical Shift data for test compounds


17(σ = 5.0) 18(σ = 15.0) 19(σ = 0.5) 20(σ = 0.5) 21(σ = 1.0) 22(σ = 0.5) 23(σ = 1.0) 24 (σ = 1.0) 25(σ = 0.05) SITE Exp. Pred. Exp. Pred. Exp. Pred. Exp. Pred. Exp. Pred. Exp. Pred. Exp. Pred. Exp. Pred. Exp. Pred. C-1 76.7 37.8 76.8 72.9 37.4 45.7 79.2 77.2 80.7 79.1 31.9 32.0 36.5 31.7 81.5 80.0 78.7 78.7
C-2 32.1 22.9 26.7 35.9 33.8 68.8 32.5 31.9 28.0 31.5 25.1 25.9 25.6 23.1 40.6 40.7 30.0 30.0
C-3 121.2 124.1 32.1 69.9 199 200.4 35.2 35.1 33.8 34.2 73.4 73.4 72.9 73.9 39.4 39.7 39.7 39.7
C-4 133.5 133.5 139.2 142.5 128.9 125.9 146.4 146.2 148.2 148.6 75.4 72.1 85.7 81.8 70.9 71.0 71.0 71.0
C-5 50.8 44.3 136.4 133.7 162.6 164.2 56.2 55.9 48.7 48.9 48.9 49.0 48.6 48.6 46.8 46.5 47.6 47.6
C-6 71.4 69.8 206.8 207.8 28.8 29.0 67.2 67.0 24.2 24.8 143.2 143.6 140.1 140.9 23.5 26.9 26.8 26.8
C-7 49.3 73.9 57.5 58.2 49.7 49.8 49.6 49.3 47.6 47.5 145.4 144.9 145.1 145.4 142.1 142.1 129.9 129.9
C-8 20.3 23.8 21.7 22.6 22.6 22.5 18.5 16.2 21.9 22.2 201.3 201.5 200.3 200 116.1 116.2 202.0 202.0
C-9 35.4 34.4 37.0 37.0 42.0 42.7 36.5 36.3 36.6 37.0 57.7 57.8 57.6 57.7 23.1 23.2 55.4 55.4
C-10 37.7 33.9 43.0 44.0 35.9 37.0 41.8 41.7 39.1 40.1 39.2 39.3 40 39.1 36.9 37.9 40.3 40.3
C-11 28.6 34.8 25.8 25.8 72.4 72.4 26.3 26.0 72.7 72.5 72 72.0 71.7 75.9 35.1 35.1 146.4 146.4
C-12 22.2 15.6 18.2 17.8 26.8 26.7 21.1 16.2 27.0 27.0 29.3 29.4 28.9 29.2 21.9 21.9 23.1 23.1
C-13 20.1 16.3 21.0 21.1 27.5 27.7 16.4 21.1 27.2 27.2 28.8 28.9 29.1 28.8 21.3 21.3 23.8 23.8
C-14 20.7 21.7 20.7 16.3 10.9 11.0 107.9 107.8 107.2 108.0 22.4 22.4 18.7 18.9 29.9 29.9 25.9 25.9
C-15 12.2 17.7 18.3 18.4 22.6 22.9 11.7 11.6 11.2 10.2 17.7 17.8 18.5 18.2 12.9 11.8 12.7 12.7
Avg. Dev.
7.68
5.57
4.96 1.06 0.65 0.48 1.40 0.57 0
Std. Dev. 12.97 10.17 9.15 1.94 1.10 0.92 2.11 1.06 0
Corr. Ptsa 4 9 12 12 14 14 11 14 15
aNumber of sites where 13C NMR Chemical Shift values are predicted within ±2 of experimental value
IJSER © 2014 http://www.ijser.org
International Journal of Scientific & Engineering Research, Volume 5, Issue 12, December-2014 845
ISSN 2229-5518

Table 1 (continues): Expected (Exp.) and Predicted (Pred.) 13C NMR Chemical Shift data for test compounds


26 (σ = 5.0) 27 (σ = 0.5) 28 (σ = 50.0) 29 (σ=10.0) 30 (σ = 5.0) 31(σ = 15.0) 32 (σ = 15.0) 33 (σ = 0.5) 34 (σ = 1.0) SITE Exp. Pred. Exp. Pred. Exp. Pred. Exp. Pred. Exp. Pred. Exp. Pred. Exp. Pred. Exp. Pred. Exp. Pred. C-1 33.4 36.4 76.1 75.3 75.5 79.1 42.9 41.0 40.9 40.9 44.3 34.2 37.8 34.2 30.7 31.2 41.9 41.3
C-2 23.1 25.6 29.6 29.3 27.8 27.2 19.5 22.5 22.7 23.3 75.3 27.4 23.0 27.3 18.5 23.7 26.7 23.4
C-3 72.3 74.7 39.1 36.5 35.6 31.5 43.6 54.7 39.7 40.4 121.6 77.5 121.1 77.4 32.2 31.3 37.8 36.8
C-4 83.4 84.5 65.9 78.8 81.3 57.7 73.5 71.8 79.7 79.2 139.0 71.7 134.8 71.7 143.4 144.6 143 150.3
C-5 45.6 45.7 60.6 57.0 56.7 54.9 57.9 53.2 47.3 47.5 47.2 49.6 46.9 49.6 129 124.7 57.9 43.7
C-6 26.1 25.6 66.3 72.3 71.7 70.9 73.3 26.1 19.6 19.6 28.9 23.7 29.4 23.7 32.9 31.2 69.3 34.3
C-7 130.5 130.0 56.3 50.6 50.7 50.4 50.3 40.3 39.4 39.4 40.1 40.4 40.1 40.4 37.1 38.4 48.1 72.9
C-8 210.7 201.7 67.5 23.8 25.2 24.4 26.8 26.2 23.3 23.0 26.7 26.0 27.4 26.0 35.7 38.3 23.9 31.3
C-9 60.4 59.9 44.5 40.8 39.9 39.7 42.6 42.0 40.6 40.3 39.8 44.2 40.1 44.2 79.9 80.1 40.4 35.9
C-10 36.0 36.5 42.4 41.7 40.8 40.6 36.3 34.5 35.0 35.0 35.2 34.3 32.3 34.3 39.1 39.4 37.4 35.4
C-11 146.1 145.0 137.7 144.2 143.7 144.1 142.3 145.2 146.6 146.7 145.1 145.5 145.3 145.5 131.6 132.6 147.3 146.7
C-12 23.7 23.3 128.8 124.7 125.2 124.9 125.8 122.1 110.8 110.9 125.1 122.5 172.4 122.5 125.5 124.8 124.6 167.8
C-13 23.1 22.7 167.4 168.1 167.9 167.9 168.3 167.2 22.7 22.8 172.3 167.8 125.0 167.8 170.8 170.8 168.1 123.3
C-14 19.3 18.3 63.7 76.0 74.8 71.9 23.8 22.0 18.1 18.2 21.0 21.0 21.1 21.0 19.8 18.9 106.9 105.1
C-15 18.3 18.1 12.9 15.0 15.3 15.5 19.7 18.6 18.8 18.9 16.4 18.4 15.7 18.4 19 18.3 17.6 15.4
Avg. Dev.
1.51 7.14 3.24 6.67 0.18 16.61 18.00 1.42 12.43
Std. Dev. 2.76 12.97 6.18 12.78 0.29 22.27 26.09 2.10 20.73
Corr. Ptsa 11 4 11 8 15 6 5 12 5
aNumber of sites where 13C NMR Chemical Shift values are predicted within ±2 of experimental value
IJSER © 2014 http://www.ijser.org
International Journal of Scientific & Engineering Research, Volume 5, Issue 12, December-2014 846
ISSN 2229-5518
Table 2: Expected (Exp.) and Predicted (Pred.) substituents on Eudesmane skeleton


SITE Compound 3 Compound 5 Compound 7 Compound 9 Compound 11

13C Val ues
Exp. Pred. 13C Values
Exp. Pred. 13C Values
Exp. Pred. 13C Values
Exp. Pred. 13C Val- ues
Exp. Pred.
C-1 76.1
C-2 71.3
β-OH α-OGly
β-OH α-OGly
70.7 OAc OAc 71.6 β - OAc
71.3 OBzt OBzt 70.4 β- OiBu
β –OAc 70.0 β-OBut β-OBut 73.4 α-OBzt α-OBzt
α-OBut 67.9 β-OBut β-OBut 24.0 - -
C-3 32.4 - - 30.9 - - 31.5 - - 42.2 - - 38.1 - -
C-4 33.5 - - 39.2 - - 39.8 - - 69.6 α-OH α-OH 70.4 β-OH β-OH
C-5 91.4
α -Oxy α –Oxy
87.0 α-Oxy α-Oxy 87.6 α- Oxy
α-Oxy 91.2 α-Oxy α-Oxy 92.6 β-Oxy β-Oxy
C-6 75.1 α-OAc α-OAc 35.9 - - 36.1 - - 78.1 α-OAc α-OAc 78.1 β -OAc β-OAc
C-7 53.0 - - 43.7 - - 44.0 - - 49.2 - - 52.1 - -
C-8 72.0 β-OBzt α -OBzt 31.1 - - 31.3 - - 34.5 - - 77.2 β -OAc β-OH
C-9 75.7
β-OBzt β-OBzt
74.3
α- OEpcin
α- OEpcin
73.8
α- OCin
α-O- trans(3’
-OAc-
2-
buten-
oate)
69.8 α-OBzt α-OFur 76.5 α-OAc α-OAc
C-10 49.0 - - 47.0 - - 47.4 - - 55.1 - - 47.9 - -
C-11 81.3
Oxy, α Oxy, α
82.3 Oxy, α Oxy, α 82.6 Oxy,
α
Oxy, α 84.6 Oxy, α Oxy, α 84.1 Oxy, β Oxy, β
C-12 24.1 - - 24.0 - - 19.3 - - 25.7 - - 29.7 - - C-13 30.7 - - 30.2 - - 20.1 - - 29.4 - - 25.5 - - C-14 18.7 β β 19.4 β β 24.5 β β 25.1 Β Β 23.7 α α C-15 13.3 β β 20.0 β β 30.4 β β 65.9 OAc, β OAc, β 13.3 α α
% Recognition 80 100 86.67 93.33 93.33
IJSER © 2014 http://www.ijser.org
International Journal of Scientific & Engineering Research, Volume 5, Issue 12, December-2014
847
ISSN 2229-5518
values. Employing this criterion, of the total of 34 compounds, the chemical shift values for all the 15 sites were correctly predicted in eight(8) com- pounds, 14 were predicted correctly in three(3) compounds and 13, 12, 11 and 10 in one(1), four (4), five (5) and one (1) respectively. This represents
64.7% of the total number of test compounds. De-
viations and/or incorrect predictions of chemical
shift values (within the limit of ±2) at carbon sites within the test compounds may be due to insuffi- cient representation of the substitution patterns at these sites among the compounds used for training the network. The quality of prediction could im- prove significantly with larger size of training data as a correlation likely exists between the size of training data and the substitution patterns observed on the skeleton.
A high-quality reference library containing both structures and complete spectra or substructures
and subspectra being representative of the types of compounds encountered in the laboratory, is an invaluable component for a CASE system [20]. The premise implicit in the spectrum interpretation is that if the spectrum of the unknown and a reference library spectrum have a subspectrum in common, then the corresponding reference substructure is also present in the unknown. This implies that where a match (within a limit of ±2 for each Carbon site on the Eudesmane skeleton, in this case) is ob- tained between the predicted 13C NMR chemical shift values and the experimental value for the compound whose structure is to be verified, the Eudesmane skeleton must be present as a substruc- ture within the compound.
Where the quality of prediction is excellent, for ex-
ample, compounds 3, 5, 7, 9, 11, 12, 13, 21, 22 and
25, it could be observed that predicted values are
sufficiently accurate to identify the 13C chemical shift values due to the various positions (sites-C1 - C15 ) on the Eudesmane skeleton from the experi-
mental data. Therefore, it is possible to isolate, from experimental data, 13C NMR chemical shift values belonging to the skeleton.
On the other hand, when skeletal data of Eudes- mane compounds are used as input in a second
network system previously described[16] the actual substituents attached to the various positions on the Eudesmane skeleton are generated. This may be a viable tool in the revision of structures of previous- ly isolated Eudesmane compounds, especially when there are doubts on the nature of substituents on the skeleton. For example, when the 13C NMR chemical shift values of compounds 3, 5, 7, 9 and 11 were supplied as inputs to the second network, the re-
sults presented in Table 2 were obtained. The per- centage recognition of each compound was taken as the number of correctly predicted substituents rela- tive to the total number of sites.
4 CONCLUSION
Neural networks learn from examples and acquire their ‘knowledge’ by induction. They can general- ize, provide flexible non-linear models of in- put/output relationships can cope with noisy data and are fault-tolerant [21]. This study shows that GRNN has the potential for use for verification of structures of organic compounds
REFERENCES
[1] Elyashberg, M. E.; Williams, A. J.; Martin, G. E.;
2008. Computer-assisted structure verification
and elucidation tools in NMR-based structure elucidation. Progress in Nuclear Magnetic Res- onance Spectroscopy; 53, pp 1–104.
[2] Quin, L. D.; Williams, A. J.; 2004. Practical Inter-
pretation of P-31 NMR. Spectra and Computer
Assisted Structure Verification, 1st Ed.; Ad- vanced Chemistry Development, Inc., Toronto.
[3] Meiler, J.; Meusinger, R; Will, M.; 2000. Fast de- termination of 13C NMR chemical shifts using artificial neural networks. J. Chem. Inf. Com- put. Sci.; 40, pp 1169-1176.
[4] Meiler, J.; Maier, M.; Will, M.; Meusinger, M. J.;
2002. Using Neural networks for 13C NMR chemical shift prediction-comparison with tra- ditional methods. Magn. Reson.; 157, pp242-
252.
[5] Furst, A.; Pretsch, E.; 1990. A computer program
for the prediction of 13C NMR chemical shifts of organic compounds, Anal. Chim. Acta; 229, pp 17-25.
[6] Clerc, J. T.; Sommerauer, H. A. ; 1977. A Mini- computer program based on Additivity Rules for the estimation of 13C NMR Chemical shift. Anal. Chim. Acta; 95, pp 33-40.
[7] Jensen, K. L.; Barber, A. S.; Small, G. W.; 1991.
Simulation of carbon-13 nuclear magnetic spec- tra of polycyclic aromatic compounds. Anal. Chem.; 63(11), pp 1082-1090.
[8] Clouser, D. L.; Jurs, P. C.; 1994. Simulation of
13C Nuclear Magnetic Resonance Spectra of Tet-
rahydropyrans Using Regression Analysis and
Neural Networks. Anal. Chim. Acta; 295, pp 221-
231.
IJSER © 2014 http://www.ijser.org
International Journal of Scientific & Engineering Research, Volume 5, Issue 12, December-2014
848
ISSN 2229-5518
[9] Bremser, W.; 1985. Expectation ranges of 13C NMR chemical shifts. Magn. Reson. Chem., 23, pp 271–275.
[10] Kalchhauser, H.; Robien, W.; 1985. CSEARCH:
A Computer program for identification of or- ganic compounds and fully-automated assign- ment of carbon-13 nuclear magnetic resonance spectra. J. Chem. Inf. Comput. Sci.; 25, pp 103-
108.

[11] Fürst, A.; Pretsch, E.; Robien, W.; 1990. Com- prehensive parameter set for the prediction of the 13C-NMR chemical shifts of sp3- hybridized carbon atoms in organic com- pounds. Anal Chim Acta.;233, pp 213–222.
[12] Kvasnicka, V.; 1991. An application of neural networks in Chemistry-prdiction of c-13 nmr chemical shifts. J. Math. Chem.; 6, pp 63-76.
[13] Ivanciuc, O.; Rabine, J. -P; Cabrol-Bass, D.; Pa-
naye, A.; Doucet, J. P.; 1996. 13C NMR chemical shift prediction of sp2 carbon atoms in acyclic alkenes using neural networks. J. Chem. Inf. Comput. Sci.; 36, pp 644-653.
[14] Ivanciuc, O.; Rabine, J. –P.; Cabrol-Bass, D.;
Panaye, A.; Doucet, J. P.; 1996. 13C NMR chemi- cal shift prediction of sp3 carbon atoms in acy- clic alkenes using neural networks. J. Chem. Inf. Comput. Sci.; 36, pp 587-598.
[15] Schweitzer, R. C.; Small, G. W.; 1997. Automat-
ed Spectrum Simulation Methods for Carbon-
13 Nuclear Magnetic Resonance Spectroscopy
Based on Database Retrieval and Model- Building Strategies. J. Chem. Inf. Comput. Sci.;
37, pp 249-257.
[16] Alawode, T. T.; Alawode, K. O.; 2014. Predic- tion of Substituent types and positions on skele- ton of Eudesmane-type sesquiterpenes using Generalized regression Neural Network (GRNN). African Journal of Pure and Applied Chemistry.; 8(7), pp 102-109.
[17]Hannan, S. A.; Manza, R. R.; Ramteke, R. J.;
2010. Generalized regression neural network and radial basis function for heart disease di- agnosis. International Journal of Computer Ap- plications;7(13), pp 7-13.
[18] Oliveira, F. C.; Ferreira, M. J. P.; Nunez, C. V.;
Rodriguez, G. V.; Emerenciano, V. P.; 2000. 13 C NMR spectroscopy of eudesmane sesquiter- penes. Progress in Nuclear Magnetic Resonance Spectroscopy; 37, pp 1–45.
[19]Rodrigues, G. V.; Campos, I. P. A.; Emerencia- no, V. P.; 1997. Applications of artificial intelli- gence to structure determination of organic compounds**. Determination of groups at- tached to skeleton of natural products using 13
C nuclear magnetic resonance spectroscopy.
Spectroscopy pp 191-200.
[20] Elyashberg, M. E.; Blinov, K. A.; Williams, A. J.; Martirosian, E. R.; Molodtsov, S. G.; 2002. Ap- plication of a new expert system for the struc- ture elucidation of natural products from their
1D and 2D NMR data. Journal of Natural Prod-
ucts; 65, pp 693-703.
[21] Schneider, G.; Wrede, P.; 1998. Artificial neural
networks for computer-based molecular design.
Progress in Biophysics & Molecular Biology. ; 70
pp 175-222.
IJSER © 2014 http://www.ijser.org
International Journal of Scientific & Engineering Research, Volume 5, Issue 12, December-2014 849
ISSN 2229-5518
IJSER © 2014 http://www.ijser.org