International Journal of Scientific & Engineering Research Volume 4, Issue 2, February-2013 1
ISSN 2229-5518
Comparing Electrostatic Precipitator Performance of Two-Stage with Single- Stage to Remove Dust from Air Stream Sabah O. H. Al-Shujairi a*
Abstract: The two-stage electrostatic precipitator used as an approach among others to avoid difficulties in collecting of high resistivity dust through the separation between the charging and collection processes and accomplish them in two different stages. Removal of cement dust from air stream was investigated by parallel-plate electrostatic precipitator, first by two-stage, and second by single-stage types. Comparison between the performance of each one to remove the cement dust was carried out. A system of many functions was provided and designed for this work, consists of air supply with variable flow rate to alter the residence time in the electrostatic precipitator, dust feeding and mixing with air, and electrostatic precipitator which operated in a single-stage or two-stage. A high-voltage power supply was used to apply a varying negative voltage (11-15 kv) to the corona electrode and the collection electrode was grounded. The experimental results show that the collection efficiencies of ESP were increased with increasing voltage and with decreasing air velocities. Although the collection efficiency of two-stage (94.5%) is found to be lower than that of single-stage (97.5%), it gave positive results which can be developed to obtain the required efficiency. Various mathematical models were examined and found that the semi-theoretical and statistical model gave a good results compared with experimental results (The average absolute error equal to 1.7% for single-stage ESP and 1.4% for two-stage ESP).
Key Words: Applied voltage, Electrostatic precipitator (ESP),Corona, Collection efficiency, Migration velocity, Single-stage, Two- stage.
INTRODUCTION
Electrostatic precipitation is a process by which gas suspended particles are electrically charged and passed through an electric field which propels the charged particles towards collecting plates. The charged particles stick to the plates, and periodically a rapping (impact) mechanism dislodges the collected particles from the plates. The dislodged particles drop into the collection hopper for removal [1].
The separation of suspended particles from gases is one of the basic scientific and technical problems of the industrial era. Control of these emissions by adequate gas-cleaning process is essential to prevent heavy, divesting air pollution, and, in many instances, to recover valuable materials, which otherwise would be carried up the stack and lost by dispersion into the atmosphere [2].
Types of Electrostatic Precipitators (ESP)
The main working parts of an electrostatic precipitator are two different electrodes. One of them, thin and small in cross section, is commonly formed by a wire or a system of points or barbs, which called the discharge electrode. The other is either a large-diameter tube or else a flat, corrugated or otherwise profiled plate, which called the collecting electrode. By the shape and layout of these later electrodes, it can be distinguished between tubular (cylindrical)
precipitator and plate-type precipitator.
Single stage ESP is designed so that the
same electric field is used for charging and
collecting particulates, figure (1). Single stage ESP
are the most common types used for the control of
particulate emissions and are either of tube or
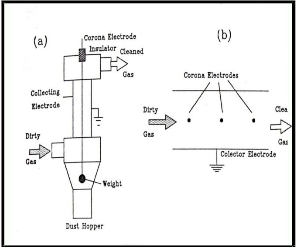
parallel plate type construction.
Figure. (1) a. cylindrical- b. parallel plate- Single-stage ESP [3]
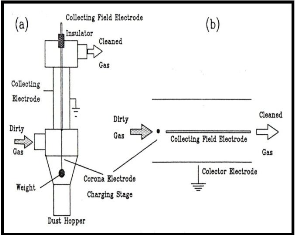
Two-stage ESP are designed so that the charging field and the collecting field are independent of each other, figure (2). The charging electrode is located upstream of the collecting plates [4].
IJSER © 2013 http://www.ijser.org
International Journal of Scientific & Engineering Research Volume 4, Issue 2, February-2013 2
ISSN 2229-5518
force toward the collection electrode. The electric charge of a dust particle is a function of the strength of electric field and the dielectric properties of the dust particles.
Crawford [8], derived equation (3) to calculate the saturation charge of the particle in the wire and plate precipitator as:
qp
2Eooro(0.8
w ro)
(3)
0.64w[(k 2) / 3kd 2 0.8
wCnvo / 3]
where:
Cnvo

6C mv
(4)
p p
Figure (2) a. cylindrical- b. parallel plate- Two-

ro rw 0.03 rw
(5)
stage ESP [3]
The aim of this research is to study and compare the performance of two-stage ESP as an approach among other ways to solve problem of highly resistive dust with the single-stage parallel plate electrostatic precipitator to remove the cement dust (which classified as relatively a high electrical resistive dust) from air stream.
The rate at which the particle collects charge will depend upon the current density in the space around the particle and the catchments area provided by the particle. The effective catchments area will decrease as the particle charges until, when the saturation charge is reached, it becomes zero.
It can be shown that the charge builds up in
the following manner [5],[9]:
MATERIALS AND METHODS
Electrostatic Precipitation Theory
A primary requirement of the electrostatic precipitation process is the generation of large
qt qp /(1 to / t )
where:
to 4oEAC / I
(6)
(7)
quantities of gas ions (corona) for charging the
aerosol particles. The generation of a corona
involves the acceleration of electrons to high
To analyze the electric field within the gas Gauss- law expressed by Allen was used [10]:
q
velocity by an electric field[5],[ 6].
From a theoretical standpoint, the field


E dA
o
(8)
required to initiate corona is that which will
produce electron energies sufficient to cause
ionizing collisions in the gas species present. Peek
[6] has shown semi-empirically that the onset of
An analysis of this equation by Crawford [8] lead to the following result which gives the mean field strength as:
corona for smooth round wires and air of relative
2Eoro (0.8
E
w ro )Cnv
density δ at an electric field strength Eo defined by:
0.8
w[(k 2) / kd 2 0.8
wCnvo]
EO 3.2 106
f ( 0.03

rw ) (1)

2Eo ro (0.8
w ro )
(9)
The voltage that must be applied to the wire
to obtain this value of field, Vo, is found by
integrating the electric field from the wire to the
0.64w

And the collecting field strength as:
plate. Vo is given by [7]:
EC
Eoro (0.8
w ro )Cnv
VO rwEO ln( rc / rw)
(2)
0.8
w[(k 2)/3kdp 0.8
wCnvo /3]
No current will flow until the voltage reaches this value, but the amount of current will increase

ro Eo
(10)
steeply for voltages above this value.
A fundamental step in electrostatic
0.8
w
At a very low current, the distortion of the
precipitation is the process of charging the
particulate matter .The particulate must be
charged for the electric field to impart a driving
electric field by the presence of space charge is so small that no interaction between the space charge and the electrostatic field needs to be considered.
IJSER © 2013 http://www.ijser.org
International Journal of Scientific & Engineering Research Volume 4, Issue 2, February-2013 3
ISSN 2229-5518
According to Davidson [11], an analytical expression for the current voltage relationship was obtained as:
m1 and m2 parameters to make the mathematics easier to write, which defined as:

I
m1 ,

J 4 o M i
2Lw2 ln( d / r
V (V Vo )
)
(11)
2 o M i L1
w
where:
m2 (Eo

ro ) 2
J is an average current density at the plate(A/m2 of plate area), and
d a parameter represented by [12]:
0.8 w
L1, represent the length of the charging section which can be arbitrarily selected, a value at least as large as the radius of the collecting section.

d
2
exp(w / ) for
w

≥ 2.0 (12)
0.5
The current required to impart the charge qp1 to
At a high current, the electric field due to
space charge is much larger than the electrostatic
the particles is given by:
field .The electrostatic field can be considered
i qp1CnvoQ
(16)
uniform and discharge wires are equivalent to a uniformly current-emitting plate. In this case, Cooperman [13] describe the voltage-current relation as:
to ensure that, the actual current supplied to the charging section should be greatly exceed the value given by equation(16),that mean I >> i.
The time available for charging the particles

J 36 o M i (V V ) 2
(13)
is the residence time of the gas in the charging
16Lw3 o
stage, given by [8, 14]:
The parallel-plate two-stage precipitator is
t L1/ u
(17)
treated as one shown in figure (2b). The charging
section consists of a vertical wires suspended
The length of collecting field according to
Crawford [8] is:
midway between the two grounded collector
plates; the collecting section has a charged plate
L2
3d
uw2

midway between and parallel to the two
collecting plates.
According to Crawford [8], the mean charge
q p1V2 C
1 2 oV2
/ q p1
w2 C
nvo
(18)
acquired by the particle at the exit from the charging stage is given by:

ln
(1 )(1 2 oV2
/ q p1
w2 C
nvo )

qp1 2
3k
o

2 (0.8
p
w ro ) E rc
According to White [2], the collecting field Ec
in a two-stage precipitators is purely electrostatic
0.64w k 2

(14)
1 8 o uE rc / I
and involves no corona current. This greatly simplifies the calculation of Ec in the case of parallel plate collector section by dividing the

The mean value E rc of the product of the field
applied voltage V2 by the plate spacing:
strength E and collecting radius rc is defined
EC V 2 / w
(19)
as[8]:
E rc
2(0.8

1
w ro )
As soon as the dust particles acquire some charge they will be influenced by the field in the precipitator. Most of the particles will migrate towards the passive collecting electrodes away
0.64w


m1 m2 r 2 E
from the discharge electrode, while a few particles very close or within the corona zone are charged
with opposite polarity and collect on the discharge
+ r 2 (
1 E 2
m1
1
m1)
1 m2
electrode [15].
The average speed with which dust
(cement) particles in an electrostatic precipitator
move towards the collecting electrode (migration

ln 0.8 w
ro
1 Eo
m1
1
m1
(15)
velocity), may be calculated from the theory by equating the electrostatic force on the particle qpEc to the drag force 6πμaω giving the relation [16]:
IJSER © 2013 http://www.ijser.org
International Journal of Scientific & Engineering Research Volume 4, Issue 2, February-2013 4
ISSN 2229-5518
q E
p c
(20)
1 exp(z2

/ 2)

6a
1
xp(Kx .exp(z ln
) dz (29)
2 e g
g )
Collection Efficiency
The collecting efficiency of an electrostatic precipitator is generally calculated by means of the formula evolved by Deutsch-Anderson which is
Allander [19],18] evaluated analytically the efficiency expression of equation (29) for the important case of the log-normal particle size distribution as follows:
2
for plate-type precipitators state [5],[17],[18]:
exp[(1 / 2) ln

1
g ]
f (, h)
(30)
1 exp(L / wu )
(21)
2 ln g
Equation (2-30) can be modified to yield [17]:
where:
1 exp(SC )
(22)
= Kxg exp (-ln2σg) ,
Where Sc (s m-1) representing the specific
collecting area,

h 1
SC AC / Q
(23)
2 ln g
The residence time, t (sec) which a particle spends in the active space of the precipitator defined as L/u (equation 17). Similarly, the particle separating time τ (sec) equals w/ω .Consequently, equation (21) can be reformulated as [14],[17]:
η = 1- exp (-t/τ) (24)
White [2],[18]derived equation (25) to calculate the efficiency of non-uniform particle size distributions from equation (22) by integration methods.
above equation represent overall efficiency which can be solved by two ways graphical or numerical solutions. It is evident from equation (30) that the efficiency depend only on the two dimensionless quantities Kxg and σg. Where the particle-size parameter xg and σg have been found from test [2],[20],[18].
The theoretical collection efficiency equations
were developed on the basis of uniform conditions
among which, the gas flow, which is not realized in the practical case. Therefore several approaches were employed to make the resulting expression
η = 1 exp( Kx) ( x)dx
0
(25)
more useful for design purpose [6,21].
In one approach, the concept of non-
Where, K a parameter defined by:
uniform particle size distribution is generalized to
include variations in gas velocity, corona current

Ac o EEc

K =
Q
(26)
density, and electric field. Computations based on this concept have been carried out by Matts and
And, γ(x) represents the size-frequency particle size distribution function.
The log-normal particle-size distribution is the most important one in practice because it holds for a wide range of industrial and natural dispersions. The size-frequency function for the log-normal distribution is [18],[2],[16]:
Ohnfeld [18],[22]which leads to an efficiency
equation of the form of equation (31) which is based on semi-empirical and statistical methods rather than on theory[18],[5].
η = 1- exp (-ωmSc)m (31)
Where m is a parameter of the statistical spread of
the variable quantities usually 0.4 to 0.6,
depending on the standard deviation of the
( z)
Where:

1 exp( z 2 / 2)
2
(27)
particle size distribution and other dust properties affecting collection efficiency, however, the value of 0.5 gives satisfactory results.
ln x ln x g

z or
ln g
x = x g exp( z ln g )
(28)
Experimental Work
The schematic diagram of the experimental pilot plant are shown in figures (3). The air was supplied to the system device by means of air blower. The powder of cement (specification of
Where xg is the geometric mean size and σg the
geometric standard deviation.
The expression for efficiency is obtained by
White [2],[18] by substitution of these equations
(27 and 28) in equation (25) yield:
cement was shown in table (1)) was introduced to the mixing chamber by means of screw conveyor from small conical hopper. The polluted air is directed to the ESP unit to be cleaned from dust
IJSER © 2013 http://www.ijser.org
International Journal of Scientific & Engineering Research Volume 4, Issue 2, February-2013 5
ISSN 2229-5518
which collected on the collection plates of electrostatic precipitator.
A sample of polluted air was taken from the system by means of vacuum pump through sampling train to obtain the concentration and particle size distribution of the dust. Cassela cascade impactor (Cassela and Co.-LTD London) was employed to determine size-cumulative weight distribution of the Cement. Also to find out the exact amount of Cement entering or leaving the ESP., table (2) shows the data obtained from dust sampling at different velocities.
TABLE (1) The Chemical Composition of Cement
Dust.
COMPOUND | COMPOSTION % |
CaO SiO2 Al2O3 Fe2O3 MgO SO3 | 63.6 22.1 6.5 3.8 1.6 2.4 |
Specific surface area Density | 3150 Cm2/g 2800 kg/m3 |
IJSER © 2013 http://www.ijser.org
International Journal of Scientific & Engineering Research Volume 4, Issue 2, February-2013 2
ISSN 2229-5518
E
11
14
6 12
4
13
5
3 7
1
2
8
8
1-blower, 2-orifice meter
3-mixing chamber, 4-screw feeder
5-motor for screw, 6-cement vessel
7-ESP, 8-cascad impactor or filter compartment,
9-rotameter
10-vacuume pump, 11-H.V.D.C. Power supply, 12-H.V. Probe
13-current meter, 14-volte meter
A, B- Valves. E - Earth
9 E 2
A B
10
One sampling train
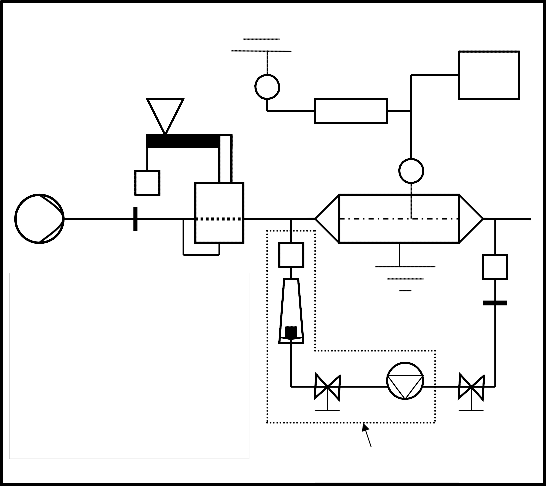
Figure (3) Schematic Diagram of Experimental Apparatus
TABLE (2) DATA OF SAMPLING FOR DIFFERENT AIR VELOCITIES.
RESULTS AND DISCUSSION
Corona V-I Characteristic
The corona current depends on the applied voltage, wire-plate spacing, wire to wire spacing, electrode geometry , and type of dust. For a given electrostatic precipitator where barbed wire used as corona discharge electrode, the change of applied voltage would lead to change the corona current.
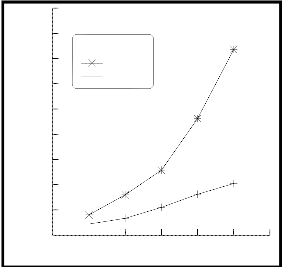
Corona current as a function of applied voltage
for both single- and two-stage ESP are shown in figure (4). This figure shows that increasing the applied voltage will increase the corona current and the lower values of corona currents observed in the two-stage ESP which are attributed to only part of the discharging electrodes being used in charging section for corona generation.
IJSER © 2013 http://www.ijser.org
International Journal of Scientific & Engineering Research Volume 4, Issue 2, February-2013 2
ISSN 2229-5518
1350.00
90.00
1200.00
1050.00
900.00
barbed wire single-stage two-stage
80.00
70.00
60.00
750.00
600.00
450.00
300.00
150.00
50.00
40.00
30.00
20.00
10.00
5.00
u= 0.7 m/s u= 1.0 m/s u= 1.4 m/s u= 1.7 m/s
0.00
10.00 11.00 12.00 13.00 14.00 15.00 16.00
Applied Voltage (kv)
Figure (4) corona (experimental) current as a function of applied voltage for both single-and two-stage ESP.
Particle Size-distribution
In lieu of cumulative mass distributions, the size distribution is often described by log-normal parameters, the two parameters needed to describe it are the mass median (or mean) diameter and the geometric standard deviation.
1.00 10.00 100.00
Particle Diameter (micrometer)
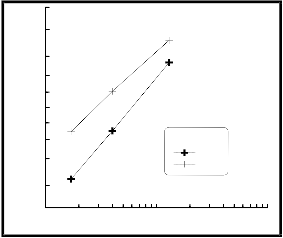
Figure (5) log-probability distribution of particle size for input dust at various velocities.
95.00
90.00
80.00
70.00
60.00
50.00
40.00
To obtain the particle size-distribution with air
velocities, the mass on the four discs were obtained
and the procedure was as follows: suppose the percentages of the total sample on each of the four discs are P1, P2, P3, and P4 respectively then the
30.00
20.00
10.00
5.00
u= 0.7 m/s
inlet outlet
following were plotted on a log-probability scale to obtain a straight line, P4 at 1.7 μm, P4+P3 at 4.0 μm, and P4+P3+P2 at 14.0μm [20,23].In such cases
the best straight line drawn through the three points might be at least gave a good idea of the mass median diameter.
The experimental results of sampling were plotted on log-probability scale as shown in figure
(5) for various air velocities. This figure shows an increase of average particle diameter with increasing air velocity.
The mean particle size of cement dust at the inlet was differ from that at the outlet of the
electrostatic precipitator for a given velocity according to the particle size-distribution obtained (figure 6), where the average diameter of input particles equal to (6.4 μm) which is larger than that for output particles which equal to (2.7 μm) i.e. large size could be captured by ESP faster compared with smaller size.
1.00 10.00 100.00
Particle Diameter (micrometer)
Figure (6) log-probability distribution of particle size for input and output dust.
Dust Collection Efficiency
The collection efficiency of cement dust by ESP is affected by the applied voltage, air velocity and migration velocity for both single-and two-stage ESP.
Collection Efficiency at Different Voltages
For a given air velocity the voltage was changed to different values (11-15 kv), therefore the collection efficiency was changed. Where the collection efficiency increased with increasing the applied voltage. When the applied voltage was increased, the corona current and electric field were increased, therefore the charge imparted to the particle will increased according to equation (3) for single-stage and equation (14) for two-stage ESP which lead to increase the migration velocity
IJSER © 2013 http://www.ijser.org
International Journal of Scientific & Engineering Research Volume 4, Issue 2, February-2013 3
ISSN 2229-5518
according to equation (20) and the collection efficiency was increased.
For a given velocity the experimental efficiency of single-stage was higher than that of two-stage ESP at a given applied voltages as shown in figure (7), which attributed to only part of the total electrostatic length used as charging section (L1) in the case of two-stage, which affect the retention time for charging particles, therefore the level of charging imparted to the particle as given in equation (6) will be less than that for single-stage ESP (the time constant (to) for particle charging according to equation (7) was higher in case of two-stage ESP than that of single-stage
99.90
99.50
99.00
98.00
95.00
90.00
80.00
70.00
Single-Stage
Applied Voltage=15 kv
Barbed Wire
theoretical experimental
ESP).
0.40 0.60 0.80 1.00 1.20 1.40 1.60 1.80 2.00
Air Velocity (m/s)
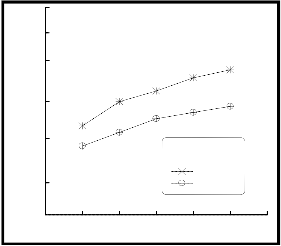
Figure (8) variation of the collection efficiency with air velocity for single-stage ESP at a given voltage.
99.50
99.00
99.90
98.00
95.00
99.50
99.00
98.00
Two-Stage
Applied Voltage= 15kv
Barbed Wire
theoretical experimental
90.00
80.00
Barbed wire u = 0.7 m/s
single-stage two-stage
95.00
90.00
70.00
10.00 11.00 12.00 13.00 14.00 15.00 16.00
Applied voltage (kv)
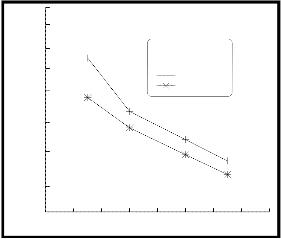
Figure (7) comparison between the collection efficiency of both single-and two-stage ESP for a given electrode shape.
Collection Efficiency at Different Air
Velocities
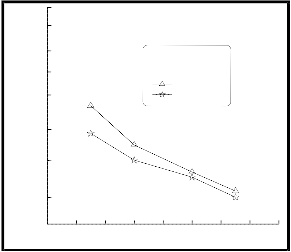
Collection efficiencies (experimental and theoretical) for a given voltage were plotted against air velocity on linear-probability scale as shown in figure (8) for single-stage ESP and figure (9) for two-stage ESP. These figures illustrate that the efficiency was inversely proportional with air velocity.
80.00
70.00
0.40 0.60 0.80 1.00 1.20 1.40 1.60 1.80 2.00
Air Velocity (m/s)
Figure (9) variation of the collection efficiency with air velocity for two-stage ESP at a given voltage
The velocity was an important factor affecting the performance of electrostatic precipitator. This effect might be taken in two different manners as follow:
A- The retention time of the particle inside the electrostatic precipitator could be controlled by changing the velocity of air. Where increasing velocity lead to decreasing the retention time as given by equation (17) , therefore the collection efficiency was decreased for agiven type of electrostatic (single-or two-stage) as a result for decreasing the charge level imparted to the particles which depend among others on retention time.
B- Re-entrainment of the collected dust on the
collection plate was directly affected by the air velocity.
IJSER © 2013 http://www.ijser.org
International Journal of Scientific & Engineering Research Volume 4, Issue 2, February-2013 4
ISSN 2229-5518
A particle which settles on the collecting electrode adheres either to the electrode surface itself, or to the dust layer which gradually builds up on that surface. Once trapped, the particle is exposed both to the aerodynamic forces generated by the gas flow, and to adhesion forces which tend to prevent its re-entrainment in the gas stream. The aerodynamic forces grow with the flow velocity; at a certain velocity, they can overcome the adhesion forces and draw the already settled particles back into the gas stream, therefore the collection efficiency decrease as shown in figure (8) for single-stage ESP and figure (9) for two-stage ESP with increasing air velocity.
Collection Efficiency at Different Migration
Velocities
Migration velocity can be obtained experimentally for specific dust as follow:
From equation (22)
ηexp = 1- exp (-ωexp Ac/Q) , Which can be
rearranged to: ωexp = -(Q/Ac) ln (1-ηexp)
Where ωexp is the migration velocity which can be found experimentally when a dust collected by ESP have a fixed dimension (Ac), for known flow rate (Q), and efficiency was found experimentally
Collection Efficiency at Different Specific
Collection Area
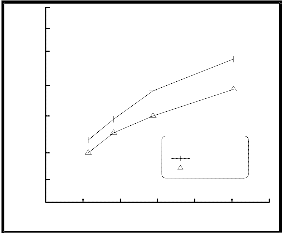
The specific collection area (Sc) was calculated by dividing the collection area by air flow rate. Figure (10) illustrates the collection efficiency of single-and two-stage ESP versus the specific collection area on a linear-probability scale. This figure shows a similar tendency of collection efficiency for both single-and two-stage ESP, in the same time the efficiency of single-stage was higher than that for two-stage at a given (Sc). The collection efficiencies increase with increasing specific collection area.
99.50
99.00
98.00
95.00
90.00
Applied Voltage= 15 kv
80.00
single-stage
two-stage
(ηexp), then the experimental migration velocity
can be determined as above. The theoretical values of migration velocity were calculated by using equation (20).The migration velocities may be affected by the particle size, saturation charge, and electric field. Table (3) shows the migration velocity at various applied voltage for both single- and two-stage ESP where the migration velocity increases with increasing applied voltage.
TABLE (3) Theoretical and experimental migration velocity for various voltages at
a given velocity (0.7 m/s) for single- and two- stage ESP.
70.00
60.00
10.00 15.00 20.00 25.00 30.00 35.00 40.00
Specific Collection Area(m2/m3/s)
Figure (10) collection efficiency of single-and two-stage ESP as a function of specific collection area.
Comparison between Various Models for Cement Dust Collection by Electrostatic Precipitator
Cement dust collection by electrostatic precipitation has many parameters which control this process; therefore many researchers present theoretical models for predicting the collection performance of an electrostatic precipitator. The existing theoretical models of ESP were validated by comparing its predictions with existing experimental data. These models are:
a-Deutch-Anderson equation which use the
average particle size of the dust (equation 22):
theo 1 exp(A C / Q)
b- Overall collection efficiency (log-normal distribution model), equation (30):
IJSER © 2013 http://www.ijser.org
International Journal of Scientific & Engineering Research Volume 4, Issue 2, February-2013 5
ISSN 2229-5518
OVER
1
exp[(1 / 2) ln 2

2 ln g
g ] f (, h)
99.00
98.00
two-stage ESP
c- Semi-theoretical and statistical method, equation
(31)
95.00
exp.
Deutch semi-theo. overall
ηsemi = 1- exp (-ωm Ac/Q)m
Where ωm is the equivalent of a performance of
ω which equal to[15]:
90.00
1

1
ωm = ω ln ( )
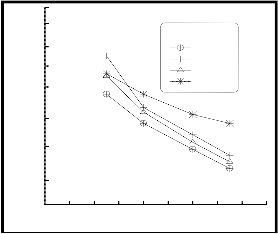
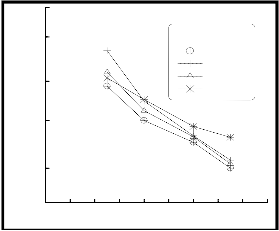
These three models were used to calculate the collection efficiency; the results were plotted in figure (11) for single-stage ESP and figure (12) for two-stage ESP on a linear-probability scale.
80.00
70.00
0.20 0.40 0.60 0.80 1.00 1.20 1.40 1.60 1.80 2.00
Velocity (m/s)
Figure (12) comparison between three theoretical models for calculating efficiency of ESP and experimental results for two-stage ESP.
99.90
99.50
99.00
98.00
95.00
90.00
80.00
70.00
single-stage ESP exp. Deutch semi-theo. overall
For two-stage ESP (figure 12), the overall efficiency model gave close results at low velocity and diverge with increasing velocity (average absolute error equal to 4.1%), where it gives high error at high velocity. Semi –theoretical model gave close result and converge with increasing velocity (average absolute error equal to 1.4%). Deutch model far away from the experimental results (average absolute error equal to 2.5%) especially at low velocity because did not consider non-ideal parameters.
Since the air velocity through the electrostatic
precipitator that required in the industry between
0.20 0.40 0.60 0.80 1.00 1.20 1.40 1.60 1.80 2.00
Velocity (m/s)
Figure (11) comparison between three theoretical models for calculating efficiency of ESP and experimental results for single-stage ESP.
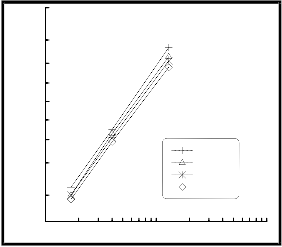
As can be seen from figure (11) the semi- theoretical model provides a better prediction of the collection efficiency than that given by the others theoretical models, where the average absolute error equal to 1.7% for semi-theoretical model, while its equal to 3.0% and 5.9% for Deutch and overall collection efficiency models respectively. The overall model gave good results at low air velocity (< 1m/s) while it diverge with increasing velocity where re-entrainment was increased until it was become far away from the experimental results compared with others. Deutch model has a large values compared with the experimental results, because did not consider non-ideal parameters.
(1-1.5m/s), therefore the semi-theoretical model is
the best model for ESP design.
CONCLUSIONS
- The main and important contribution of this present research work is to present such a device which known as two-stage ESP which can be used to avoid back corona discharge, when the dust of high resistivity (such as cement or fly ash) is to be removed, where the charging and collection processes can be separated and accomplished in two different stages.
- Collection efficiency was increased with increasing applied voltage where its equal to (92% and 88.6%) at 11kv for single- and two-stage ESP respectively, while its equal to (97.5% and 94.5%) at 15kv for single- and two-stage ESP respectively.
- Collection efficiency was inversely proportional with air velocity where its equal to (97.5% and
94.5%) at 0.7 m/s for single-and two-stage respectively, while its equal to (84% and 80%) at
1.7 m/s for single-and two-stage respectively.
IJSER © 2013 http://www.ijser.org
International Journal of Scientific & Engineering Research Volume 4, Issue 2, February-2013 6
ISSN 2229-5518
- The collection efficiency was increased with increasing specific collection area of ESP.
- The mean diameter of input particles (6.4 μm) was larger than that of output particles (2.7 μm) for a given velocity (0.7 m/s), and the average particle size was increased with increasing air velocity.
- The migration velocity would increase with
increasing the electric field and saturation charge
of the particles.
- Although the collection efficiency of two-stage ESP relatively was lower than that for single-stage ESP at a given condition tested, it gave enough positive results which may develop to accomplish the target efficiency through changing some parameters such as the length of charging section.
- Many mathematical models were examined on ESP and compared with experimental results. The semi-theoretical efficiency model was found to be the best.
REFERENCES
[1] Technical Support Document for HWC MACT Standards,
http://www.epa.gov/epaoswer/hazwaste/comb ust/tech/tsd.pdf, (February 1996).
[2] White, J. Harry, "Industrial Electrostatic
Precipitator", Addison-Wesley Pub. , 1963.
[3] Raouf, S. Tawfeeq, "Some Aspects of Computer
Simulation in the Field of
Electrostatic Precipitation", M.Sc. Thesis,
University of Baghdad, 1994.
[4] Gary, P. Greiner and McKenna, D. John,
"Electrostatic Precipitators",
http://www.eny.hut.fi/research/combustion- waste/publications.htm, 1995.
[5] Lloyd, D.A., "Electrostatic Precipitator Hand
Book", Adam Hilyer, 1988.
[6] Oglesby, S., "Electrostatic Precipitation", Marcel
Dekker INC., New York, 1978.
[7] Particulate Matter Controls,
http://www.epa.gov/ttn/catc/dir1/cs6ch3.pdf,
EPA/452/B-02-001, (September 1999).
[8] Crawford, M., "Air Pollution Control Theory",
McGraw-Hill, New York, 1976.
[9] Turner, H. James, Greiner, P. Gary, Vatavuk, M. William, "Electrostatic Precipitators", Journal of Electrostatics, Vol. 48, 1999.
[10] Allen, N., "Field Theory", Charles E. Merrill
Books INC., USA, 1966.
[11] Davidson, J.H., "Recent Trends in Electrostatic Precipitation", http://www.Icac.com, Control Technology Information, 2000.
[12] Moor, A.D., "Electrostatics and Its Applications", John Wiley & Sons, New York, 1973. [13] Cooperman, G., "A new Current-Voltage Relation for Duct Precipitators Valid for Low and High Current Density", I.E.E.E. transaction on industry application, Vol. 17, 1981.
[14] Vincent, H. James, "Electrostatic Precipitator
Performance from the Point View of Gas
Treatment Time", JAPCA, Vol. 30, No. 4, 1980.
.[16] Hinds, C. William, "Aerosol Technology, Properties, Behavior, and Measurement of Airborne Particles", 2nd edition, John Wiley & Sons INC., 1999.
[17] Storch, O., Albrecht, J., Hejma, J., Pojar, K., Urban, J., "Industrial Separators for Gas Cleaning",
Elsevier Scientific Pub.Co., 1979.
[18] White, J. Harry, "Electrostatic Precipitation of
Fly Ash", APCA Reprint series, 1977.
[19] Allander, C. and Matts, S., "The Effect of
Particle Size Distribution on Efficiency in Electrical
Precipitators", Stub 52:738, 1957.
[20] Hamoodi, A. Kadim, "Removal of Oil Ash
from Air by Electrostatic Precipitator", M.Sc.
Thesis, University of Baghdad, 1994.
[21] Gooch, P. John and Francis, L. Norman, "A
Theoretically Based Mathematical Model for Calculation of Electrostatic Precipitator Performance", Fine Particulate Control Technology, APCA reprinted series, 1975.
[22] Matts, S. and Ohnfeld, P., "Efficient Gas
Cleaning with SF Electrostatic Precipitators", bulletin of A. B. Svenska Flaktfabriken, Stockholm, Sweden.
[23] Mustafa, Y. Abdul Azez, "Removal of Cement Dust from Air by Granular Bed Filter", PH.D.Thesis, University of Baghdad, 2004.
LIST OF SYMBOLS AND ABBREVIATIONS
Ac = Surface collection area (m2). a = Radius of particle (m).
Cd = Discharge Coefficient.
Cmv = Particle concentration (kg/m3).
Cnvo= Particle concentration at the entrance of
ESP (particle/m3).
Cnv = Particle concentration at the end of ESP
(particle/m3).
dp = Particle diameter (m).
E = Electric field strength (v/m).
Ec = Collecting field strength (v/m).

E = Mean electric field strength (v/m).
Eo = Corona onset field at the wire surface (v/m).
IJSER © 2013 http://www.ijser.org
International Journal of Scientific & Engineering Research Volume 4, Issue 2, February-2013 7
ISSN 2229-5518
ESP= Symbol refer to electrostatic precipitator.
e = Charge of an electron (1.6x10⁻¹⁹ C).
f = Roughness factor of corona wire (≈ 0.6).
g = Acceleration of gravity (m/s2).
I = Corona current (amp.).
i = Current required to impart the charge to the
particle (amp.).
J = Current density (amp/m2).
k = Dielectric constant of particles.
K = Parameter (1/m).
L = Length of ESP (m).
L1 = Length of charging section (m).
L2 = Length of collecting section (m).
= Wire to wire space (m).
Mi = Ion mobility (m2/v.s).
N = Number of ions per unit volume (ion/m3).
qp = Saturation charge of particle (C).
qp1 = Mean charge of particle at the exit of
charging section (C).
qt = Charge of particle at time t (C). qv = Charge density (C/m3).
Q = Volume flow rate (m3/s). ro = Radius of corona (m).
rc = Collecting radius for wire and plate ESP
a PhD in Environmental Engineering/ Environmental Department of the central
region - Al-Anbar Province - Iraq
* E-mail: sa_shadeed@yahoo.com
Mob.: +964 7902 354 118
(equal to 0.8

w ) (m).
rw = Radius of the wire (m).
Sc = Specific collection area (m2/m3/s).
T = Absolute temperature (ok).
t = Time since start of charging (s).
to = Time constant (s).
tL = Thickness of dust layer (m). Vo = Corona onset voltage (v).
V, Vwire= Applied voltage (v).
VL = Voltage drope across dust layer (v).
V2 = Voltage of collecting electrode (v).
v' = Root mean square velocity of ions.
u = Air velocity (m/s).
w = Wire to plate space (m).
xg = Geometric mean particle size (m).
xm = Mean particle diameter (m).
ω = Migration velocity of particle (m/s).
δ = Relative gas density at 1 atm and 20 oC.
εo = Free space permittivity (8.85x10⁻¹² F/m).
η = Collection efficiency.
ηexp = Experimental efficiency
ηtheo= Efficiency calculated by Deutch model.
ηsemi= Efficiency calculated by semi-theoretical model.
ηover= Efficiency calculated by overall collection
model.
σg = Geometric standard deviation.
μ = Dynamic viscosity (1.85x10⁻⁵ kg/m.s)
ρp = Particle density (kg/m3).
λi = Ionic mean free path.
τ = Separation time of particle (s).
IJSER © 2013 http://www.ijser.org