International Journal of Scientific & Engineering Research, Volume 4, Issue 6, June-2013 626
ISSN 2229-5518
Comparative Study of Brain Tumour
Detection Using K means, Fuzzy C Means and Hierarchical Clustering Algorithms
Kshitij Bhagwat, Dhanshri More, Sayali Shinde, Akshay Daga, Assistant Prof Rupali Tornekar
Abstract— Image processing has become an area of boundless possibilities to explore as the advances in research field in this domain are gaining momentum. Brain tumour detection is a crucial task these days. This paper focuses on the comparative study of algorithms K means, Fuzzy C means and Hierarchical clustering on various parametric measures. Finally the tumour area is specified as confirmation step. A user friendly MATLAB GUI program has been constructed to test the proposed algorithm.
Index Terms— Brain tumour, K-means, Fuzzy C-means, Hierarchical..
—————————— ————————
Brain is the center of human Central nervous system. The
brain is a complex organ as it contains 50-100 billion
neurons forming a gigantic neural network. Detection of anatomical brain structures with their exact location is important for treatments like radiation therapy and surgery. Radiologists perform the diagnosis of brain tumour manually on MRI images but it being time consuming and error prone as large no of image slices and the large variations between them. DICOM (Digital Imaging and Communications in Medicine) plays a key role as it is the standard for handling, storing, reading, viewing and writing, printing information for medical Imaging. The techniques like MRI (Magnetic Resonance Imaging), NMRI (Nuclear Magnetic Resonance Imaging), MRT (Magnetic Resonance Tomography) and CT (Computed Tomography) Scan are being widely used to get the images for processing to detect the tumour, out of which MRI is widely used as it provides much greater contrast between the different soft tissues of the body compared to computed tomography (CT). Segmentation techniques like K means clustering, Fuzzy C means, Hierarchical, Watershed Algorithms, and Self Organizing Maps are widely implemented depending on which methodology is required as it can be Region growing, frequency domain based or thresholding based which classifies the MRI Images.
A tumour is an acronym for a neoplasm or a solid lesion
formed by an abnormal growth of cells (termed neoplastic) which looks like a swelling. Brain Tumours are composed of the cells that exhibit abnormal and unrestrained cell division. Brain tumour can be benign or malignant, benign being non-cancerous and malignant are cancerous. Malignant tumours are classified in to two types like
Primary and Secondary tumours. Benign tumour is less
harmful compared to malignant as in malignant tumour it spreads rapidly invading other tissues of brain, progressively worsening the condition causing death.
MRI images to detect brain tumour classifies the tumour depending on whether the brain is an abnormal tissue containing normal volume brain tissues like white matter, gray matter and CSF (cerebro-spinal fluid) but also have some slices contain pathology like edema and necrosis hence making them abnormal brain tissues. Based on the CSF Symmetry on the vertical axis through the brain center a normal volume brain tissue and an abnormal volume brain tissue could be classified. The MRI images can be of T1, T2 weighted type of which T2 weighted Images are being widely used in Medical Imaging as in this case of cerebral and spinal study, the CSF (cerebrospinal fluid) are lighter in T2 weighted images as they are acquired using fast echo spin sequence whereas the T1 weighted images are acquired using a spin echo sequence. Primary focus on exact brain tumours location and its extraction with parameters like area and time to yield faithful and error free output.
Segmentation is process of partitioning the image into
different parts having similar features. The pre-processing
stages needs to done on the image initially, followed by clustering algorithms and towards the fag end thresholding be done for the extraction of the tumour which is the region of interest (ROI) from the entire image. The features for thresholding being intensity based, area based Thresholding is the vital part of segmentation as the tumour must be isolated from the brain image.
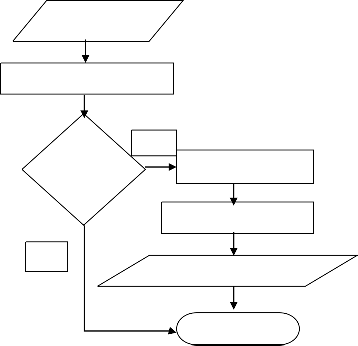
The below is a flowchart (sequence) of exactly how a tumour is detected in ours system.
IJSER © 2013 http://www.ijser.org
International Journal of Scientific & Engineering Research, Volume 4, Issue 6, June-2013 627
ISSN 2229-5518
YES If
Tumou r
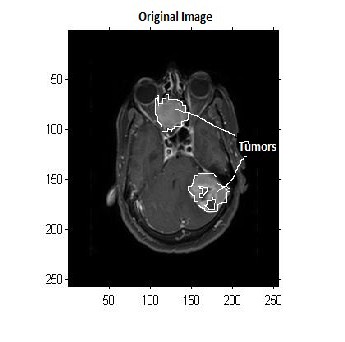
Tumour location detection algorithm is based on the fact that human brain is symmetric about vertical axis. In
the given system, this algorithm is applied before applying segmentation methods. If this algorithm gives location of tumour then only apply segmentation methods.
Step 1: Given image divided in four equal parts.
Step 2: As human brain is symmetric about vertical axis, upper two parts compared on basis of number of pixels present in each intensity level i.e. histogram matching.
Step 3: Step 2 repeated for lower two parts.
Step 4: if mismatch found in upper two parts’ histogram
comparison, symmetry disturbed in upper part hence
‘tumour present in upper part’
Else if mismatch found in lower two parts’ histogram comparison, ‘tumour present in lower part’
No
END
The MRI image consist labels on the MRI such as
patient name, age and marks and some other information
which could interfere with the tumour detection is not of interest when detecting a tumour. At this time Pre- Processing is of vital importance as the intensity value, greater than that of the threshold value is removed from MRI right from the first row and column of the image. The high intensity values of film artifact are removed from MRI brain image.
Else ‘tumour not present’ in given image.
Cluster analysis or clustering is the task of assigning a set of objects into groups (called clusters), so that the objects in the same cluster are more similar to each other than to those in other clusters. Clustering can be achieved by various algorithms that differ significantly in their notion of what constitutes a cluster and how to efficiently find them. A cluster is therefore a collection of objects which are “similar” between them and are “dissimilar” to the objects belonging to other clusters.
Now for clustering we need to have basis for clustering like criterion function which defines the cluster classification on a stand, keeping in mind that the criterion function should be optimized. Suppose that we have a set D of n samples x1,x2,...xn that we want to partition into exactly into ‘c’ disjoint subsets D1,..,Dc.Some of the Criterion functions for clustering are as the sum of squared error criterion, Related minimum variance criterion ,Scattering criterion.
K means is the clustering method which forms k clusters of n pixel objects, wherein each pixel object belongs to the cluster of the nearest mean, which results of portioning the data space in Voronoi cells. Given a set of observations (x1, x2, ..., xn ), where each observation is a d- dimensional real vector. K-means clustering aims to partition the n observations into k sets (k ≤ n) S = S1, S2,...,Sk so as to minimize the within-cluster sum of squares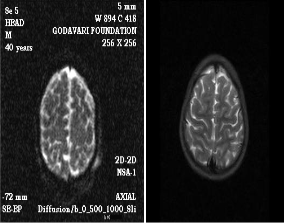
𝑎𝑎𝑎𝑠 min ∑𝑘 𝑛
‖𝑋𝑗
− 𝜇𝑖 ‖2
Where 𝜇𝑖 is the mean of points in 𝑆𝑖 . m=𝑥𝑗 𝜖 𝑆𝑖
It is a simple clustering method and gives fast
outputs as well, but the problem of choosing the correct
clustered image is a big issue in K means. However if we
are using a DWT (Discrete Wavelet Transform) along with
k means the we get the high level details of the tumour and
IJSER © 2013 http://www.ijser.org
International Journal of Scientific & Engineering Research, Volume 4, Issue 6, June-2013 628
ISSN 2229-5518
also frequency information and time space localization. When a wavelet transform is applied on the MRI image it yields wavelet decomposed image resulting in four sub bands, which are the LL (Lower resolution version of image), LH (Horizontal edge data), HL (Vertical edge data)
& HH (Diagonal edge data) sub bands representing approximation, horizontal, vertical and diagonal components in the form of coefficients, respectively. LL sub band contains low level and the other three (LH, HL and HH) contain high level details. DWT (Discrete wavelet Transform ) applies the approximation coefficients in LL equal to zero and apply inverse wavelet transform to obtain a high pass image from the remaining (horizontal, vertical and diagonal) sub bands and the resultant image obtained is the level-1 (L1) detail image. Thus DWT (Discrete wavelet Transform) gives a sharpened image which is added along with the original image and to the resulting outcome of the addition segmentation of k means clustering is performed, followed by thresholding techniques to extract the tumour. Thresholding can be based on many methodologies-which can be area based or intensity based.
Algorithm for K means Clustering:
Step 1: Choose K centroids at random from input MR
image.
Step 2: Make initial partition of objects into k clusters by
assigning objects to closest centroid
Step 3: Calculate the centroid (mean) of each of the k clusters.
a. For object i, calculate its distance to each of the centroids. b. Allocate object i to cluster with closest centroid.
c. If object was reallocated, recalculate centroid based on
new cluster.
Step 4: Repeat 3 for object i = 1,...., N
Step 5: Repeat 3 and 4 until no reallocations occur.
of X denoted by x. Thus, X={𝑥}.A Fuzzy set A in X
characterized by a membership function 𝜇𝐴 (𝑥)which
associates with each point in X a real number in the interval
[0,1], with value of 𝜇𝐴 (𝑥) at x representing the grade of membership of x in A. Thus, nearer the value of 𝜇𝐴 (𝑥)to
unity, the higher the grade of membership of x in A. In the
hard clustering process, each data sample is assigned to
only one cluster and all clusters are regarded as disjoint collection of the data set. In practice there are many cases, in which the clusters are not completely disjoint and the data could be classified as belonging to one cluster almost as well to another.
This algorithm works by assigning membership to each data point corresponding to each cluster centre on the basis of distance between the cluster centre and the data point. More the data is near to the cluster centre more is its membership towards the particular cluster centre. Clearly, summation of membership of each data point should be equal to one. After each iteration, the up-gradation of the membership and cluster centres is done.
Parameters:
n : is the number of data points.
𝑣𝑗 : represents thecluster centre.
m : is the fuzziness index m ∈[1, ∞].
c : represents the number of cluster centre.
𝜇𝑖𝑗 : represents the membership ofdata tocluster centre.
𝑑𝑖𝑗 : represents the Euclidean distance between 𝑖𝑡ℎ and𝑗𝑡ℎ
data and cluster centre.
Main objective of fuzzy c-means algorithm is to minimize:
J(U,V)=
𝑛 𝑐
𝑚
Step 6: Assess cluster structure for fit and stability:
Step 7: Separate Image into K sub images according to
clustered indexed Image
� ��𝜇𝑖𝑗 �
𝑖 =1 𝑗=1
‖𝑥𝑖 − 𝑣𝑗 ‖2
Step 8: Apply intensity and area based threshold to extract exact tumour part from image.
In the year 1973 Dunn developed the Fuzzy C Means algorithm and later in 1981 it was enhanced by Bezdek. However the Fuzzy logic was proposed in 1965 by Lofti A Zadak a professor of Computer Science at
University of California, Berkeley.
Where ‖𝑥𝑖 − 𝑣𝑗 ‖, is the Euclidean distance between 𝑖𝑡ℎ data and 𝑗𝑡ℎ cluster centre.
Algorithmic steps for Fuzzy c-means clustering:
Let X ={𝑥1, x2, x3 ..., 𝑥𝑥}be the set of data points and V =
{𝑣1, v2, v3 ..., 𝑣𝑣}be the set of centres.
Step 1: Randomly select c cluster centers.
Step 2: Calculate the fuzzy membership function 𝜇𝑖𝑗 using:
1
Fuzzy logic is a form of many-valued logic or probabilistic logic. It by definition only means approximate
𝜇𝑖𝑗 =
𝑐
𝑘=1
�𝑑𝑖𝑗
𝑑𝑖𝑘![]()
2
![]()
𝑚−1
�
values rather than fixed and exact. In contrast with
Step 3: Compute the fuzzy centers 𝑣𝑗 using:
traditional logic they can have varying values, where binary
sets have two-valued logic, true or false, fuzzy logic variables may have a truth value that ranges in degree between 0 and 1. Fuzzy logic has been extended to handle
𝑛
𝑚
𝑣𝑗 = ���𝜇𝑖𝑗 �
𝑖 =1
𝑛
𝑚
𝑥𝑖 � ÷ ���𝜇𝑖𝑗 � �,
𝑖 =1
the concept of partial truth, where the truth value may range between completely true and completely false.
∀𝑗 = 1,2, . . 𝑣.
Step 4: Repeat Step 2&3 until the minimum ’J’ value is
Let X be a space of points, with a generic element
achieved or ‖𝑈
𝑘+1
− 𝑈𝑘 ‖ <β where,
IJSER © 2013 http://www.ijser.org
International Journal of Scientific & Engineering Research, Volume 4, Issue 6, June-2013 629
ISSN 2229-5518
k: is the iteration step.
β : is the termination criterion between [0, 1].
During removal of film artifacts, the image consists of noise. The image is given to enhancement stage for the
U = �𝜇𝑖𝑗 �
𝑛+𝑐
is the fuzzy membership matrix.
removing high intensity component and the above noise.
J: is the objective function.
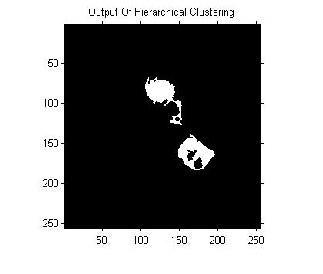
A Hierarchical clustering method works by grouping data objects into a tree of clusters. There are two types of clustering 1.Agglomerative 2.Divisive. Agglomerative clustering differs in the similarity measures which employ single link, complete link, group average, centroid similarity. Hierarchical clustering doesn’t require specifying the number of clusters. It is deterministic. In agglomerative clustering each element is treated as a singleton cluster and then merged (agglomerated) until all merge in a single cluster, which results in dendograms formation. Dendograms are horizontal lines which when cut at a point you get a specific part or element and explains how clustering helps forming an image.
The Algorithm for Agglomerative Hierarchical Clustering: Step 1: We first compute the N × N similarity matrix C.
Step 2: The algorithm then executes N − 1 steps of merging
the currently most similar clusters.
Step 3: In each iteration, the two most similar clusters are
merged and the rows and columns of the merged cluster i
in C are updated.
Step 4: The clustering is stored as a list of merges in A.
Step 5: I indicates which clusters are still available to be merged.
Step 6: The function SIM(i,m,j) computes the similarity of
cluster j with the merge of clusters i and m.
Step 7: For some HAC algorithms, SIM (i,m, j) is simply a
function of C[j][i] and C[j][m], for example, the maximum of these two values for single-link.
Divisive hierarchical is more efficient as we can stop when we reach our goal. Unlike agglomerative clustering we do not need to construct the entire hierarchy all the way down to individual leaves. Also along with efficiency even in accuracy point divisive is better than agglomerative hierarchical clustering.
Algorithm: Divisive Hierarchical Clustering
Step 1: The whole image is in one cluster.
Step 2: Find the most dissimilar point in the image and
divide the image into two clusters. Step 3: Repeat step2 for each cluster.
Step 4: A tree like structure is formed. Repeat step 2 until
level 4 is reached. Level 4 has 8 clusters.
Step 5: Continue until the tumour cluster is obtained.
This part is used to enhance the smoothness towards
piecewise homogeneous region and reduce the edge blurring effects, which tells the necessity of Enhancement after segmentation Techniques being applied. Noise is a problem with MRI images also needs to be removed, along with the quality of the image to be maintained. Hence Enhancement step is needed.
When the tumour is detected, because of intensity
based techniques are used, small matters in brain MRI like
soft tissues as well as big objects like eye remain in the image alongside the tumour. In our system, area based thresholding is used in post processing of tumour image to
The Clustering algorithms like K means, Fuzzy C
means and hierarchical clustering were applied on the database of 60 brain tumour images in non-medical format ( .jpg, .png, .bmp etc.) as well as Images in DICOM format yielding the following efficiencies on the basis of four parameters described below:
TP: True Positive: Tumour Present and detected
TN: True Negative: Tumour not present and not detected
FP: False Positive: Tumour not present and detected
FN: False Positive: Tumour present and not detected
Efficiency= (TN+TP)/(TP+TN+FP+FN)
Table 1: Efficiency in Non-medical format Images
Method | Efficiency |
K means | 70% |
Fuzzy C means | 70% |
Hierarchical Clustering | 66.66% |
Table 2: Efficiency in DICOM Images
The timing parameter for an image from the database is as
IJSER © 2013 http://www.ijser.org
International Journal of Scientific & Engineering Research, Volume 4, Issue 6, June-2013 630
ISSN 2229-5518
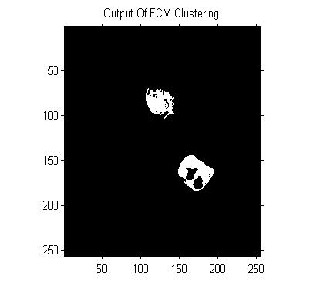
Table 3: Average Time required
Method | Time in sec |
K means | 0.8608 |
Fuzzy C means | 1.6363 |
Hierarchical Clustering | 0.4068 |
It clearly shows that the time required for Hierarchical is least and that for Fuzzy C means is maximum to detect the tumour. But tumour detection is much more prominent in FCM than other methods.
IJSER © 2013 http://www.ijser.org
International Journal of Scientific & Engineering Research, Volume 4, Issue 6, June-2013 631
ISSN 2229-5518
![]()
A new system that can be used as a second
decision for the surgeons and radiologists is proposed. In
this system brain tumours have been segmented with the help of three methods. The execution time for Hierarchical clustering was less compared to the other clustering
methods. Regarding the number of tumour pixels, K-means clustering and Fuzzy C means gave a better result than the other methods. The three clustering algorithms were tested with a database of MRI brain images. For non-medical format images (.jpg, .png, .bmp, etc.), K-means and Fuzzy C means clustering achieved about 70% result. Hierarchical clustering achieved about 66.66% and for DICOM images overall efficiency for all algorithms proved to be improved up to 86%.Tumour location detection algorithm increases overall efficiency of the system as it reduces FP(False Positive) output form segmentation algorithm. The texture can be taken as an additional parameter for tumour detection.
[1] T. Logeswari and M. Karnan “An Enhanced Implementation of
Brain Tumour Detection Using Segmentation Based on Soft Computing” in International Journal of Computer Theory and Engineering, Vol. 2, No. 4, August, 2010 1793-8201 586
[2]Shruti Dalmiya, Avijit Dasgupta, Soumya Kanti Datta, “Application of Wavelet based K-means Algorithm in Mammogram Segmentation” in International Journal of Computer Applications (0975 – 8887) Volume 52– No.15, August 2012.
3. Fuzzy Logic Introduction by Martin Hellmann, March 2001.
[4] Satya Chaitanya Sripada, Dr. M. Sreenivasa Rao “Comparison of purity and entropy of k means clustering and fuzzy c means Clustering.” in Indian Journal of Computer Science and Engineering.
[5] N. Rajalakshmi, V. Lakshmi Prabha “Brain Tumour Detection of MR Images Based on Color-Converted Hybrid PSO+K-Means Clustering Segmentation” in European Journal of Scientific Research. [6]P. Tamije Selvy, V. Palanisamy, T. Purusothaman “Performance Analysis of Clustering Algorithms in Brain Tumour Detection of MR Images” in European Journal of Scientific Research ISSN 1450-216X Vol.62 No.3 (2011), pp. 321-330 © Euro Journals Publishing, Inc. 2011. [7]Jinn-Yi Yeh a, J.C. Fu b “A hierarchical genetic algorithm for segmentation of multi-spectral human-brain MRI” in Expert Systems with Applications 34 (2008) 1285–1295.
[8] Chunlin Li, Dmitry B. Goldgof and Lawrence Hall “Knowledge- Based Classification and Tissue Labeling of MR Images of Human Brain” in IEEE TRANSACTIONS ON MEDICAL IMAGING, VOL. 12, NO.4, DECEMBER 1993.
[9]Laxman Singh, R.B.Dubey Z.A.Jaffery, Zaheeruddin “Segmentation and Characterization of Brain Tumour from MR Images” in 2009
International Conference on Advances in Recent Technologies in
Communication and Computing.
.

IJSER © 2013 http://www.ijser.org
International Journal of Scientific & Engineering Research, Volume 4, Issue 6, June-2013
ISSN 2229-5518
632
IJSER IS) 2013 http://www .l!ser.org