International Journal of Scientific & Engineering Research, Volume 5, Issue 2, February-2014 525
ISSN 2229-5518
Compairision of Satellite Imagies
Syed Arsalan, Shaikh Muhammad Nadeem
Abstract— This paper deals with the research in the compairision of satellite imagies. Our world is developing day by day, every thing in this world changing continuously. If we observe a specific area or region of our world, then we can easily find the change on that area. Karachi is the fast growing and developing, by image processing, we are observing the change in population, built up areas and vegetation. We find these changes in Karachi by imagies of lansat 7 satellite, we have the data of landsat 7 imageries of 1990 and 2000. We are comparing this data after image processing. For processing the image we have the ERDAS IMAGINE 9.1 software and we are using supervise classification technique basically. We can forecast future trends of the city expansion in terms of population, built up areas and vegetation.
Index Terms— Lansat 7 satellite imagies, ERDAS IMAGINE 9.1, Future space, Unsupervised classification.
—————————— ——————————
INTRODUCTION
HIS millennium will be the most urbanized millennium of the World. Today, almost 50% of the world's populations are urban. The urban population currently estimated is
about 3.4 billion people, is expected to double by 2020. Per- haps more significantly, it be predicted that 93% of this in- crease will be associated with the third world cities. If this is
the case, approximately two billion people will be added to
these already congested urban areas during the lifetime of just
a single generation. In this context, a recent report by the
World Bank about developing countries which is declaring urbanization as one of the most explosive problems of this century [1].
Urban growth and also developing areas are difficult to moni- tor, yet essential for the implementation of effective planning
strategies. This is even more difficult in developing countries, with limited monitoring resources. One way that urban growth manifests itself is in the spatial expansion of built-up areas. There are a number of different approaches to the prob- lem of identifying and measuring the extent of new develop- ments. Aerial photographs and ground surveys have tradi- tionally been used to obtain the information that is needed to update existing maps [2-4]. However, particularly in Pakistan and in developing countries in general, these data sets are of inconsistent quality, are often outdated and, in many cases, their availability cease to exist. When they do exist, the acqui- sition has been time consuming, bureaucratic and expensive. Remote sensing data products are helpful for detecting and monitoring urban area to study urban growth because
its repetitive coverage [5].
————————————————
• Syed Arsalan is currently pursuing M.phil/P.hD in space sciences from institute of space and planetary astrophysics, University of Karachi, Paki- stan, PH-923012900519. E-mail: syed5arsalan@yahoo.com
• Shaikh Muhammad nadeem is currently pursuing Ph.D in space sciences
from institute of space and planetary astrophysics, University of Karachi, Pakistan.
STUDY AREA
Karachi is the capital city of the province of Sindh and the largest city of Pakistan, one of the world’s largest cities in terms of population. The Karachi division occupies an area of
3527. Km2 and 9,856,318 persons population [6]. The average
annual growth rate of being 3.52 percent. The population den-
sity is 2794.53 persons per square kilometer, highest in Paki-
stan. In 2005 the total population of Karachi was about
15119,000 and in 2012 the total population of Karachi is
21,200,000 [7, 8]. The total urban population of the city jumped
from 1,068,459 in 1951 to 14,500,000 in 2007 which means that
since last fifty seven years Karachi urban population is contin-
ually on the increase. It is situated about 129 km due west of
present Indus mouths. The area extends between the latitude
24º-45’North and 25º-38’North and longitude 66º-40’ and
67ºEast -34’ East (Figure 1).
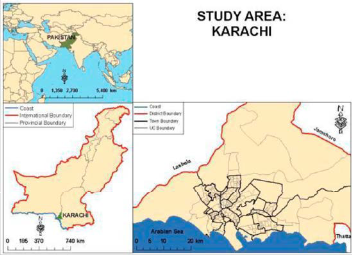
Figure 1
IJSER © 2014 http://www.ijser.org
International Journal of Scientific & Engineering Research, Volume 5, Issue 2, February-2014 526
ISSN 2229-5518
It is bounded on the northeast and southeast by districts of Jamshoro and Thatta respectively and in the south and south- west by the Arabian Sea and in the North West by the Lasbela district of Balochistan province. It is located on the northern coast of North Arabian Sea, which gives its climate the marine touch. Physiographically it is located within the Kohistan Subdivision of the western highland Division. Geometrically Manora conglomerates have provided it a location of the shel- tered harbor to serve the fertile hinterland and its most favor- able geographical situation as a center of three great conti- nents, Europe, Africa and Asia [1, 9].
SATELLITE IMAGIES
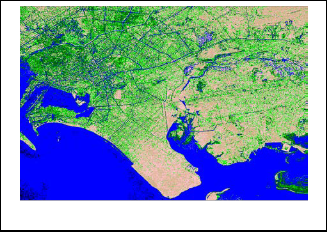
In Karachi imagies, we notice that the areas are showing Fig- ure 2 (a) and (b) are changing during 1990 and 2000. Figure 2 (a) and (b) is showing the raw imagies of the landsat 7.
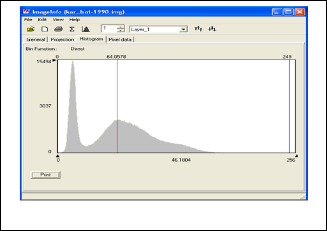
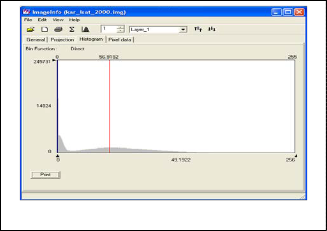
Figure 3(a) “Histogram of image of 1990”

Figure 3(b). “Histogram of image of 2000”
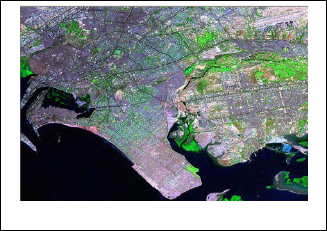
Figure 2(a) “Karachi imagery of 1990”
Figure 2(b) “Karachi imagery of 2000”
HISTOGRAMES
The histogram is showing the more information of the landsat
7 imagies of different areas of the Karachi. Figure 3 (a) and (b)
is showing the histograms of the raw imagies of the landsat 7.
IMAGE PROCESSING TECHNIQUE
Classification is the process of sorting individual image into similar categories or clusters. There are a number of steps in the classification starting from the raw data image (1990 and
2000) and ending into classes such as a map of surface cover types (i.e. water, open lands, mangroves, residential area, malir estuary, sedimentation pattern etc). The goal there the capability of the data that we have to work with, the level of our map depends on need, and the amount of work we are willing to put forth.
To become familiar with the structure of our Karachi data set. We have looked at the basic statistic that makes up the individual bands of our imagery including the combina- tion of two bands through indices to analyze our imagery in multispectral mode (2 or more bands at a time).
FEATURE SPACES
Now we explore further, the multispectral nature of our im- agery by mapping out the feature space. A feature space plot allows you to determine the spectral location of surface feature within our image. In some ways this is similar to the signature plots that we made earlier. However, it differs in that we ex- amine the association between two bands in a scatter plot and
IJSER © 2014 http://www.ijser.org
International Journal of Scientific & Engineering Research, Volume 5, Issue 2, February-2014 527
ISSN 2229-5518
locate within that scatter plot, the spectral location of various features (agric, trees, water etc). Examine the feature spaces importance because it allows us to make quantitative compari- sons between cover types on the ground. This process is the exploratory phase of classification.
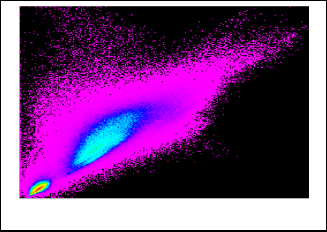
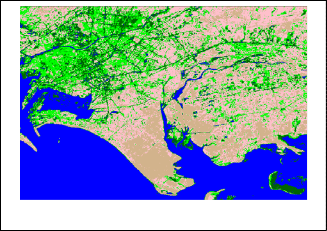
Figure 5(b) “unsupervised classification of image of 2000”
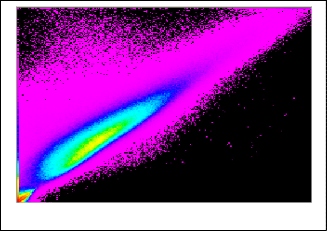
Figure 4(a) “future space of image of 1990”
CONCLUSION
From the above image processing techniques, we can easily ob- serve by comparing in the imagies of the land set 7 1990 and 2000 that the population and vegetations are increasing, similarly this area is also developing clearly.
ACKNOWLEDGMENT
Alhamdulillah, we have completed our work with the blessing and help of Dear Allah. We would like to thanks our parents, family members and all friends specialy Muhammad aqeel khan noori.
RESULTS
Figure 4(b) “future space of image of 2000”
REFERENCES
[1] Afsar S. Application of Remote Sensing for Urban Growth
Monitoring and Landcover/ Land Use Mapping for Change
Detection in Karachi, Unpublished M. Phil Thesis, Department of
Geography, University of Karachi: Karachi 2001
[2] DeBruijn CA. Monitoring A Large Squatter Area in Dar Es
Salaam With Sequential Aerial Photograph. ITC J 1987; 3:
233-38.
[3] Kuepfer G, Turkstra J, Hofstee P. Spatial Growth of Unplanned Areas in Nairobi: Use of Aerial Photography for Monitoring Urban Growth and Improvement planning. ITC J
1987; 3: 239-47.
[4] Hack BN. The Effects of the Crop Calendar on Urban
mapping with SPOT Imagery. Asian Pacific Remote Sensing
J 1992; 2: 101-107
[5] Chouhan TS, Joshi. Reading in Remote Sensing Application, New Pali Road, Jodhpur, India 1992
[6] Government of Pakistan, Census Report of Karachi 1998,
Population Census Organization: Statistical Division, Islamabad 2001
[7] Baille AF. Kurrachee Past, Present and Future, Calcutta,
Reprint Oxford University Press, Karachi 1975.
[8] City District Government of Karachi (CDGK). The Karachi
City Retrieved 2010-08-22
[9] Pithawalla M, B. D. Sc, F.G.S. An Introduction to Karachi, Its
Environs and Hinterland. The Times Press 1949
Figure 5(a) “unsupervised classification of image of 1990”
IJSER © 2014 http://www.ijser.org


