International Journal of Scientific & Engineering Research, Volume 5, Issue 4, April-2014 1214
ISSN 2229-5518
Coastal aquifer vulnerability evaluation of Bonny
Island, Niger Delta, Nigeria
*Osadebe, C.C., *Fakeye, A.M., & **Akinluyi, F.O.
*Nigerian Building and Road Research Institute, P.M.B. 1055, Otta, Ogun state, Nigeria
**Federal University of Technology, Akure, Ondo State, Nigeria
Abstract— The objective of the study is to evaluate the hydraulic characteristics of the aquifer confining layer (aquitard) in Bonny Island in view of the possibility of surface pollution due its large reserve of crude oil and natural gas and companies with industrial plants. The investigation involved boring of six boreholes to a depth of 30metres using dismountable percussion rig. The field data were obtained from six hours pumping test conducted on the boreholes at a constant discharge rate of 32.5m3/hr. (780m3/day). The De Glee method for steady state drawdown in an aquifer with leakage from a confining layer (aquitard) was adopted for the analysis of data and determination of hydraulic characteristics of the aquifer and confining layer. The permeability values of the confining layer vary between 9.55x 10⁻⁴ m/day and 1.33 x 10⁻² m/day with an average value of 5.61 x 10⁻³ m/day while the permeability values for the aquifer vary between 4.83 x10⁻² m/day and 103 m/day. The transmissivity values of the confining layers vary between 9.55 x 10⁻⁴ m2/day and 2.13 x 10⁻¹m2/day with an average value of 5.39 x 10⁻² m2/day and between 8.21 x 10⁻¹m2/day and 4.22m2/day for the aquiferous zone. The values for the aquiferous zone are high, suggestive of a highly transmissible aquifer in the area. However, the average transmissivity value of the confining layer in borehole No3 is relatively high, indicating the possibility of occurrence of leakage especially when there is influence of gravitational and capillary forces on the moisture movement of the underlying soil through the pore spaces. The leakage factor values vary between 1.00m and 15.0m for confining layer. The hydraulic resistance values for confining layers vary between 9.39 x 10² day and 3.32 x 10³day. Although, the permeability and transmissivity of the confining layers are low, the capacity of the layer to transmit water through leakage is sufficiently high especially within the location of borehole No3.
Key words: aquifer, borehole, vulnerability, aquitard, permeability, transmissivity, hydraulic resistance, confining layer
—————————— ——————————
serious threat to the preservation of groundwater quality
(Amangabara and Ejenna, 2012). Hence, boreholes can be con-
The rapid growth of population, urbanization, industrializa- tion and increasing awareness of the need for adequate water supply by Government, communities, public and private insti- tutions have contributed to the enormous demand for potable water supply in the country. Urban pressure due to the recla- mation of part of Bonny Island and infrastructural develop- ment has caused many industries and individuals to move to the area. For sustainable water supply, emphasis has been placed on the exploitation of the groundwater resources rather than the traditional dependence on surface water either from rainfall or from streams. The results of various researchers (Yisa et al, 2012; Ordinioha, 2011; Ibiyemi, 2001; Adah and Abok, 2013; Ochuko and Origho, 2013; Olasumbo, 2001; Kola- Olusanya, 2003) have revealed that water resources (surface and groundwater) in many parts of the country, especially the southern parts, are more than adequate to meet any demand and only need development and proper management.
However, Bonny Island is within the coast of Atlantic Ocean with no rivers or stream as surface water. Thus, groundwater is the only safe source of water supply for drinking and for all daily needs. However, in spite of these efforts, most part of the Niger Delta, including Bonny Island suffers from groundwater pollution due to its large reserve of crude oil and natural gas and companies with industrial plants. Water seeping near in- dustrial plants can become heavily contaminated with indus- trial solvents or chemical residues related to manufacturing or processing activities. Percolation of these contaminants poses a
taminated biologically and chemically by substances entering
the boreholes fron the surface. The protection of water quality
of the boreholes therefore depends on the engineering and
hydraulic characteristics of the aquifer confining layer.
The objective of the study therefore is to evaluate the engineer- ing and hydraulic characteristics of the aquifer confining layer (aquitard) in view of the possibility of surface pollution. The study therefore assumes great significance in the context of the confining layer protecting the under-groundwater against sur- face pollution.
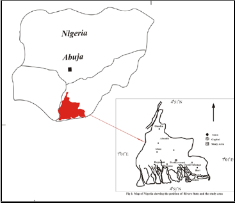
Bonny Island is located within latitudes 40 20 N and 40 35 N and longitudes 70 5 E and 70 20 E (Fig. 1). It has a tropical cli- mate with two distinct seasons, wet (April-October) and dry (November-March). The mean annual rainfall exceeds
3500mm. About 85% of the mean annual rainfall occurs in the wet season, thereby causing widespread occurrence of floods. In the area, the water levels rise to the ground surface and in- undate the area.
The intricate network of rivers and their discharge patterns result in the formation of several morphological units: Dry flat land and plain; Sombreiro warri deltaic plain; freshwater backswamps; saltwater or mangrove swamp and ac- tive/abandoned coastal beaches (Fig. 2). Bonny Island lies within the active/abandoned coastal beaches.
IJSER © 2014 http://www.ijser.org
International Journal of Scientific & Engineering Research, Volume 5, Issue 4, April-2014 1215
ISSN 2229-5518
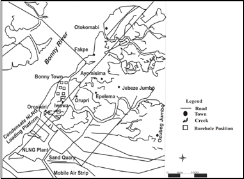
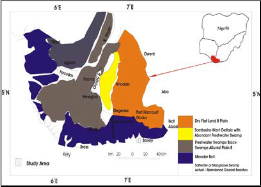
Fig. 2: Location of study area within the geomorphic units of the Niger Delta
(Modified after Akpokodje, 1987).
The geology of Niger Delta has been discussed by various au- thors (Short and Stauble, 1967; Murat, 1970; Merki, 1970, etc). The Niger Delta was formed during the last depositional cycle of the Southern Nigerian basin which commenced in the Paleocene. The general geology of the area consists of Quater- nary deposits overlying the Tertiary sandy and clayey deltaic deposits. The Niger Delta has three main subsurface lithostrat- igraphic units namely, Benin, Agbada and Akata Formations (Short and Stauble, 1967).
Six boreholes (BH) (Fig. 3) were drilled with dismanteable percussion rig. The pumping test was conducted on the bore- holes to determine the potential for groundwater resources of the study area. The pumping test was conducted at a constant discharge rate of 32.5m3/hr (780m3/day) and the pumping wa- ter levels were measured using dip-meter at the test well and boreholes at a distance of 8m,12m, 20m, 25m, 30m and 38m respectively. Initially, the readings in the production well and observation wells were at every one minute for the first 10 minutes followed by every 2 minutes for the next 10 minutes. Thereafter, readings were taken at every 5 minutes, 10 minutes and 30 minutes. Uninterrupted readings were achieved for 10 hours of pumping. At the termination of pumping test, meas- urement of well recovery or recharging commenced immedi- ately.
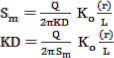
De Glee’s method (1951) for a steady state drawdown in an aquifer with leakage from an aquitard (confining layer) pro- portional to the hydraulic gradient across the aquitard was adopted for the determination of the hydraulic characteristics of the aquitard and aquifer. The field data was derived from the six hours pumping test conducted on the boreholes using a constant discharge method. De Glee derived the following formula:
……………………………… (1)
…………………………….... (2)
where Sm = steady state drawdown (m) in a borehole at a dis- tance (r) in m from the pumped borehole![]()
Q = discharge of the borehole in m3/d
………………………… (3)
……………………………… (4)
where
C = hydraulic resistance in day
D’ = thickness of aquitard (confining layer)
K’ = hydraulic conductivity of the aquitard for vertical flow
(m/day)
![]() = modified Bessel function of the second kind and ze- ro order (Hankel function)
= modified Bessel function of the second kind and ze- ro order (Hankel function)
A De Glee type curve was prepared by plotting values of![]() versus values
versus values ![]() values on a log-log paper. The field data of the drawdown in each borehole was plotted against the corresponding values of r on log-log paper of the same scale with the type curve (Fig. 4). The plots of drawdown ver- sus the corresponding distances (r) was fitted with the De Glee’s type curve and an arbitrary point A on the overlapping portion of the sheets (a point where
values on a log-log paper. The field data of the drawdown in each borehole was plotted against the corresponding values of r on log-log paper of the same scale with the type curve (Fig. 4). The plots of drawdown ver- sus the corresponding distances (r) was fitted with the De Glee’s type curve and an arbitrary point A on the overlapping portion of the sheets (a point where ![]() = 1 and
= 1 and ![]() = 1) was selected (Fig.5).
= 1) was selected (Fig.5).
IJSER © 2014 http://www.ijser.org
International Journal of Scientific & Engineering Research, Volume 5, Issue 4, April-2014 1216
ISSN 2229-5518
![]()
The transmissivity (KD) was calculated by substituting the known value of Q and the values of and ![]() on point A in equations (1) and (2). The hydraulic resistance, c was cal- culated by substituting the value of KD and the values of r and r/L into equation 3, expressed as:
on point A in equations (1) and (2). The hydraulic resistance, c was cal- culated by substituting the value of KD and the values of r and r/L into equation 3, expressed as: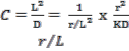
……………. (5)
where = Hankel function
r = distance between the borehole and the pumped
well.
The leakage coefficient was determined from the relationship below: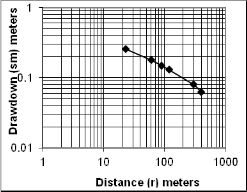
Leakage Coefficient = ![]() ……… (6)
……… (6)
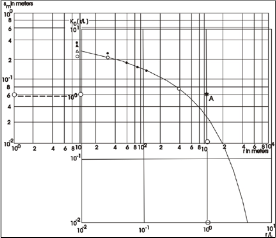
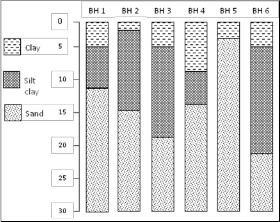
Fig. 6 shows a litho-stratigraphical section of the boreholes as derived from the drilling data. In broad terms, each of these boreholes could be rationalized as underlain by at least three primary soil zones. The primary soil zones include an organic clayey layer of about 0-5m thickness, which is soft and grayish brown in color. The dark gray coloration is mostly ascribed to its rich organic content. Beneath the clay is a layer of soft gray- ish silty clay with variable thickness of about 7-11m, which may extend to the depth of 20m. Underlying the silty clay is a relatively clean, medium to coarse-grained, uniformly-graded sand deposit (aquiferous zone) of about 10-26m thick, which is the water bearing formation. In the clay sandy soils, the infil- tration rate is likely to increase because of the sandy nature of the soil. Generally, active clays have high water holding ca- pacity and are also characterized by low permeability and low resistance to shear.
When the borehole fully penetrates the aquifer and is screened over a total thickness as shown in Figure 6, the piezometric surface of the aquifer coincides with the water-table (Kruse- man and de Ridder, 1991). When the borehole is pumped, the hydraulic head in the aquifer will drop, thereby creating a hydraulic gradient not only in the aquifer itself, but also in the confining layer. The flow induced by the pumping is assumed to be vertical in the aquitard and horizontal in the aquifer (Neuman and Witherspoon, 1969). The water that the pumped aquifer contributes to the borehole discharge comes from stor- age within the aquifer.
The water that the pumped aquifer contributes to the borehole discharge comes from storage within the aquifer. The water contributed by the aquitard comes from storage within the aquitard and leakage through it. After a certain time, the borehole discharge comes into equilibrium with the leakage through the aquitard (confining layer) and a steady-state flow
IJSER © 2014 http://www.ijser.org
International Journal of Scientific & Engineering Research, Volume 5, Issue 4, April-2014 1217
ISSN 2229-5518
is attained. In this condition, the aquitard serves merely as a water-transmitting medium.
The summary of the hydraulic characteristics and the average values of the results are presented in Tables 1 and 2. The per- meability values of the confining layer vary between 9.55x 10⁻⁴ m/day and 1.33 x 10⁻² m/day with an average value of 5.61 x
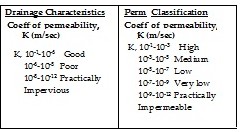
10-3 m/day while the permeability values for the aquifer vary between 4.83 x10⁻² m/day and 103 m/day. When the result is compared with the ELE International classification (Table 3), the confining layer has poor drainage characteristics and low
.
to very low permeability while the aquifer has good drainage characteristics and medium to high permeability. The low permeability values of the confining layer could be attributed to the clayey nature of the soil. The average permeability val- ues of the confining layer in BH 1, 2, 4, and 5 are relatively lower than that of BH 3. This variation in the permeability values of BH 3 indicate that the confining layer in the borehole is ineffective in controlling surface pollutions. In this case, sur- face pollutant could move into the aquifer through the sur- rounding boreholes.

Note: USCS = Unified Soil Classification System
The transmissivity values of the confining layers vary between
9.55 x 10⁻⁴ m2/day and 2.13 x 10⁻¹m2/day with an average value
of 5.39 x 10⁻² and between 8.21 x 10⁻¹m2/day and 4.22m2/day for the aquiferous zone. The values for the aquiferous zone are high, suggestive of a highly transmissible aquifer in the area. However, the average transmissivity value of the confining layer in BH 3 is relatively high, indicating the possibility of occurrence of leakage especially when there is influence of gravitational and capillary forces on the moisture movement of the underlying soil through the pore spaces. In this case, the hydraulic conductivity depends on the moisture content and the soil fabric.
The leakage factor which is the measure for spatial distribu- tion of leakage through an aquitard into the aquifer and vice versa (Kruseman and de Ridder, 1991) vary between 1.00m and 15.0m (Table 1) for confining layer and between 3.0m and
26.0m for the aquifer. The result of the leakage factor (Table 2)
shows that the average values of the confining layer for BH 4 and 6 are high. This high leakage factor indicates that the rate of leakage from the confining layer into the aquifer is low for BH 4 and 6. Similarly, the leakage factors for BH 1, 2, 3 and 5 are low which suggest that the leakage into the aquifer is high.
IJSER © 2014 http://www.ijser.org
International Journal of Scientific & Engineering Research, Volume 5, Issue 4, April-2014 1218
ISSN 2229-5518
Table 2: Average values of the hydraulic characteristics of the aquifer confining layer (clay and silty clay) in the study area
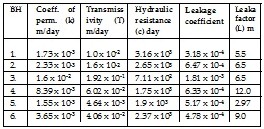
Table 3: Drainage characteristics and permeability classification based on ELE International (2005)
The leakage coefficient which is defined as the measure of the amount of leakage through the confining layer ranges between
9.55 x 10⁻⁴ and 1.065 x 10⁻³ for the confining layer. The hydrau-
lic resistance which characterizes the resistance of the aquitard
(confining layer) to vertical flow into the aquifer (Kruseman and de Ridder, 1991) varies between 9.39 x 10² day and 3.32 x
103day, for confining layer and between 8.8 x 10⁻¹ day and 3.51 x 10² day for the aquiferous zone. The average value of hy- draulic resistance of the confining layer in BH 3 is relatively lower than BH 1, 2, 4, 5 and 6. This indicates that the confining layer of BH 3 has a high rate of leakage into the aquifer. The permeability and hydraulic resistance values suggest that after rainfall, the voids of the confining layers are likely to be filled with water which would affect the cyclic recharge of other adjoining aquifer. In all the boreholes, the organic clay has an expected low permeability values, varying between 9.55 x 10⁻⁴ m/day and 1.34 x 10⁻³ m/day and also low transmissivity val- ues varying between 9.55 x 10⁻⁴ m/day and 1.02m2/day. How- ever, the leakage factors of the organic clay are also low vary- ing between 1.0m and 4.0m. Although, the organic clay has low permeability and transmissivity values, the low values of the leakage factor indicate that the rate of leakage through the clay is high in all the boreholes. The hydraulic resistance of the organic clay (Table 1) in BH 2, 3 and 6 are relatively low. The values suggest that the organic clay has the least resistance to vertical flow in these boreholes. Similarly, the leakage factor of the organic clay in BH 2, 3 and 6 are also low, suggesting high rate of leakage into the underlying stratum. However, the un- derlying silty clays in BH 2 and 6 have relatively high hydrau- lic resistance (4.37 x 10³ days and 3.17 x 10³ days respectively) and leakage factor (11.0m and 15.0m respectively). The under-
lying silty clay in these locations would not allow the move- ment of pollutants into the aquifer.
In BH 3, the organic clay is underlain by silty sand which is water bearing formation. Consequently, the location of BH 3 is vulnerable to pollution. Moreover, the average values of the hydraulic characteristics as shown in Table 2 also reveals the low hydraulic resistance value (7.11 x 10² days) and low to moderate leakage factor (6.5m) of the confining layer of the BH 3, which indicate least resistance to vertical flow and high rate of leakage of the confining layer in BH 3 location.
The hydraulic characteristics of the confining layer and the aquifer are related to flow of water into the aquifer. The re- sults of the investigation have revealed that the general drain- age of the area is controlled by the nature of the aquifer con- fining layer which comprises of upper clayey and silty clay soil. Although, the permeability and transmissivity of the con- fining layers are low, the capacity of the layer to transmit wa- ter through leakage is sufficiently high especially within the location of BH 3. The analyses and evaluation of the field data show that the hydraulic resistance and leakage factor of organ- ic clay in BH 2, 3 and 6 are low. This indicates that the organic clay in these locations have high rate of leakage into the un- derlying stratum.
However, the underlying silty clays in these locations except BH 3 have high resistance to vertical flow of water and low rate of leakage into the aquifer. Consequently, proper atten- tion should be given to Bonny Island in the management of industrial effluent and oil spillage in view of the hydraulic characteristics of the confining layer of the aquifer. The inves- tigation reveals that the area is vulnerable to pollution espe- cially in BH 3 location.
111-121
2011. Journal of water esources and Environment, vol. 2 (2), pp. 20-29
Site Investigation BS 5930, London.
IJSER © 2014 http://www.ijser.org
International Journal of Scientific & Engineering Research, Volume 5, Issue 4, April-2014 1219
ISSN 2229-5518
38-80 Moorman’s periodieke pers, The Hague.
Equipment, 11th edition, Leighton, Buzzards, U.K. 188p.
Kruseman, G.P. and de Ridder, N.A., 1991. Analysis and evaluation of pumping test data. 2nd edition. International In- stitute for Land Reclamation and Improvement, The Nether- lands, 377p
.
Olasumbo, Martin. 2001. Water resources management and development in Nigeria -Issues and Challenges in a new Mil- lenium. An inaugural lecture delivered at the University of Agriculture
13-18
IJSER © 2014 http://www.ijser.org