*Dr. K.T.Arulmozhi is an assistant professor in Physics Wing (DDE), Annamalai University, India. Email: arulsheelphy@gmail.com
International Journal of Scientific & Engineering Research, Volume 5, Issue 1, January-2014 412
ISSN 2229-5518
Abstract: The α and β phase lead oxide (PbO) nanoparticles were synthesized by the simple chemical precipitation technique. The samples were characterized using X-ray diffraction (XRD), UV-visible (UV-vis) and photoluminescence (PL) spectroscopy. XRD analysis confirmed the tetragonal structure for the α- PbO and orthorhombic form for the β-PbO nanocrystallites with an average crystallite size of 36 and 47 nm, respectively. From the UV-Vis spectra the direct band gap energies were estimated as 3.91 eV for α- PbO and 3.85 eV for β-PbO. The PL studies revealed the blue and green emissions due to excitonic recombination and synthesis originated defects. No peaks appeared corresponding to near band edge emission. The density of defects in α-PbO was lower than that of β-PbO.
IJS---------- *-E----------- R
N.Mythili is currently pursuing Ph.D degree in Annamalai University, India.
Email: mythuwinmile@yahoo.co.in
*Dr. K.T.Arulmozhi is an assistant professor in Physics Wing (DDE), Annamalai University, India. Email: arulsheelphy@gmail.com![]()
Lead (II) oxide (PbO) nanoparticles have wide range of potential applications due to long cycle life. They are preferentially utilized in nanodevices [1], as functional materials in sensors [2,3], electrodes in batteries [4,5], efficient and reusable catalyst [6]. PbO has two polymorphs, the α-PbO and β-PbO. Both are photoactive semiconductors with band gaps 2.2 and 2.5 eV, respectively [7]. At atmospheric pressure α-PbO undergoes a phase transition to β-PbO at 489°C [8–10] and the pure α- phase can be obtained only in the temperature range of ~240 to ~260°C [7]. However, it is interesting to point out that Perry and Wilkinson [11] have reported at an elevated temperature (~90°C), the synthesis of
α-PbO by using quartz glassware. Li et al. [12] have prepared the α and β phase PbO nanoparticles by microwave irradiation technique. Torabi et al. [13] have synthesized β-PbO nanoparticles using hydrothermal method. Borhade et al. [14] have reported the synthesis of β-PbO by hydrothermal method and the end product was calcined at 500°C. Among the various methods available for the synthesis of nanoparticles, the chemical precipitation method is advantageous due to its inexpensive salt precursors, simple and rapid processing at ambient conditions and its use in mass production [15]. In the present work, the chemical precipitation process is used to synthesize the α and β phase PbO nanoparticles.
IJSER © 2014 http://www.ijser.org
International Journal of Scientific & Engineering Research, Volume 5, Issue 1, January-2014 412
ISSN 2229-5518
2.1. Experimental:
All the chemicals used in this study were of AR grade with 99% purity obtained from SD fine chemicals and double distilled water was used as solvent. Lead (II) acetate trihydrate [Pb(CH3 COO)2 ⋅3H2 O] (0.5 M) and sodium hydroxide [NaOH] (9.5 M) were dissolved separately in 50 mL of water. While magnetically stirring the lead solution, the NaOH solution was added drop-wise to get pH ≈
9 and the reaction temperature was maintained at
80°C. After two hours of stirring the solution initially becomes cloudy and finally turned into deep red color. Then stirring was stopped and the precipitate was dried in oven at 100°C for 2 h. Lastly the end product was divided into two parts and one part was calcined
at 240°C (2 h) to obtain the α-PbO and the other part
low density and this fact may be due to atmospheric conditions in which the sample is calcined at 700°C.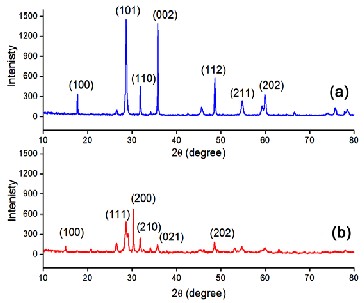
IJSER
calcined at 700°C (2 h) to get the β-PbO
nanoparticles.
2.2. Instrumentation:
The XRD patterns of the powder samples were recorded using X’PERT PRO diffractometer with Cu- Kα radiation (λ = 1.5406 Å). The UV-vis absorption spectra of all samples in dimethyl sulfoxide (DMSO) were recorded using LAMBDA 25 PERKIN ELMER spectrometer. Using PERKIN ELMER LS 55 fluorescence spectrometer the PL emission spectra were recorded.
3.1. XRD Analysis:
3.1.1. Structural Studies:
The XRD patterns of the two samples are shown in Fig. 1. Intense and well defined peaks are indicative of good crystallinity. The diffraction pattern of the α-
nanoparticles
3.1.2. Crystallite Size:
The average crystallite size (D) was calculated using the Scherrer formula [16],![]()
D = 0.9λ βcosθ
where λ is the wavelength of Cu Kα line (= 1.5406
Å), β is the full width at half maximum (FWHM) in radians and θ is the Bragg’s diffraction angle.
3.1.3. Specific Surface Area (SSA):
SSA is a property of solids, which is the ratio of the total surface area per unit mass [17]. It is a derived scientific value that can be used to determine the type and reactive properties of a material. It has significance on the process like adsorption, heterogeneous catalysis and reactions on surfaces. SSA can be calculated using the relation
SA
PbO matches well with the JCPDS card number 05-
0561 confirming its tetragonal structure. The pattern
SSA =
part
![]()
Vpart × density
for the β-PbO matches with the JCPDS card number
88-1589 confirming its orthorhombic structure. However, the XRD peaks of β-PbO are of relatively
where SApart is the surface area of the particle, Vpart is the particle volume and density is the theoretical density of PbO.
IJSER © 2014 http://www.ijser.org
International Journal of Scientific & Engineering Research, Volume 5, Issue 1, January-2014 413
ISSN 2229-5518
3.1.4. Lattice Parameters:
The lattice parameters are calculated using the relation
vis band gap energy spectra of the PbO nanoparticles are shown in Fig. 3.
1 h2 k 2
l 2
![]()
![]()
![]()
![]()
= + +
d 2 a2 b2 c2
where d is the interplanar spacing; a, b, c are the lattice parameters and h, k, l are the Miller indices. For the tetragonal structure a=b≠c and for the orthorhombic structure a≠b≠c. The XRD derived parameters for the synthesized PbO nanoparticles are provided in Table 1.
Table 1: Average crystallite size (D), specific surface area (SSA) and the lattice parameters (a, b, c) of α-PbO and β-PbO nanoparticles
(b) β-PbO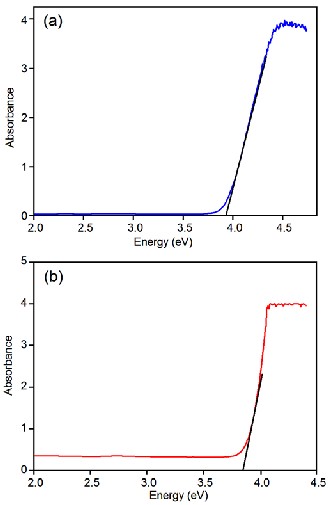
nanoparticles
*Standard values
It can be seen from Table 1 that α-PbO nanocrystallites have smaller size (36 nm) and higher value of SSA and the β-PbO nanocrystallites have relatively bigger size (45 nm) with decreased value of SSA. The lattice parameters calculated from XRD data in both cases, agree well with the respective standard values given in the JCPDS cards. The bigger size of β-PbO nanocrystallites may be correlated to the higher value of unit cell volume, which is true in this present cases but need not show such similar trend in variations in all situations [18-21].
3.2. UV-Visible Spectroscopy:
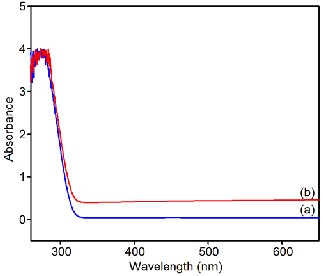
The UV-visible spectra of the prepared samples are shown in Fig. 2. The wavelength of absorption maximum depends on the particle size which decreases with decreasing particle size. It can be seen from figure that absorption peak of β-PbO is 290 nm which is blue shifted to 283 nm for α-PbO. The UV-
IJSER © 2014 http://www.ijser.org
International Journal of Scientific & Engineering Research, Volume 5, Issue 1, January-2014 414
ISSN 2229-5518
and (b) β-PbO nanoparticles
The energy of the band gap was calculated using
Tauc relation [22] (αhν) = A (hν–Eg)n
where A is the absorption coefficient, hν is the photon energy and E g is the energy of the band gap. For direct band gap n = 1/2. The calculated values of
band gap energy for α-PbO is 3.91 eV and that for
β-PbO is 3.85 eV. These values are much higher than the band gap energy of bulk PbO which in fact clearly indicates that the synthesized products are in nanoscale. Further, relatively higher value of energy of smaller size α-PbO agrees well with the concept that band gap increases with decreasing particle size.
3.3. PL Emission Spectroscopy:
The luminescence property of the lead oxide
Since the nanoparticles are synthesized in an aqueous solutions a high density of oxygen vacancies might be expected. The oxygen vacancy itself may be neutral, singly ionized or doubly ionized [23]. These oxygen vacancies and interstitial atomic defects form a number of trap states which are responsible for the
4)
various PL peaks in the visible region [24].
The PL emission spectra of the α-PbO and β-PbO nanoparticles are shown in Fig. 5. It can be seen from figure that there is blue emission peak around 440 nm, which can be attributed to the recombination of electrons in the conduction band with deep doubly ionized oxygen vacancies. This can be also attributed to the excitonic recombination. There is no evidence of near band edge UV emissions, and this feature has been observed by Gnanam and Rejendran [25]. The band appearing at 480 nm relates to surface defects while the green emission band appearing in the 510 and 530 nm regions can be attributed to the transition from conduction band to singly ionized oxygen
IJSER
nanocrystallites finds its application in the field of
opto-electronics. The specific emission wavelengths exhibited in the spectrum reveals the structural properties and associated defect levels. The emission peaks helps to analyze the presence of defects, their density and location. The generalized band gap structure and specific defect level emissions, not confined to a particular compound, are illustrated in Fig. 4.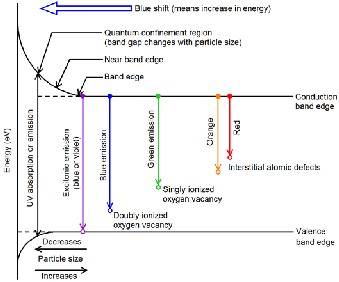
vacancies. No orange or red bands corresponding
transitions related to interstitial defects are observed in our study. Further, comparing the two spectra, it is clearly evident that the defect level intensities are significantly lower for α-PbO, implying lower density of defects.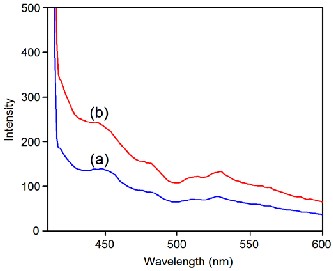
IJSER © 2014 http://www.ijser.org
International Journal of Scientific & Engineering Research, Volume 5, Issue 1, January-2014 415
ISSN 2229-5518
The α and β phase PbO nanoparticles were synthesized using simple, rapid and cost effective chemical precipitation method. The XRD analysis indicated highly crystalline nature of the nanoparticles and confirmed the tetragonal structure for α-PbO and orthorhombic structure for the β-PbO nanoparticles. The calculated particle size of α-PbO (36 nm) was smaller than that of β-PbO (45 nm). The energies of band gap evaluated from the UV-vis spectra were
3.91 and 3.85 eV for the α and β phases, respectively. From the PL studies it can be concluded that synthesis originated defect levels are present in both sample as exhibited by the blue and green emission peaks. The
α-PbO has lower density of defect levels when compared to that of β-PbO.
The author (N.M) wishes to thank the financial support of INSPIRE fellowship funded by Department of Science and Technology (DST), New Delhi, India.
nanostructured lead dioxide, Ultrason. Sonochem., 15 (2008), 448–455.
[7] K. Hai, D. Tang and X.G. Wang, Effect of an oxidizing environment on the phase structure of lead oxide nanowires, AIP Adv., 3 (2013),
0221201–0221205.
[8] M. Salavati-Niasari, F. Mohandes and F. Davar, Preparation of PbO nanocrystals via decomposition of lead oxalate, Polyhedron, 28 (2009), 2263–2267.
[9] S. Radhakrishnan, M.N. Kamalasanan and P.C.
Mehendru, Sensitization of photoconductivity in tetragonal lead monoxide, J. Mater. Sci., 18 (1983) 1912–1916.
[10] M. Baleva and V. Tuncheva, Laser-assisted deposition of PbO films, J. Mater. Sci. Lett., 13 (1994), 3–5.
[11] D.L. Perry and T.J. Wilkinson, Synthesis of high- purity α- and β-PbO and possible applications to synthesis and processing of other lead oxide
materials, Appl. Phys. A, 89 (2007), 77–80.
[12] S. Li, W. Yang, M. Chen, J. Gao, J. Kang and Y.
Qi, Preparation of PbO nanoparticles by
[1] H. Karami, M.A. Karami and S. Haghdar, Synthesis of uniform nanostructured lead oxide by sonochemical method and its application as cathode and anode of lead-acid batteries, Mater. Res. Bull., 43 (2008), 3054–3065.
[2] G. Xi, Y. Peng, L. Xu, M. Zhang, W. Yu and Y.
Qian, Selected control synthesis of PbO2 submicrometer-sized hollow spheres and Pb3 O4 microtubes, Inorg. Chem. Commun., 7 (2004), 607–610.
[3] M. Sharon and P. Veluchamy, Composition and photoactivity of lead oxide film prepared on a Pb electrode in the Pb/PbO potential region in 0.1 M NaOH + 0.1 M Na2 SO4 at 80°C, J. Electroanal. Chem., 365 (1994), 179–183.
[4] C. Barriga, S. Maffi, L.P. Bicelli, C. Malitesta, Electrochemical lithiation of Pb3 O 4 , J. Power Sources, 34 (1991), 353–367.
[5] W.U. Huynh, J.J. Dittmer and A.P. Alivisatos, Hybrid nanorod-polymer solar cells, Science, 295 (2002), 2425–2427.
[6] S. Ghasemi, M.F. Mousavi, M. Shamsipur and H.
Karami, Sonochemical-assisted synthesis of
microwave irradiation and their application to Pb(II) selective electrode based on cellulose acetate, Mater. Chem. Phys., 90 (2005) 262–269.
[13] M. Torabi and S.H. Razavi, Electrochemical evaluation of PbO nanoparticles as anode for lithium ion batteries, IJE Transact. B, 24 (2011),
351–355.
[14] A.B. Borhade, D.R. Tope and B.K. Uphade, An efficient photocatalytic degradation of methyl blue dye by using synthesized PbO nanoparticles, E-J. Chem., 9 (2012), 705–715.
[15] T. Dhannia, S. Jayalekshmi, M.C.S. Kumar, T.P.
Rao and A.C. Bose, Effect of aluminium doping and annealing on structural and optical properties of cerium oxide nanocrystals, J. Phys. Chem. Solids, 70 (2009), 1443–1447.
[16] A. Eshaghi, M. Pakshir and R. Mozaffarinia, Preparation and characterization of TiO2 sol-gel modified nanocomposite films, J. Sol-Gel Sci. Technol., 55 (2010), 278–284.
[17] M.N. Rifaya, T. Theivasanthi and M. Alagar, Chemical capping synthesis of nickel oxide nanoparticles and their characterizations studies, Nanosci. Nanotechnol., 2 (2012), 134–138.
IJSER © 2014 http://www.ijser.org
International Journal of Scientific & Engineering Research, Volume 5, Issue 1, January-2014 416
ISSN 2229-5518
[18] V.N. Morris, R.A. Farrell, A.M. Sexton and M.A. Morris, Lattice constant dependence on particle size for ceria prepared from a citrate sol- gel, J. Phys.: Conf. Ser., 26 (2006), 119–122.
[19] A. Sundaresan, R. Bhargavi, N. Rangarajan, U.
Siddesh and C.N.R. Rao, Ferromagnetism as a universal feature of nanoparticles of the otherwise nonmagnetic oxides, Phys. Rev. B, 74 (2006), 161306(R).
[20] S. Kumar, Y.J. Kim, B.H. Koo and C.G. Lee, Structural and magnetic properties of Ni doped CeO2 nanoparticles, J. Nanosci. Nanotechnol.,
10 (2010), 7204–7207.
[21] V.R. Huse, V.D. Mote and B.N. Dole, The crystallographic and optical studies on cobalt doped CdS nanoparticles, World J. Condens. Matter Phys., 3 (2013), 46–49.
[22] B.S. Rema Devi, R. Raveendran and A.V.
Vaidyan, Synthesis and characterization of Mn2+- doped ZnS nanoparticles, Pramana-J. Phys., 68 (2007), 679–687.
[23] Y. Gong, T. Andelman, G.F. Neumark, S.
O’Brien and I.L. Kuskovsky, Origin of defect- related green emission from ZnO nanoparticles: effect of surface modification, Nanoscale Res. Lett., 2 (2007), 297–302.
[24] P.P. Sahay, R.K. Mishra, S.N. Pandey, S. Jha and M. Shamsuddin, Structural, dielectric and photoluminescence properties of co- precipitated Zn-doped SnO2 nanoparticles, Curr. Appl. Phys., 13 (2013), 479–486.
[25] S. Gnanam and V. Rajendran, Optical properties of capping agents mediated lead oxide nanoparticles via facile hydrothermal process, Int. J. Nanomater. Biostruct., 1 (2011), 12–16.
IJSER © 2014 http://www.ijser.org