International Journal of Scientific & Engineering Research, Volume 4, Issue 8, August 2013 1577
ISSN 2229-5518
Change Detection in SAR Images using
Contourlet
Merin Ayshu Ali, DR. B. M. Imran
Abstract— This paper presents an unsupervised approach based on contourlet image fusion and fuzzy clustering for change detection in sar images.In this novel approach image fusion is used to produce difference image from log ratio and mean ratio images.For an optimal difference image, it should retain the unchanged areas and enhance the changed areas.so contourlet based fusion is proposed to generate the difference image. To process the difference image is to discriminate changed regions from unchanged regions using fuzzy local information c means algorithum which is insensitive to noise.Experimental result shows that this approach provides better performance than its preexistences.
Index Terms— contourlet, image fusion, fuzzy clustering, synthetic aperture radar images, change detection
1 INTRODUCTION
—————————— ——————————
HANGE detection is a technique that identifying chang- es by analysing images obtained from the same geo- graphical area at different times[1]. The changes detecting
in the regions of same area at different periods is of great in- terest. This process have many applications in different fields
.The main applications include medical diagonosis [2]-[3], re- mote sensing [4]-[5] [6], video surveillance [7]-[8]. One of the major data sources for remote sensing applications is synthetic aperture radar images [9]. The importance of SAR images in variety applications is because SAR sensors is adaptable to all weather conditions.The main disadvantage is presence of mul- tiplicative speckle noise. Change detection may be done by supervised or in unsupervised manner.In supervised technique, a set of training patterns are required.it is little dif- ficult.But in the case of unsupervised manner, there is no need of training data.so unsupervised technique is better than un- supervised techniques. [4].
In this literature, three main steps are adopted to perform
unsupervised change detection,1) Preprocessing of image, 2)
Comparison of image and 3)Image analysis for change detec-
tion. The main purpose of step 1 include reduction of
noise,geometric and radiometric corrections and coregistra-
tion.In the second step that is after preprocessing,two sar im-
ages are taken as input and compared pixel by pixel to pro-
duce difference image.For producing difference image, ratio
operator and subtraction operator are most popular tech-
niques.In the case of rationing technique ,two preprocessed
images are taken as input and applying pixel by pixel ratio
operator to it,thereby changes are obtained.In the case of dif- ferencing technique , pixel by pixel subtraction is done be- tween the 2 preprocessed images.Generally in sar images in-
————————————————
• Merin Ayshu Ali is currently pursuing master’s degree program in Applied
Electronics in MG University, India. E-mail: ayshuali1.2@gmail.com
• Dr. B. Mohammed Imran is currently Professor & HOD of ECE in ICET, India. E-mail: professor.imran@gmail.com
stead of differencing operator ,ratio operator is typically used.Because differencing operator is affected by caliberation errors[10].
After performing above steps change detection is done on the difference image.For this, purpose context sensitive or con- text insensitive methods[11] are adopted.They are of many kinds.Among them ,histogram thresholding is one method.In that method the threshold value may be detected by automatic techniques or manual trial and error mthods .There are many thresholding techniques to determine the threshold like expectation maximization algorithum[12],otsu, Kittler and Illingworth minimum-error thresholding algorithm (K&I). An optimal synthetic aperture radar image change detection is achieved by the accuracy of the classification method and quality of the difference image.In order to achieve these two qualities,we propose this change detection method.The main two steps are: 1) By fusing a mean-ratio image and a log-ratio image, difference image is produced and 2) to identify the change areas in the difference image, by using fuzzy clus- tering technique.This paper is composed of four sec- tions.Section 2 involves proposed approach and our motivation will be enhanced.section 3 defines the proposed method.In section 4 includes experimental results and conclusion.
2 MOTIVATION
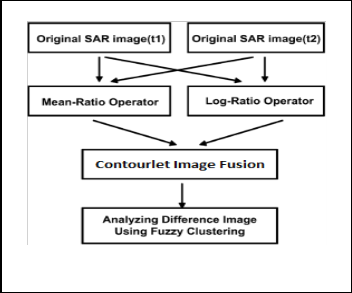
Consider two mulititemporal sar images x1 and x2 as input that is taken from same geographical area at different times.The main aim is to produce difference image that con- sists of change information, then image analysis for change detection.According to the fig. 1 , the proposed change detec- tion method involves mainly two steps 1) generate the differ- ence image using contourlet fusion and 2) to identify the changed areas in fused image by fuzzy clustering.
Because of the multiplicative nature of noise, the ratio images are represented in a logarithmic [13] or a mean scale [14]. These two methods have good results for the change de- tection in SAR images. But it have some disadvantages.In the case of logratio image, it is not able to reflect the information
IJSER © 2013 http://www.ijser.org
International Journal of Scientific & Engineering Research, Volume 4, Issue 8, August 2013 1578
ISSN 2229-5518
ods requires accurate estimation of threshold values.if the es- timation is not correct,we cannot correctly detect the changed and unchanged regions.So in this literature,fuzzy c means clustering algorithum is proposed to analyse the difference image.it is an unsupervised technique.
Fig.1. Block diagram of proposed change detection method
of changed regions completely. For the rmd technique, the unchanged regions of mean-ratio image are quite rough, and clarity of the image is less. For producing optimal difference image, it should restrain the unchanged areas information and should improve the information of changed regions. To solve this problem, an image fusion technique is introduced to gen- erate the difference image.According to the literature[15],we can conclude that generating the difference image by fusing log ratio image and mean ratio image contain better infor- mation than individual difference image. Among the fusion methods pixel level image fusion is widely used [16]. Discrete wavelet transform is mostly used for pixel level image fu- sion.it is a multiscale transform technique..But it have lack of shift invariance property and directional selectivity.One of the important property that require for change detection is shift invariance property.The image fusion based on dwt does not preserve the fine edges and curves.And also clarity of the im- age is less.so we introduce image fusion by contourlet fu- sion.The detailed description of this method will be presented in section 3. The main purpose to analyse the difference image is to determine the changed regions and unchanged re- gions.Expectation maximization and K&I algorithums are mainly used to identify the changed regions.These algo- rithums are carried out by applying a thresholding procedure to the histogram of the image.In addition to that, these meth-
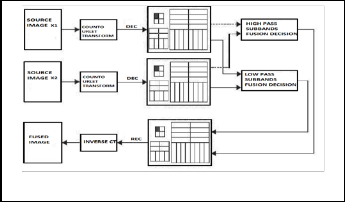
Fig. 2. Process of image fusion based on the contourlet
3 PROPOSED METHODOLOGY
In this section we describe the proposed change detection method,which consists of two steps; 1) Generate the difference image using contourlet fusion, and 2) Detecting changed regions using fuzzy c means clustering.
3.1 Generate the difference image based on contourlet fusion
Image fusion is a process of fusing two or more images into a single fused image, thereby relevant information in images are combined. So this single fused image will be more informative than any of the input imges [17]. The majority of fusion tech- niques are based on wavelet transformation. But, the DWT im- age fusion is resulting with shift variant and additive noise in fused image.it does not preserve edges of the image.so infor- mation loss is more.Thereby clarity of the fused image is re- duced.These issues can be resolved using contourlet trans- form.The main properties of contourlet Transform [17] is, mul- tiresolution, localization, directionality anisotropy and local brightness, etc. it also provide smoothness in a fused difference image .This technique is realized by double iterated filter bank.it uses laplacian pyramid and directional filter bank. There are mainly two steps for implementation of this transform.That is transformation and decomposition.
The two source images used for fusion are obtained from the
mean-ratio operator and the log-ratio operator, respectively,
which are given by [18].
 (1)
(1)
 (2)
(2)
Where X1 and X2 are multitemporal SAR images & m1 and m2 represent local mean values of multitemporal SAR images. Fig 2 shown above represent the block diagram of the con- tourlet based image fusion. Here image X1 and X2 denotes the input source images respectively. F is the final fused image.The image fusion scheme based on contourlet transform can be described as follows.Mainly there are two stages, transfor- mation stage and decomposition stage [17].
A) Transformation method
In the transformation stage, for the decomposition of subbands double filter bank is used .it is composed of laplacian pyramid and directional filter bank.so it is also called pyramidal direc- tional filter bank. For capturing the edge point, Laplacian pyr- amid filter is used. Directional Filter Bank is used to link the point discontinuities in the image [19].
IJSER © 2013 http://www.ijser.org
International Journal of Scientific & Engineering Research, Volume 4, Issue 8, August 2013 1579
ISSN 2229-5518
Fig. 3. Block diagram of construction of Laplacian pyramid
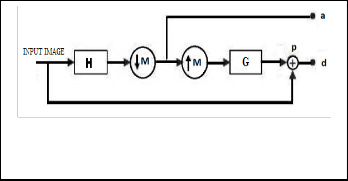
In this method each input image undergone subband de- composition. That is in low frequency and bandpass highfre- quency subbands [19]. In the case of low frequency subband, the same process is repeated upto specified contourlet decom- position level. Above block diagram fig. 3 shows the laplacian pyramid decomposition.Here the input image is fed to a low pass analysis filter (H) and then down sampled to lowpass Sub- band. Then this image is up sampled and applied to a synthesis filter (G). Finally subtracting the output of the synthesis filter and input image we get highpass subbands [17]. The laplacian pyramid also allows high frequency bandpass image s into fur- ther decomposition.That is this bandpass images are passed through the directional filterbank. It captures directional infor- mation accurately.So in this tranfomation stage, it decomposes the image into directional subbands at multiscale.
B. Decomposition Method
In this stage, decomposed subbands of transformation stage are fused by fusion rules.There are separate fusion rules for low- pass and highpass band. The coefficients in the lowpass sub- band a represents the profile features of the source image. For this measurement local area energy contourlet domain is used. Then the selection and averaging modes are used to compute the final coefficients [19].
The local energy E(x,y) is calculated by [17]
3.2 Analysis of fused image using fuzzy clustering Clustering means partioning a data set into a reasonable number of disjoint groups where each group containing simi-
lar samples[20].In this partitions ,patterns are similar within
the clusters and different between the clusters.In fuzzy clus-
tering the samples are assigned not only to one cluster In
fuzzy clustering the samples are assigned not only to one clus- ter,but belongs to different clusters.That is samples with cer- tain degree of belonging to all clusters.Among the fuzzy clus- tering methods, the FCM algorithm [21] is one of the most popular methods since it can retain more information from the original image and has robust characteristics for ambigu- itys.Here clustering is done to discriminate changed regions from unchanged regions. For improving the performance of image clustering, we use improved version of fuzzy clustering technique.That is fuzzy local information c means clustering algorithum. Here we introduce, a novel fuzzy factor into the object function of FLICM.The peculiarity of fuzzy local infor- mation c means algorithum is the main use of local similarity measure,which is aimed at ensuring the image detail preserva- tion and noise insensitiveness.This fuzzy factor is [18],
 (5)
(5)
Where dij is the spatial Euclidean distance between pixels i and j. i th pixel represents the center of the local window and jth pixel is the neighboring pixels falling into the window around the ith pixel.vk represents the prototype of the center of cluster, and ukj represents the fuzzy membership membership of the gray value j with respect to the kth cluster. Some of the properties of new fuzzy factor includes: Preserving image details without setting an artificial parameter, incorporate local gray and spatial level information in order to preserve robustness and noise insensitiveness. The objective function of the FLICM is described as follows [18] [22]
E(x,y)= ∑m
∑n a j ( x + m, y + n)
WL (m, n)

(3)
Where (x,y) denotes the current contourlet coefficient, WL(m,n) is a template of size 3*3 [17]. High frequency subbands which represent the salient features of the source image such as curves and lines.Average method is used for fusing the highfequency subbands. It is defined as follows; [18].
(6)
E F j ,k ( x, y) = d A j ,k ( x, y) + d B j ,k ( x, y)

(4)
Where
E F j ,k ( x, y)
is the local energy,
d X j ,k ( x, y)
is the

high frequency coefficent.Finally fused image is obtained from inverse contourlet decomposition method. The proposed method can provide fused image with better visual quality. And also the resultant fused image can preserve much infor- mation of edges and textures of SAR image.In the next section we describe novel fuzzy clustering algorithum for change de- tection in contourlet fused image.
(8)
IJSER © 2013 http://www.ijser.org
International Journal of Scientific & Engineering Research, Volume 4, Issue 8, August 2013 1580
ISSN 2229-5518
FLICM algorithum [18] [22] is described as follows:
Step1) Initialize the number of the cluster prototypes, fuzzifica-
tion parameter m and the stopping condition ɛ.
Step 2) Initialize randomly the fuzzy partition matrix.
Step 3) Then set the loop counter b=0.
Step 4) Compute the cluster prototypes.
Step 5) Also Calculate the fuzzy partition matrix.
Step 6) max {U (b) - U (b+ 1)} < ɛ then stop; otherwise, set
b=b+1, and go to step 4.
4 EXPERIMENTAL STUDY
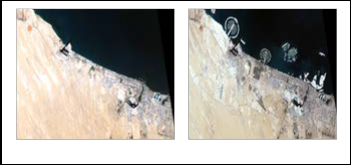
By presenting numerical results on five data sets we will show the performance of the proposed method. That is by this quantative analysis we will prove the effectiveness of proposed change detection method.Here only images of two dataset is shown. In this analysis ,the first data set contain a ection of two SAR images of Dubai obtained in the years of 2000 and
2010 respectively shown in Fig. 4(a) and 4(b). The available ground truth (reference image) is shown in Fig. 4(d). The Fig.
4(c) Shows the proposed contourlet fused image. The second data set is a section of two SAR images over the area of Istanbul. That is multitemporal images relating to Istanbul used in the experiments. In fig 5(a) Image acquired in 1975 and 5 (b) Image acquired in 2011. In fig 5(c) fused image is shown. The available ground truth is shown in Fig. 5(d). The experiments have been carried out for obtaining better fused image. That is here ana- lyzing the effectiveness of the contourlet fusion strategy to gen- erate the difference image. And, we compared the change detec- tion performance of our algorithm with other two methods, including the DWT and the mean ratio operation. We presented a comparative analysis for the suitability of the proposed ap- proach for the fused difference image. .For quantative analysis of change detection, we calculate the Percentage Correct Classi- fication [23] which is given by [18].
TABLE 1
CHANGE DETECTION RESULTS BASED ON DWT FUSION
dwt by Istanbul and dubai.And the proposed fusion method resulted in highest PCC value than other methods.
TABLE 2
CHANGE DETECTION RESULTS BASED ON CONTOURLET FUSION
Contourlet Fusion |
Image Set | Image Fusion Results (PCC) |
Dubai | 94.05 |
istanbul | 89.83 |
Tehran | 82.07 |
washington | 83.71 |
lasevegas | 63.96 |
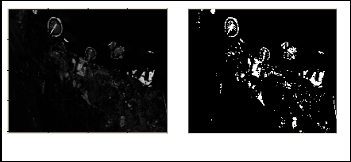
Fig. 4a. Duabi in 2000 Fig. 4b. Dubai in 2010
Fig. 4c. Fused Image Fig.4d Change detected Image
DWT Fusion |
Image Set | Image Fusion Results (PCC) |
Dubai | 91.56 |
istanbul | 87.87 |
tehran | 80.46 |
washington | 82.07 |
lasevegas | 63.68 |
PCC= (TP+ TN)/ (TP+ FP+ TN+ FN)
Here, TP is the number of pixels that are detected as the changed area .TN is the number of pixels that are detected as the unchanged area. The false negatives (FN) are the changed pixels that an undetected.False positive (FP) is the unchanged pixels wrongly classified as changed. In this experiment, we analyzed the effectiveness of contourlet image fusion technique to generate the difference image. As shown in Table I, the change detection results of the fused difference image were compared with the ones generate from mean-ratio operator and
IJSER © 2013 http://www.ijser.org
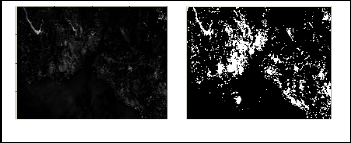
Fig. 5a. Istanbul in 1975 Fig. 5b. Istanbul in 2011
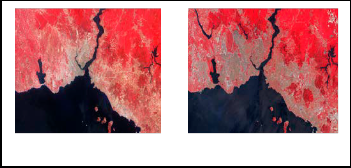
Fig 5c Fused image Fig 5d Change detected image
International Journal of Scientific & Engineering Research, Volume 4, Issue 8, August 2013 1581
ISSN 2229-5518
5 CONCLUSION
In this paper, we have presented an unsupervised approach based on contourlet fusion and fuzzy clustering for change detection in sar images.In order to restrain the unchanged are- as and enhance the changed areas, fusion approach is used.Among the fusion methods, the limitations of wavelet transforms is capturing the geometry of image edges. so in this paper, we pursue contourlet transform that can capture the intrinsic geometrical structure that is key in visual infor- mation. .We will show that, this method can provide fused image with better visual quality. In addition to that difference image produced in this method is better than that of dwt fused difference image. The obtained fusion image can preserve much information of edges and textures of SAR images. The experiment results also show that the proposed contourlet fusion strategy can integrate the advantages of the log ratio operator and the mean-ratio operator and gain a better per- formance. The change detection results obtained by the FLICM are better than the pre-existence.
REFERENCE
[1] R. J. Radke, S. Andra, O. Al-Kofahi, and B. Roysam, “Image change detection algorithms: A systematic survey,” IEEE Trans. Image Process., vol. 14, no. 3, pp. 294–307, Mar. 2005.
[2] M. Bosc, F. Heitz, J. P. Armspach, I. Namer, D. Gounot, and L. Rumbach, “Automatic change detection in multimodal serial MRI: Application to multi- ple sclerosis lesion evolution,” Neuroimage, vol. 20, no. 2, pp. 643–656, Oct.
2003.
[3] D. Rey, G. Subsol, H. Delingette, and N. Ayache, “Automatic detection and segmentation of evolving processes in 3-D medical images: Application to multiple sclerosis,” Med. Image Anal., vol. 6, no. 2, pp. 163–179, Jun. 2002.
[4] Y. Bazi, L. Bruzzone, and F. Melgani, “An unsupervised approach based on the generalizedGaussianmodel to automatic change detection in multitem- poral SAR images,” IEEE Trans. Geosci. Remote Sens., vol. 43, no. 4, pp. 874–
887, Apr. 2005.
[5] F. Bovolo and L. Bruzzone, “A detail-preserving scale-driven approach to change detection in multitemporal SAR images,” IEEE Trans. Geosci. Remote Sens., vol. 43, no. 12, pp. 2963–2972, Dec. 2005.
[6] A. A. Nielsen, “The regularized iteratively reweighted MAD method for change detection in multi- and hyperspectral data,” IEEE Trans. Image Pro- cess., vol. 16, no. 2, pp. 463–478, Feb. 2007.
[7] D. M. Tsai and S. C. Lai, “Independent component analysis-based back- ground subtraction for indoor surveillance,” IEEE Trans. Image Process., vol.
18, no. 1, pp. 158–167, Jan. 2009.
[8] S. S. Ho and H. Wechsler, “A martingale framework for detecting changes in data streams by testing exchangeability,” IEEE Trans. Pattern Anal. Mach. In- tell., vol. 32, no. 12, pp. 2113–2127, Dec.2010.
[9] F. Chatelain, J.-Y. Tourneret, and J. Inglada, “Change detection in multisensor SAR images using bivariate Gamma distributions,” IEEE Trans. Image Process. vol. 17, no. 3, pp. 249–258, Mar. 2008.
[10] A. Singh, “Digital change detection techniques using remotely sensed data,” Int. J. Remote Sens., vol. 10, no. 6, pp. 989–1003, 1989.
[11] S. Marchesi, F. Bovolo, and L. Bruzzone, “A context-sensitive technique ro- bust to registration noise for change detection in VHR multispectral images,” IEEE Trans. Image Process., vol. 19, no. 7, pp. 1877–1889, Jul. 2010.
[12] M. Sezgin and B. Sankur, “A survey over image thresholding techniques and
quantitative performance evaluation,” J. Electron. Imag, vol. 13, no. 1, pp. 146–
165, Jan. 2004.
[13] F. Bujor, E. Trouvé, L. Valet, J. M. Nicolas, and J. P. Rudant, “Application of log-cumulants to the detection of spatiotemporal discontinuities in multitem- poral SAR images,” IEEE Trans. Geosci. Remote Sens., vol. 42, no. 10, pp.
2073–2084, Oct. 2004.
[14] J. Inglada and G. Mercier, “A new statistical similarity measure for change detection in multitemporal SAR images and its extension to multiscale change analysis,” IEEE Trans. Geosci. Remote Sens., vol. 45, no. 5, pp. 1432–1445, May
2007.
[15] E. J. M. Rignot and J. J. Van Zyl, “Change detection techniques for ERS-1 SAR
data,” IEEE Trans. Geosci. Remote Sens., vol. 31, no. 4, pp. 896–906, Jul. 1993. [16] S. S. Ho and H. Wechsler, “A martingale framework for detecting changes in
data streams by testing exchangeability,” IEEE Trans. Pattern Anal. Mach. In-
tell., vol. 32, no. 12, pp. 2113–2127, Dec. 2010.
[17] S Rajkumar, S Kavitha, “Redundancy Discrete Wavelet Transform and Con- tourlet Transform for Multimodality Medical Image Fusion with Quantitative Analysis”, Third International Conference on Emerging Trends in Engineer- ing and Technology, pp. 134-139.
[18] Maoguo Gong, Zhiqiang Zhou, “Change Detection in Synthetic Aperture Radar Images based on Image Fusion and Fuzzy Clustering,” IEEE Trans. Image Process, vol. 21, no. 4, pp. 2141–2151, Apr. 2012.
[19] L.Yang, B.L.Guo, W.Ni, “ Multimodality Medical Image Fusion Based on Multiscale Geometric Analysis of Contourlet Transform”, Elsevier Science Publishers, vol. 72, pp. 203-211, December 2008.
[20] M. Ahmed, S. Yamany, N. Mohamed, A. Farag, and T. Moriarty, “A modified
fuzzy C-means algorithm for bias field estimation and segmentation of MRI
data,” IEEE Trans. Med. Imag., vol. 21, no. 3, pp. 193–199, Mar. 2002.
[21] J. C. Bezdek, Pattern Recognition with Fuzzy Objective Function. New York: Plenum, 1981.
[22] W. Cai, S. Chen, and D. Zhang, “Fast and robust fuzzy C-means clustering
algorithms incorporating local information for image segmentation,” Pattern
Recognit., vol. 40, no. 3, pp. 825–838, Mar. 2007.
[23] P. L. Rosin and E. Ioannidis, “Evaluation of global image thresholding for change detection,” Pattern Recognit. Lett., vol. 24, no. 14, pp.2345–2356, Oct.
2003.
IJSER © 2013 http://www.ijser.org


