International Journal of Scientific & Engineering Research, Volume 4, Issue 11, November-2013 636
ISSN 2229-5518
Building Data Warehouse for Diseases
Registry: First step for Clinical Data
Warehouse.
Alaa Khalaf Hamoud, Dr Talib A.S. Obaid.
Abstract-Almost all the Decision Makers in medical path need a good platform which providing analytical results to use themin order to support their decisions.Due to vast amount of patient's records in Electronic Health Record(EHR) rather than Electronic Medical Records(EMR),Medical data can be used to get valuable information to support decisions of specialists in clinical path.Clinicaldata warehouse can combine different sources of clinicaldata into single repository and use it to produce analytical information to support decisions. Since Online Analytical Processing (OLAP) can be used in analyzing data and find the relationship between many factors and provide good view of data from many points of view so using data warehousing and OLAP techniques is the good choice for helping professionals and analysts in finding their goals.W e will use diseases registry data (Part from EMR) to design and implement data warehouse as the first step that could be used later by OLAP or Data Mining to support Clinical Decisions. In this work we combined different sources of diseases registry dataintosingle repository.
Keywords: Clinical Data Warehouse, Diseases Registry, ETL, OLAP.
—————————— ——————————
1 Introduction
Data in a common model populate the database and maintain data warehouses. The creating of data warehouse process consists of five stages: pre-development activities, architecture selection, creation schemes, and population warehouse and data storage services. Each of these steps depends on the preceding step [5]. Data W arehousing Technology is involved with almost every system which needs analytical information to deepen the understanding of the interrelationships between data.
Since disease registry is full of valuable information which benefits Clinicians and professionals to support their decisions. Our research focus on building and manipulating Disease Registry W arehouse in Basra province of IRAQ. Since disease registry is full of valuable information to keep motoring for any abnormal cases that occurred beside the beneficial of the clinicians and professionals to support their decision that have to be taken.
------------------------------------------------------------------------
-Alaa Khalaf Hamoud, master student in computer science department, college of science, University of Basrah, Iraq.
E-mail: alaak7alaf@yahoo.com
-Talib A. S. Obaid, Ass. Prof. in computer science department, College of science, University of Basrah, Iraq.
E-mail:tasobaid@gmail.com
Diseases registry warehouse is the first step for building Clinical Decision Support System (CDSS) which can help the Clinicians in supporting their decisions. Through Clinical Data W arehouse (CDW ) we can combine different sources of Patients Records into one schema. In this work we shown how we could we build clinical data warehouse based on diseases registry data. There are two different sources of patient's records which will be combined into single repository.
Star schema will be depend as a structure schema for our CDW . Along with the simplicity of star schema, it can be understood by the users rather than the designers and it can be flexible for a future changes so the designer can add another dimension. Star schema can affect the efficiency of the system due to few joins between fact and dimensions which reduce the scans to retrieve the information.
2. Related Works
In this section we will present some of related works to our project.In [6] Palaniappan and Chua Sook Ling presented a prototype clinical decision support system which combines the strengths of both OLAP and data
IJSER © 2013 http://www.ijser.org
International Journal of Scientific & Engineering Research, Volume 4, Issue 11, November-2013 637
ISSN 2229-5518
mining. It provides a richknowledge environment which is not achievableby using OLAP or data mining alone.
Bagdi and Patil [2] presented a decision support system that combined the strengths of both OLAP and data mining. The system predicted the future state and generate useful information for effective decision- making.
Qwaider [16] showed how the integrated approach, OLAP with data warehousing, provides advanced decision support compared to using OLAP or data warehousing alone. He listed many Questions which cannot be answered by Data W arehouse alone or OLAP alone and showed that combination of both OLAP and Data W arehouse can answer the complex questions.
Htistovki, et al.[13],they described the possibilities of using data warehousing and OLAP technologies in public health care in general and then their own experience with these technologies gained during the implementation of a data warehouse of outpatient data at the national level. Such a data warehouse serves as a basis for advanced decision support systems based on statistical, OLAP and data mining methods. W e used OLAP to enable interactive exploration and analysis of the data. W e found out that data warehousing and OLAP are suitable for the domain of public health and that they enable new analytical possibilities in addition to the traditional statistical approaches.
Stolba and Tjoa[7] showed that integration of data warehousing, OLAP and data mining techniques in the healthcare area, an easy to use decision support platform, which supports decision making process of care givers and clinical managers, is built. They presented three case studies, which showed, that a clinical data warehouse that facilitates evidence-based medicine is a reliable, powerful and user-friendly platform for strategic decision making, which has a great relevance for the practice and acceptance of evidence-based medicine.
2.1Data Warehouse
The concept of "data warehousing" arose in mid 1980s with the intention to support huge information analysis and management reporting [4]. Data warehouse was defined According to Bill Inmon a “subject-oriented, integrated, time variant and non-volatile collection of data in support of management’s decision making process” [11].
Since the concept of data warehouse can be used for different paths that need support decision so the clinical
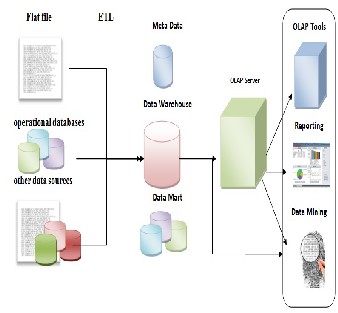
path is the most important path since the information which will be gotten is critical and important for human life.Data warehouse can be consider as a repository which combine different kinds of data either from operational or historical sources and combine these source into single schema Figure (1).
Data W arehouse works as foundation for decision making process, as for taking considering organization (data related), so, we preliminary focuses on the DW . It makes information easy to accessible as we can generate reports, like Operational & Enterprise report from the data warehouse. Data W arehouse is not only serve reporting and analytics but can be used as for operational reason like a contact center executive
looking at customer single view, while doing up sell or cross-cell to customer.[1]

Figure (1) Data Warehouse Architecture
2.2Star Schema
The structure of the data warehouse is usually represented by a star schema, facts and dimensions, which are presented in the tables of physical data warehouse. Fact table is located in the centre of the data warehouse and contains foreign keys for all dimension tables [3].The star schema is perhaps the simplest data warehouse schema. It is called a star schema because the entity-relationship diagram of this schema resembles a star, with points radiating from a central table [15].
2.3Extract, Transform, Load (ETL)
Set of processes by which the operational data sources is prepared for the data warehouse. The ETL Processes are the primary processes of the backroom data staging area of the data warehouse which are prior to any presentationor querying. It Consists of extracting operational data from a sourceapplication, transforming it, loading and indexing it, quality-assuring it, and publishing it[10]. The ETL is shortcut for Extract, Transform and load, ETL system can be either hand coded or a tool. The mission of the ETL team at thehighest level is to build the back room of the data warehouse. More specifically, the ETL system must:
• Deliver data most effectively to end user tools
• Add value to data in the cleaning and conforming steps
• Protect and document the lineage of data [9].
Tools needed for building ETL are chosen based on business needs which are the information requirements of the end users of thedata warehouse. W e use the
IJSER © 2013 http://www.ijser.org
International Journal of Scientific & Engineering Research, Volume 4, Issue 11, November-2013 638
ISSN 2229-5518
term business needs somewhat narrowly here to mean the information content that end users need to make informedbusiness decisions. Other requirements listed in a moment broaden the definition of business needs, but this requirement is meant to identify the extended set of information sources that the ETL team must introduce into the data warehouse [9].
2.4Online Analytical Processing (OLAP)
According to Dr. E. F. Codd “On-Line Analytical Processing (OLAP) is a category of software technology that enables analysts,managers and executives to gain insight into data through fast, consistent, interactiveaccess in a wide variety of possible views of information that has been transformed from rawdata to reflect the real dimensionality of the enterprise as understood by the user”[14].
Need for finding relationship between many factors in our data lead us to using OLAP tools to get more specific information. OLAPenables users to access information from multidimensional data warehouses almost instantly, to view information in any way they like, and to cleanly specify and carry out sophisticated calculations [12].
OLAP enables the analyst to get information with fast way and can considered as combination of many queries in one simple query by rolling up and drilling down using hierarchy concept. The physical storage of OLAP databases is also different from Online Transactional Processing (OLTP) databases. There are three different approaches.
The first is relational OLAP (ROLAP) which uses a relational database engine to store data. Multidimensional OLAP (MOLAP) method, on the other hand, doesn’t use relational engine but uses a distinct structure for dimensional modeling of the data. Finally, Hybrid OLAP (HOLAP) uses a combinationof both techniques to store OLAP data [8].
3. Model
W e aimed to implement a data warehouse based on
two different kinds of disease registry data sources. This section shown how we divided our work into steps in order to provide fully understanding to the procedure of implementing data warehouse. These steps are:
Step 1.Prepairing data and design Data Warehouse
Schema
First of all we designed the data warehouse schema based on our diseases registry data fields. The proposed schema is star schema which it is the most appropriate schema for our project because it can understood by the professionals and users, we can add another dimensions in the future without affect the other dimensions and make the query fast and flexible which increase the performance due to little joins between fact table and dimensions.
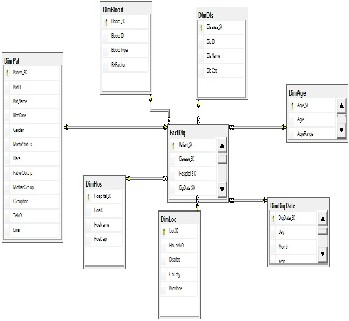
Figure (2) shows our proposed schema for the proposed Data W arehouse.

Figure (2) Data Warehouse Schema
In our work we combine two source of disease registry data, flat file and data stored in sql server. The relationship between fact table and dimensions is constructed by using surrogate keys. The problem is If we have patient with more than one disease registry entry, the primary key enforce us to add single record based on the ID of the patient. Surrogate key allows us to add more than one record for each single patient and overcome the problem.
Surrogate key allow us to use primary key to foreign key in order to connect dimensions with fact table since each record has a unique surrogate key beside the unique fields such as ID. Based on the data and by focusing on the goal of finding the relationship between the fields in the data which will benefit the clinicians and decision makers in clinical path we designed the dimensions and fact table in the data warehouse schema using Sql Server Management Server 2012 to the required schema.
Step 2.Extract, Transform and Load (ETL)
The structure design of our ETL based on tools from Sql Server Integration Service 2012. W e designed some procedures to create staging table load the staging table, assign surrogate keys and some transformation processes using sql server management service 2012.In our project we designed both ETL and ELT, so we designed two packages. The first one with sequence Extract, Transform and load and the second with sequence Extract, Load and Transform.
In the first Package (ETL) we extract the data from sql relational database and work with sequence of extraction, Transformation and loading into dimensions and finally load the surrogate keys and measurements into fact table. W hile in the second package (ELT) we extracted the data from flat file (A comma-separated
IJSER © 2013 http://www.ijser.org
International Journal of Scientific & Engineering Research, Volume 4, Issue 11, November-2013 639
ISSN 2229-5518
values csv file) and loaded it into dimensions and fact table as well and finally transformed the data while it is in the dimensions. In the second package we used a temporary table which work as staging table.
Staging table is the intermediate step in ETL between the source and Data W arehouse tables, we loaded it with data from csv file and took the data out and loaded the dimensions and fact table from staging table.
2.3 Design Cubes for OLAP
In this stage we design the cubes based on the dimensions which we created. W e design many cubes, some of them based on three dimensions and some of them based on four or five dimensions. The output cubes will be used later by the reports to produce the characterized information which give full sight about the relationship between the dimension records.
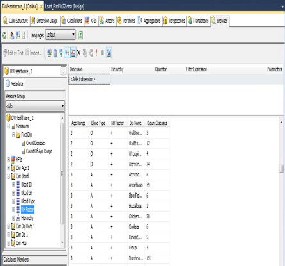
Figure(3) shown a designed cube base on Age dimension which contains Age and Age range and Blood Dimension which contain Blood type, rheumatoid factor(RH)Factor which is either (-) or (+), and Disease Check ten field, the other dimensions are shown in the figure. The output cube represent the number of persons who infected by the disease which have the specific blood type with RH Factor and his/her age fall in the age range.
W e might show the other results based on the chosen dimension’s records such as counting number of persons who infected by disease and lived in the specific province or district and grouped by hospital name for specific race and specific gender.

Figure (3) Data Warehouse Cube
2.4Prepare the Reports
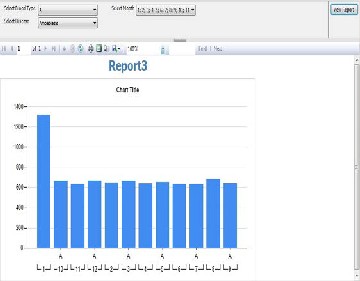
In the final stage of the study, we prepared the reports which will be seen by the analysts and decision makers in the clinical paths. The reports are designed based on the cubes which we created in the previous step. The designing of reports is so simple so we can design a lot of reports based on our required information and with our desired chart. Figure (4) shown the report concern the number of patients grouped based on blood type and month number for specific disease.
This reports can be viewed by the browser (Internet Explorer or anyone else) and protected by user name and password login interface. This security constraints protect the accessing into reports and allow only the specialists to access the reports information due to need for protecting the patients information.

Figure (4) Report Result
Conclusion and Discussion
The proposed designed approach might be implemented by the doctors, clinicians and other healthcare professionals in the Iraqi clinical institutes to support their decisions. W e highly recommending Iraqi healthcare establishments to implement this project depend on the data warehouse as a platform for their researches and to support their decisions based on analytical information. By this project they can view the data historically and based on location hierarchy.
They can adapt this CDW with Cancer data W arehouse and make them as distributed data W arehouse and after that using OLAP with data mart so they can get the valuable information from the cubes and they can Use Key Performance indicators (KPI) and performance measurements for diseases infections, indicate the critical diseases, or even watch the overall process of diseases registry systems.
IJSER © 2013 http://www.ijser.org
International Journal of Scientific & Engineering Research, Volume 4, Issue 11, November-2013 640
ISSN 2229-5518
References
[1] S. Patel,"W hat is Data W arehousing?", International Journal, 2012,
[2] R. Bagdi and P. Patil, "Diagnosis of Diabetes
Using OLAP and Data Mining Integration," International Journal of Computer Science & Communication Networks, vol. 2, pp.
314-322, 2012.
[3] S. Behrooz. Teaching Effective Methodologies to
Design a Data W arehouse, 2003. Retrieved on 25
March 2010, from (http://proc.isecon.org/2001/35c/ISECON.2001.Se yed-Abbassi.pdf).
[4] Teh Ying W ah, Ong SuanSim “Development of a Data W arehouse for Lymphoma Cancer Diagnosis and Treatment Decision Support”, 2009.
[5] L. Van, A Data W arehouse Model for Micro-Level Decision Making in Higher Education. ” The Electronic Journal o f e-Learning Volume 6 Issue 3
2008, pp. 235 – 244, available online at www.ejel.org.
[6] S. Palaniappan and C. Ling, "Clinical decision
support using OLAP with data mining," International Journal of Computer Science and Network Security, vol. 8, pp. 290-296, 2008.
[7] N. Stolba and A. M. Tjoa, "The relevance of data warehousing and data mining in the field of evidence-based medicine to support healthcare decision making," International Journal of Computer Systems Science and Engineering, vol.
3, pp. 143-148, 2006.
[8] Riordan, Rebecca M. (2005), Designing Effective Database Systems, NJ: Addison W esley Professional.
[9] R. K. J. Caserta, "The Data W arehouse ETL Toolkit," Practical Techniques for Extracting, Cleaning, Conforming, and Delivering Data, 2004.
[10] R. Kimball and M. Ross, "The data warehouse toolkit: the complete guide to dimensional modelling," Nachdr.]. New York [ua]: W iley, 2002.
[11] W. H. Inmon, (2002) “Building The Data
W arehouse”, W iley Computer Publishing. [12] E. Thomsen, OLAP solutions: building
multidimensional information systems: W iley. com,
2002.
[13] D. Hristovski, et al., "Using data warehousing and
OLAP in public health care," in Proceedings of the
AMIA Symposium, 2000, p. 369.
[14] Paulraj Ponniah, Data W arehousing
Fundamentals: A Comprehensive Guide for IT Professionals, Copyright © 2001 John W iley & Sons, Inc.
[15] Fon Silvers, “Building and Maintaining a Data
W arehouse,” AN AUERBACH BOOK”, CRC Press is an imprint of the Taylor & Francis Group, an
informa business.
[16] W.Q. Qwaider, “Medicine Decision Support
System Using OLAP with Data W arehousing”, The
Arab Academy For Banking And Financial Sciences Faculty of Information Technology Computer Information System Dept. JORDAN.
IJSER © 2013 http://www.ijser.org


