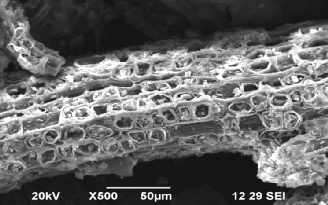
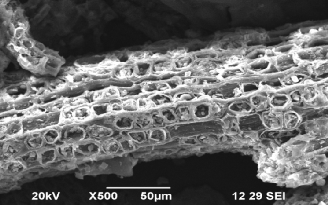
Fig.1.SEM study before adsorption of Cu using QTR. Fig.2. SEM study after adsorption of Cu by QTR.
International Journal of Scientific & Engineering Research, Volume 4, Issue 8, August-2013 444
ISSN 2229-5518
Bioremediation of Cu (II) from aqueous solutions
onto Acacia Nilotica tannin gel by batch mode study
M. K. Priya and T. Santhi*
—————————— ——————————
The remediation of several pollution problems is a target of many researchers nowadays. Technical ways of solving environmental concerns and menaces such as the dumping of surfactants, dyes, pharmaceuticals and other hazards are available long time ago, but making them cheaper and sustainable is still a challenge [1]. Heavy metal ions such as Pb, Cd, Hg, Cr, Ni, Zn and Cu are non- biodegradable, can be toxic and carcinogenic even at very low concentrations, and, hence, usually pose a serious threat to the environmental and public health [2].
Copper is a very common substance that occurs naturally in the environment and spreads through the environment through natural phenomena. The production of copper has lifted over the last decades and due to this copper quantities in the environment have expanded. Copper is present in the wastewater of several industries, such as metal cleaning and plating baths, refineries, paper and pulp, fertilizer, and wood preservatives and it is highly toxic [3].
Copper does not break down in the environment and because of that it can accumulate in plants and animals
when it is found in soils. On copper-rich soils only a limited
number of plants have a chance of survival. The excessive
intake of copper by man leads to severe mucosal irritation,
widespread capillary damage, hepatic and renal damage,
central nervous problems followed by depression,
gastrointestinal irritation, and possible necrotic changes in
the liver and kidney [4]. The main techniques that have been used on copper content reduction from industrial waste are chemical precipitation, ion exchange, membrane filtration, electrolytic methods, reverse osmosis and solvent extraction [5, 6]. However, these methods require high capital investment as well as creating sludge disposal problem [7] and also a limitation in the pH range, they do not appear to be highly effective.
Among these various treatment techniques, activated carbon adsorption is one of the most commonly used due to its high efficiency and easy operation [8, 9]. Many researchers suggest a cost effective process, such as biosorption, for removing heavy metals from wastewaters [10]. Biosorption, a biological method of environmental control can be an alternative to conventional waste- treatment facilities [6].
IJSER © 2013 http://www.ijser.org
International Journal of Scientific & Engineering Research, Volume 4, Issue 8, August-2013 445
ISSN 2229-5518
To remove some heavy metals there are other studies in which various waste biomaterial sources in different parts
of the world are used as adsorbent. For instance; tea waste adsorbent for Cu and Pb [11], pectin compounds for Pb [12],lichen (Cladonia furcata) biomass for Pb and Ni [13], diethylenetriamine functionalized polymeric adsorbent for Cu and Pb [2], crab and area shell biomass for Cuand Pb [14], olive stone waste for Cu, Pb, Cd and Ni [15], tamarind wood activated carbon for Pb [16], treated sawdust (Acacia arabica) for Cr(VI), Cu and Pb [17], anaerobic granular biomass for Cu, Pb, Cd and Ni [10], formaldehyde polymerized banana stem for Pb[18], Cassia grandis seed gum-graft-poly(methylmethacrylate) for Pb [19].
Tannins, natural biomass containing multiple adjacent hydroxyl groups and exhibiting specific affinity to metal ions, can probably be used as alternative, effective and efficient adsorbents for the recovery of metal ions. Several studies have been proposed in the literature about the use of modified tannin resins, in relation with heavy metal biosorption from water, researchers synthesized adsorbents from commercial tannins and applied them to remove heavy metals from wastewater, such as uranium [20],americium [21], chromium [22], copper [23], lead [24], thorium[25], gold [26] and palladium [27]. These studies illustrate that it is possible to remove heavy metals from wastewater with tannin adsorbents.
Tannins are an important class of secondary plant metabolites, water-soluble polyphenolic compounds of molecular weight ranged between 500 and some thousands Daltons. There are three kinds: hydrolysable, condensed and complex tannins [28]. However, tannins are water- soluble compounds, thus when they are used directly as an adsorbent for recovery of metals from aqueous systems, they have the disadvantage of being leached by water. To overcome this disadvantage, attempts have been made to immobilize tannins onto various water-insoluble matrices [29].
The objective of this study is to systematically examine adsorption mechanisms, adsorption isotherms, adsorption kinetics and properties of a tannin gel adsorbent extracted from Acacia Nilotica tannin(AT) for removal of Cu2+ from aqueous solution, and also find biosorption of binary and tertianary metal solution onto the surface of Acacia Nilotica tannin resin ATR.
100g of Acacia Nilotica leaves powder were cleaned and they were put in 600 mL of distilled water. Then 5g of NaOH were added and the mixture was stirred in magnetic stirrer at 90°C for 1 hour. Solids were separated by filtration and liquid fraction was dried in oven (65°C) for overnight. The resultant was considered as tannin extract. Total phenolic content of tannin content was calculated.
Tannin gels were prepared according to the basis of Nakano et al., [30]. Five grams of tannin extract were dissolved in 32 mL of 0.125 mol L−1 NaOH and 30mL of distilled water at 80°C. When mixture was homogeneous, certain amount of aldehyde was added and reaction was kept at the same temperature for 8h until polymerization was considered completed. Then, the apparent gummy product was lead to complete evaporation of water remain and dried in oven (65°C) overnight. After drying, tannin rigid gels were crushed and sieved to produce tiny diameters. They were washed successively with distilled water and 0.01 mol/L HNO3 to remove unreacted sodium hydroxide. Finally, the adsorbent was dried again in oven at 80°C [31].
The Taguchi method involves reducing the variation in a process through robust design of experiments. The overall objective of the method is to produce high quality product at low cost to the manufacturer. The Taguchi method was developed by Dr. Genichi Taguchi of Japan who maintained that variation. Taguchi developed a method for designing experiments to investigate how different parameters affect the mean and variance of a process performance characteristic that defines how well the process is functioning.
In order to test the ability of each tannin gel in the removal of heavy metals, dyes or surfactants, a standard protocol of adsorption was developed. Samples of aqueous solutions with the corresponding pollutants (Cu2+) were put into 100 mL-flask under strict thermal control. A fixed amount of tannin gel was added to each flask (0.1 mg) with
50 mL volume of contaminated aqueous solutions. Shaker
was applied for an hour and the absorbance of model compound before and after trial was determined. Triplicate also be done and the percentage of that adsorption is 43.5% and 4% error was noticed.
IJSER © 2013 http://www.ijser.org
International Journal of Scientific & Engineering Research, Volume 4, Issue 8, August-2013 446
ISSN 2229-5518
Design of experiments was carried out by using
SPSS 14.0 for Windows [32] and L16 matrix by Taguchi
method [33].Tannin gel was prepared according to this as taking 4 variables. Upto 16 different combinations regarding three variables were attempted. The feasible combinations were just nine of them; the rest did not gelify.
As long as it is not possible to test every combination since there are some of that did not drive to a solid product, the
whole system was considered as a categorical design, that is, no different variables are observed but nine different categories can be put into relationship, so an optimum point should be obtained.
Table.1 Design factors and levels.
Independent variables | Symbol | Range and Levels | |||
Independent variables | Symbol | 1 | 2 | 3 | 4 |
Polymerization time(h) | A | 8h | 12h | 16h | 18h |
Acetaldehyde dose(ml) | B | 2mL | 0mL | 4mL | 6mL |
Formaldehyde dosage(ml) | C | 0mL | 2mL | 4mL | 6mL |
Tannin extract(ml) | D | 5g | 7g | 9g | 11g |
The SEM enables the direct observation of the changes in
the surface structures of the resin. Morphological analysis of the QTR was performed by SEM using a Jeol JSM-
6060LV. As shown in Fig 1, many small pores and particles
with diameter <5_m are seen on the surface of Raw QT and
QTR. Studying the SEM images, it is possible to see that the
loose nature of tannin condenses as it forms into a resin. In Fig.2 the pores of QTR are completely covered with Cu ions.
IJSER © 2013 http://www.ijser.org
International Journal of Scientific & Engineering Research, Volume 4, Issue 8, August-2013 447
ISSN 2229-5518


Fig.1.SEM study before adsorption of Cu using QTR. Fig.2. SEM study after adsorption of Cu by QTR.
Phenols, the aromatic compounds with hydroxyl groups are widespread in plants. They occur in all parts of the plants. Phenols includes an array of compounds like tannin, flavonols etc.Total-phenol estimation can be carried out with the Folin-Calteu reagent. Related to the standard value we get 490 μg/mg shows high phenolic content of the tannin extracted from Acacia Nilotica.
Fourier transform infrared spectroscopy (FTIR) was used to determine the vibration frequency changes in the functional groups in the resin. The spectra of resin were measured by an FTIR spectrometer within the range of 400–
4000 cm−1wavenumber. The dry beads (about 0.1 g) was
thoroughly mixed with KBr and pressed into a pellet and the FTIR spectrum of raw AT and ATR was then recorded. The FTIR spectra of AT and ATR resin are shown in Fig.1 and Fig.3. Generally; wide bands in the range of 3550–3100 cm−1 correspond to –OH bridging groups in all systems [34] and here bands between 3304-3361 cm-1 and shows the presence of respective groups. The small peaks in the region of 2854-2927cm−1 are associated with the methylene (–CH2–) bridges of the tannin resin. The peaks at 1058-
1105cm−1 in the spectrum of AT are due to C–O stretching
and CH deformation. The absorption bands between 1631
cm−1 and 1452 cm−1 are characteristic of the elongation of the aromatic –C-C– bonds. The deformation vibration of the carbon–carbon bonds in the phenolic groups absorbs in the region of 1500–1400 cm−1. Between 3000 and 3200 cm−1 aromatic C–H peaks have increased in ATR spectrum in contrast with the one for raw AT.
IJSER © 2013 http://www.ijser.org
International Journal of Scientific & Engineering Research, Volume 4, Issue 8, August-2013 448
ISSN 2229-5518
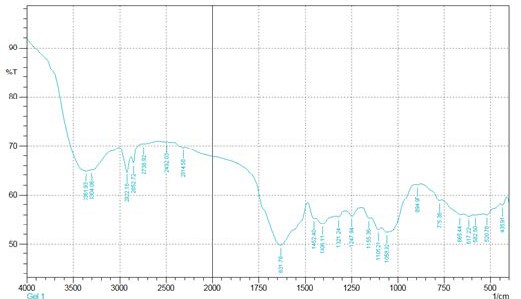
Fig. 3. FTIR result for Acacia Nilotica tannin.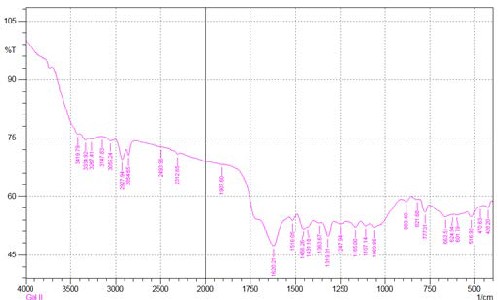
Fig. 4. FTIR results for Acacia Nilotica tannin resin.
The uptake of Cu2+ was strongly affected by solution pH. At the metal initial concentration of 100 ppm, copper removal efficiency was 13.8% at a solution of pH of 2.0. But the efficiency of removal is increased sharply when solution pHZPC of the adsorbent favors the negative surface charge of the adsorbent increases the adsorption of cation(Cu2+) due to electrostatic attraction. The optimum pH for the removal of Cu2+ onto ATR was pH = 4. Moreover, the
pH rises from 2 to 4. Fig.5 shows that in low pH (2.0 to3.0) leads to increase in H+ ion concentration in the system and surface of gel acquires positive charge(pHZPC =3),due to electrostatic repulsion ,no adsorption takes place. Furthermore the solution pH is above the zero point charge (pHZPC =3) of the adsorbent (ATR) favors the adsorption of Cu2+ ions due to the solution pH is above the
increasing in the adsorption of metal with increasing of pH value is also due to the attraction between metal ions and excess OH¯ ions in the solution [35].
IJSER © 2013 http://www.ijser.org
International Journal of Scientific & Engineering Research, Volume 4, Issue 8, August-2013 449
ISSN 2229-5518
60
50
40
30
20
10
0
2 3 4 5 6 7 8 9
Initial pH
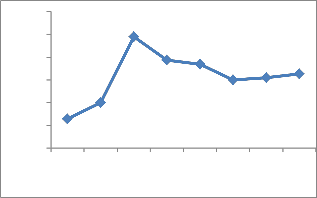
Fig. 5. Effect of pH on adsorption of copper onto ATR.
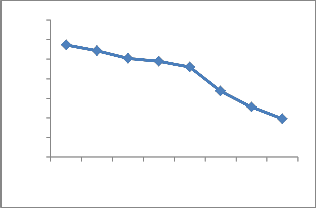
The effect of initial concentration of Cu2+ ions was studied over different range (25ppm to 200ppm). The result obtained is shown in Fig.6. The maximum uptake of Cu2+ ions at equilibrium was at 48.4% at an initial Cu2+ concentration of 100ppm.The initial concentration of Cu2+ has little influence of the time of contact necessary to reach equilibrium. The percentage of adsorption was decreased with increasing initial concentration of metal ions. Higher initial Cu2+ concentration resulted in lower diffusion efficiency and more competition of adsorbing ions for a fixed activated surface site.
70
60
50
40
30
20
10
0
25 50 75 100 125 150 175 200
Metal Concentration (ppm)
A series of contact time experiments have been carried out with a constant initial Cu2+ concentration (100 ppm). Fig.7. shows the contact time necessary for Cu2+ to reach saturation, the equilibrium of the % of adsorption occur at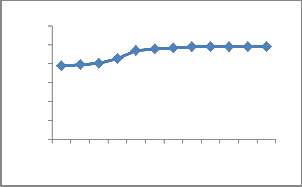
50 minutes. The distribution of Cu2+ solution, when the system in a state equilibrium, is important to establish the capacity of the adsorbent for Cu2+. Initial adsorption was rapid due to the adsorption of metal onto exterior surface, after that Cu2+ enter into pores (interior surface), and relatively slow process.
60
50
40
30
20
10
0
5 10 15 20 25 30 35 40 45 50 55 60
Time (min)
Fig. 7.Effect of contact time on adsorption of copper onto
ATR.
Equilibrium data, commonly known as sorption
isotherms, are basic requirements for the design of sorption systems. Adsorption isotherm is important to describe how solutes interact with adsorbent. Therefore, to optimize the design of sorption system to remove heavy metals from effluents, it is important to establish the most appropriate correlation for the equilibrium curves. Three isotherm equations have been tested in the present study, namely, Langmuir, Freundlich and Tempkin.
Fig. 6. Effect of initial concentration on adsorption of
copper onto ATR
IJSER © 2013 http://www.ijser.org
International Journal of Scientific & Engineering Research, Volume 4, Issue 8, August-2013 450
ISSN 2229-5518
The Langmuir model [36] is described by the equation:
logq e = log K F +
1
![]()
logC e
(3)
![]()
C e =
q e
![]()
1
K a Q m
![]()
+ ( 1
m
n
×C e )
2
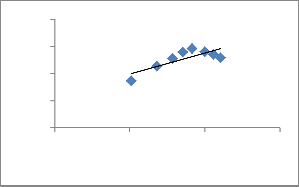
Where qe and Ce are defined before in Eq. (1), Qm is a constant and reflect a complete monolayer (mgg-1) on the surface bound at high Ce; Ka is adsorption equilibrium constant(Lmg-1) that is related to the apparent energy of sorption and the affinity of the binding sites. A linear plot of specific adsorption (Ce/qe) versus the equilibrium concentration (Ce) should indicate a straight line of slope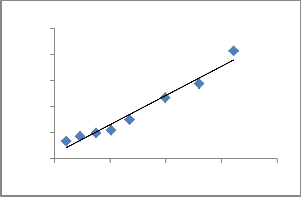
1/Qm and an intercept of 1/ (KaQm).
1.5
1
0.5
0
y = 0.3856x + 0.6058
R² = 0.6378
0 1 2 3
logCe
10
8 y = 0.0448x + 0.3523
6 R² = 0.966
4
2
0
Fig.9. Freundlich adsorption isotherm of Cu2+ on ATR.
Tempkin and Pyzhev [38] considered the effects of some indirect adsorbate/adsorbate interactions on adsorption isotherms and suggested that because of these interactions the heat of adsorption of all the molecules in
0 50 Ce
100 150 200
the layer would decrease linearly with coverage. The
Tempkin isotherm has been used in the following form:
Fig. 8. Langmuir adsorption isotherm of Cu2+ onto ATR.
q e =
RT
![]()
ln( AC e )
b
(4)
The Freundlich [37] model can be described by the following equation:
The Temkin isotherm Eq. (4) can be simplified to the following equation:
q e = K F C e
1 / n
(2)
q e = β ln α + β lnC e
(5)
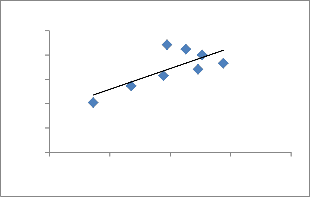
Where, Ce is the equilibrium concentration (mg/L), q e is the amount adsorbed onto ATR (mg/g), and Kf and 1/n are Freundlich constants. The Kf is related to the bonding energy and can be defined as the adsorption or
β = (RT)/ b (6)
Where,
distribution coefficient and represents the quantity of metal adsorbed onto ATR for unit equilibrium
concentration.
Eq. (2) can be linearized in the logarithmic form
(Eq. (3)) and the Freundlich constants can be determined:
The constant b (L/ mg) is related to the heat of adsorption
and the constant α is the equilibrium binding constant.
IJSER © 2013 http://www.ijser.org
International Journal of Scientific & Engineering Research, Volume 4, Issue 8, August-2013 451
ISSN 2229-5518
2.5
2
1.5
1
0.5
0
y = 0.043x + 0.8629
R² = 0.5555
0 10 20 30 40
qe
The outcome values of parameters Qm, Ka, Kf, n, b, β,α and R2 for all the experiments for removal of Cu2+ are presented in Table.3. Results from Table.3 shows that the maximum monolayer adsorption capacity (Qm) =22.72 is mg/g. The Langmuir equation is valid for monolayer sorption onto a completely homogeneous surface with a finite number of identical sites. The Langmuir equation represents the better fit of experimental data than the Freundlich and Tempkin isotherm equation.
Fig. 10. Tempkin isotherm for Cu 2+ onto ATR.
Langmuir | Freundlich | Tempkin | ||||||
Qm (mgg-1) | b (Lmg-1) | R2 | 1/n | Kf (mgg-1) | R2 | α (Lg-1) | β (mgL-1) | R2 |
22.72 | 0.125 | 0.966 | 2.59 | 4.027 | 0.637 | 465.02 | 0.043 | 0.555 |
Table .3. Langmuir, Freundlich and Tempkin isotherm constants.
The kinetics of metal ions sorption is an important parameter for designing sorption system. It helps to select the optimum operating conditions for full scale batch metal removing process. The amount of Cu2+ biosorbed increases in contact time and reached equilibrium after 50 minutes. In order to examine the mechanism of biosorption process such as mass transfer and chemical reaction, a suitable kinetic model is needed to analyze the rate data.
The linear pseudo-first-order equation is given as follows
[39]
3
2
1 Time
0
-1 0 20 40 60 80
-2
-3 y = -0.1073x + 2.2934
-4 R² = 0.8441
-5
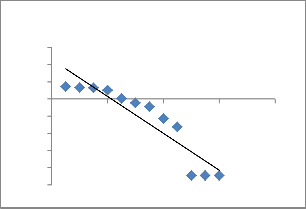
Fig. 11. Plot of the pseudo-first-order equation for the biosorption kinetics of Cu 2+onto ATR.
dq t
![]()
d t
=K 1(q e
−q t )
(7)
The values of pseudo-first-order equation parameters together with correlation co-efficient are given in Table.3. The correlation co-efficient for the pseudo-first order equation is low. Also the theoretical q e values found
Where qt and qe, are the amounts of
Cu2+ adsorbed at time t and at equilibrium (mmol g−1),
respectively, and k1 is the rate constant of pseudo-first- order adsorption process (min−1). Fig. 9 shows a plot of log (q e −q t ) vs t for biosorption of Cu2+ for the pseudo-first- order equation. The values of pseudo-first order rate constants (k1), and equilibrium biosorption capacities (qe ), for each initial copper concentration were calculated from slopes and intercepts of straight lines in Fig. 11.
from the pseudo-first-order equation did not given reasonable values. This suggests that this biosorption system is not a first-order reaction.
IJSER © 2013 http://www.ijser.org
International Journal of Scientific & Engineering Research, Volume 4, Issue 8, August-2013 452
ISSN 2229-5518
The adsorption kinetics may be described by the pseudo- second- order model [40]. The differential form of the
pseudo-second order equation is generally given as follows:
well with the experimental data. This strongly suggests that the biosorption of Cu2+ onto ATR is most appropriately
represented by a pseudo-second-order rate process.
dq t
![]()
d t
=K 2(q e
−q t )
(8)
The adsorption data may also be analyzed using the
Elovich equation [41], which has the linear form:
Eq. (8) can be rearranged and linearized to obtain:
Where k2 (g (mg min) −1) is the second - order rate constant of adsorption.![]()
𝑑𝑞𝑡
𝑑𝑡
= 𝐵𝐸 exp(−𝐴𝐸 𝑞𝑡 ) (11)
![]()
![]()
t =
qt K
1
q e 2
![]()
+ 1 (t )
q e
(9)
Where BE is the initial adsorption rate (mg (g min) −1) and AE is the de-sorption constant (g mg−1) during any experiment. It is simplified by assuming A E B Et ![]() t and by applying the boundary conditions q t = 0 at t = 0 and q t = q t
t and by applying the boundary conditions q t = 0 at t = 0 and q t = q t
The second - order rate constants were used to calculate the initial sorption rate, given by the following
at t = t Eq. (27) becomes
1
equation:
h = K 2 q e
(10)
𝑞𝑡= 1
𝐴𝐸
30
25
![]()
ln(𝐵𝐸 𝐴𝐸 ) +
𝐴𝐸
ln(𝑡) (12)
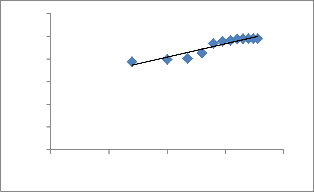
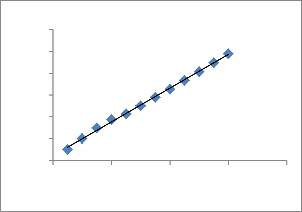
Fig.12 shows typical plots of pseudo-second-order equation 20
for the copper–ATR system as t/qt vs t.
15
10
y = 5.9366x + 14.465
R² = 0.8889
3
2.5
2
1.5
1
0.5
y = 0.0386x + 0.113
R² = 0.9982
5
0
0 0.5 1 1.5 2 log t(min)
0
0 20 40 60 80
Time
Fig. 12. Plot of the pseudo-second-order equation for the biosorption kinetics of Cu 2+ onto ATR.
The straight lines in plot of linear pseudo-second- order equation shows good agreement of experimental data with the pseudo-second-order kinetic model for different initial copper concentrations. The values of pseudo-second- order equation parameters together with correlation coefficients are listed in Table.3. The correlation coefficients for the pseudo-second-order equation were 0.998 for all concentrations. The calculated q e values also agree very
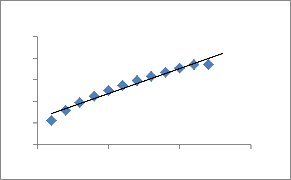
Fig. 13. Plot of the Elovich equation for the biosorption kinetics of Cu2+ onto ATR.
In the case of using the Elovich equation, the correlation coefficients are lower than those of the pseudo- second-order equation. It cannot be used to describe the kinetics of biosorption of Cu2+ onto ATR.
Because Eqs. (7) and (11) cannot identify the diffusion mechanisms; the intraparticle diffusion model was also tested Fig.14 shows a plot of the linearized form of the intraparticle diffusion model at all concentrations studied.
IJSER © 2013 http://www.ijser.org
International Journal of Scientific & Engineering Research, Volume 4, Issue 8, August-2013 453
ISSN 2229-5518
10
8
6
4 y = 0.4658x + 2.3913
R² = 0.966
2
0
0 5 t1/2(min) 10 15
Fig. 14. Plot of the Intraparticle diffusion equation Cu 2+onto ATR.
Pseudo first order | Pseudo second order | Elovich equation | Intraparticle diffusion | ||||||||
K1 min-1 | q e (mg/g) | R2 | K2 (gmg-1 min-1) | q e mg/g | R2 | AE | BE | R2 | Ce | Kdiff | R2 |
0.246 | 196.3 | 0.844 | 0.0049 | 26.31 | 0.998 | 0.1684 | 11.32 | 0.888 | 14.46 | 0.465 | 0.966 |
Table. 4. Kinetic parameters for the sorption of Cu2+ on ATR.
The Langmuir isotherm and pseudo-second-order kinetic model provide best correlation with the experimental data
for the adsorption of copper ions onto ATR.
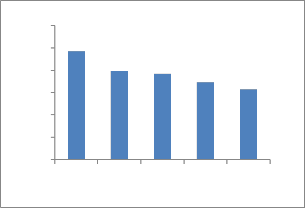
As showing in the Fig.15, the results indicated that the equilibrium uptake of Cu2+ ions decreased with the increasing concentration of Ni2+ ions. In single-ion-system, the maximum uptake obtained at initial concentration of
60
50
40
30
20
10
0
Cu2+ 100 ppm, pH=5 was found to be 48.93%, while uptake in binary metal solutions at the same initial concentration of
Cu2+ ions and biosorption condition was found to be
39.52%, 38.50%, 34.55% and 31.48% when concentration of
Ni2+ ions was 10 ppm, 20 ppm, 30 ppm and 40 ppm respectively. This is because of fixed quantity of ATR could only after a finite number of surface binding sites, some of which would be expected to be saturated by the competing metal ions especially at relatively high concentration of them and this was indeed observed [42].
As shown in the Fig. 16, the result of binary solution of copper and chromium indicated that the adsorption of Cu2+ ions increased slightly with the increasing concentration of Cr ions as compared with the single-ion-situation. This is may be because of the formation of chromium cyanide complex which is used as a complexing reagent for copper.
0 10 20 30 40
metal concentration(ppm)
Fig.15. Binary solutions of Cu and Ni.
IJSER © 2013 http://www.ijser.org
International Journal of Scientific & Engineering Research, Volume 4, Issue 8, August-2013 454
ISSN 2229-5518
70
60
50
40
30
20
10
0
0 10 20 30 40
metal concentration(ppm)
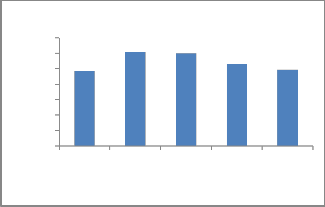
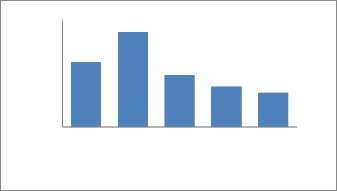
Fig. 16. Binary solution of Cu and Cr.
80
60
40
20
0
0 10 20 30 40
metal concentraion(ppm)
Fig. 17. Tertiary solution of Cu, Ni and Cr.
The decrease in adsorption capacity of same biomass in tertiary solution than that of single metal ions may be due to the less availability of binding sites. In case of multi- metal solution, the binding site is competitively divided among the various metal ions, Cu, Cr and Ni.
The aim of the work was to find the possible use of Acacia Nilotica tannin resin as a sorbent for the removal of Cu2+ from aqueous solution. Experiments were performed as a function of initial pH, contact time and initial concentration .Adsorption at pH 4 enhanced the efficiency of adsorption process. Increasing the time, the adsorption yield also increases. Equilibrium data of adsorption were correlated with Langmuir, Freudlinch, Tempkin, Intraparticular diffusion and Langmuir model were found to provide the best fit of experimental data. According to the Langmuir model, the maximum Cu2+ adsorption capacity of ATR was 48.4%. The suitability of the pseudo- first-order, pseudo-second order and particle-diffusion type kinetic models for the sorption of Cu2+ onto ATR for all situations was also discussed. The results showed that
pseudo-second-order kinetic model was found to be in good agreement with the experimental results. Results
obtained from this study showed that ATR can be used as an adsorbent for the removal of Cu2+ from the aqueous solution in a static batch system.
[1] S. Altenor, E. Carene, E. Emmanuel,, J. Lambert,, J.J.
Ehrhardt, and S. Gaspard, “Adsorption studies of methylene blue and phenol onto Vetiver roots activated carbon prepared by chemical activation”, Vol.165, pp.
1029–1039, Journal of Hazardous Materials , 2009.
[2] M. Khotimchenko, V. Kovalev, and Y. Khotimchenko,
“Equilibrium studies of sorption Of lead (II) ions by different pectin compounds”, Vol. 149, pp, 693–699, Journal of Hazardous materials, 2007.
[3] M.H. Kalavathy, T. Karthikeyan, S. Rajgopal, and L.R
Miranda, “Kinetic and isotherm studies of Cu (II)
adsorption onto H3PO4-activated rubber wood sawdust”
,Vol. 292, pp. 354–362, Journal of Colloid Interface
Science, 2005.
[4] T. Gotoh, K. Matsushima, and K.Kikuchi, “Adsorption
of Cu and Mn on covalently cross-linked alginate gel
beads”, pp. 55-57, Chemosphere, 2004.
[5] Y.H. Huang, C.L. Hsueh, C.P. Huang, L.C. Su, and
C.Y. Chen, “Adsorption thermodynamic and kinetic studies of Pb(II) removal from water onto a versatile Al2O3-supported iron oxide”,Vol. 55, pp. 23–29, Purification & Technology ,Sep, 2007.
[6] O.S. Amuda, A.A. Giwa, and I.A. Bello, Removal of
heavy metal from industrial Wastewater using modified activated coconut shell carbon, Vol. 36, pp. 174–181, Biochemical Engineering Journal, 2007.
[7] H.A. Aziz, M.N. Adlan, and K.S. Ariffin, “Heavy metals (Cd, Pb, Zn, Ni, Cu and Cr (III)) removal from water in Malaysia post treatment by high quality limestone”, Vol.99 (6), p-p. 1578–1583, Bioresource Technology,2008.
[8] S. Gomez-Salazar, J.S. Lee, J.C. Heydweiller, and L.
Tavlarides, “Analysis of cadmium adsorption on novel
organo-ceramic adsorbents with a thiol functionality”, Vol.
42, pp. 3403, Industrial & Engineering Chemistry
Research, 2003.
[9] K.C. Justi, V.T. F´avere, M.C.M. Laranjeira, A. Neves,
and R.A. Peralta, “Kinetics and equilibrium
adsorption of Cu(II), Cd(II), and Ni(II) ionsby chitosan functionalized with 2[-bis- (pyridylmethyl)aminomethyl]-4-methyl-6- formylphenol”,Vol.291,pp.369–374, Journal of Colloid Interface Science, 2005.
[10] A.H. Hawari, and C.N. Mulligan, “Biosorption of lead
(II), cadmium (II), copper (II) and nickel (II) by anaerobic
IJSER © 2013 http://www.ijser.org
International Journal of Scientific & Engineering Research, Volume 4, Issue 8, August-2013 455
ISSN 2229-5518
granular biomass”, Vol. 97, pp. 692–700, Bioresource of
Technology, 2006.
[11] O.S. Amuda, A.A. Giwa, and I.A. Bello, “Removal of heavy metal from industrial wastewater using modified activated coconut shell carbon”, Vol.36, pp.174–181, Biochemical Engineering Journal., 2007.
[12] B.M.W.P.K. Amarasinghe, and R.A. Williams, “ Tea
waste as a low cost adsorbent for the removal of Cu and Pb from wastewater, Vol.132, pp. 299–309, Chemical Engineering Journal, 2007.
[13] M. Khotimchenko, V. Kovalev, and Y. Khotimchenko,
“Equilibrium studies of sorption of lead(II) ions by different
pectin compound”, Vol.149, pp, 693–699, Journal of
Hazardous Material, 2007.
[14] A. Sarı, M. Tuzen, O.D. Uluozlu, and M. Soylak, “Biosorption of Pb(II) and Ni(II) from aqueous solution by Lichen (Cladonia furcata) Biomass”, Vol.37, pp.151–158. Biochemical Engineering Journal, 2007.
[15] N. Fiol, I. Villaescusa, M. Martinez, N. Miralles, J.
Poch, and J. Serarols, “Sorption of Pb (II), Ni(II), Cu(II) and Cd(II) from aqueous solution by olive stone waste”, Vol.50, pp.132–140, Purification & Technology, Sep,
2006.
[16] C.K. Singh, J.N. Sahu, K.K. Mahalik, C.R. Mohanty,
B. Raj Mohan, and B.C. Meikap, “Studies on the removal of Pb (II) from wastewater by activated carbon developed from tamarind wood activated with sulphuric acid”, Vol. 153, pp.221– 228, Journal of Hazardous Material, 2008.
[17] A. Meena, K. Kadirvelu, G.K Mishra, Chitra Rajagopal, and P.N. Nagar, “Adsorptive removal of heavy metals from aqueous solution by treated sawdust (Acacia Arabica)”, Vol.150, pp. 604–611, Journal of Hazardous Materials, 2008.
[18] B.F. Noeline, D.M. Manohar, and T.S. Anirudhan, “Kinetic and equilibrium modeling of lead (II) sorption from water and wastewater by polymerized banana stem in a batch reactor”,Vol.45, pp .131–140, Purification & Technology, 2005.
[19] V. Singh, S. Tiwari, A. Kumar Sharma, and R. Sanghi, “Removal of lead from aqueous solutions using Cassia grandis seed gum-graft-poly(methylmethacrylate”, Vol.
316,pp .224–232. Journal of Colloid and Interface
Science, 2007.
[20] T. Sakaguchi, and A. Nakajima, “Accumulation of uranium by immobilized persimmon tannin, Vol.29, pp
.205–221, Sci. Technol. Sep, 1994.
[21] T. Matsumura, and S. Usuda, “Applicability of insoluble tannin to treatment of waste containing americium”, p-p, 244–247, Journal of Alloys Compounds, 1998.
[22] Y. Nakano, K. Takeshita, and T. Tsutsumi, ‘Adsorption mechanism of hexavalent chromium by redox within
condensed tannin gel”, Vol.35, pp.496–500, Water
Research, 2001.
[23] H.Yamaguchi, R. Higasida, R., M. Higuchi, M., and Sakata, I., Adsorption mechanism of heavy-metal ion by microspherical tannin resin, Vol. 45, pp. 1463–1472, Journal of Applied Polymer Science, 1992.
[24] X.M. Zhan, and X. Zhao, “Mechanism of lead adsorption
from aqueous solutions using an adsorbent synthesized from natural condensed tannin”, Vol. 37, pp. 3905–3912, Water Research, 2003.
[25] X. Liao, L. Li, and B. Shi, “Adsorption recovery of thorium (IV) by Myrica rubra tannin and larch tannin immobilized onto collagen fiber”, Vol.260, pp. 619–625, Journal of Radio Nuclear Chemistry, 2004.
[26] T. Ogata, and Y. Nakano. Mechanisms of gold recovery
from aqueous solutions using a novel tannin gel adsorbent synthesized from natural condensed tannin, Vol.39, pp.
4281–4286. , Water Research, 2005.
[27] Kim, Y.H., and Nakano, Y., “Adsorption mechanism of
palladium by redox within Condensed-tannin gel”, Vol.39,
pp .1324–1330, Water Research, 2005.
[28] E. Haslam, “Vegetables and Tannins Revisited”,
Cambridge University Press, Cambridge, Plant
Polyphenols, 1989.
[29] X. Liao, Z. Lu, M. Zhang, X. Liu, and B. Shi,
“Adsorption of Cu(II) from aqueous solutions by tannins immobilized on collagen”, Vol. 79, pp. 335–342, Journal of Chemical Technology & Biotechnology, 2004.
[30] J. Sánchez-Martín, J. Beltrán-Heredia1, and P. Gibello-
Pérez, “Adsorbent biopolymers from tannin extract for
water treatmen”t, Department of Chemical Engineering and Physical Chemistry, University of Extremadura, Avda. de Elvas, s/n, 06071, Badajoz, Spain.
[31] SPSS Inc., SPSS 14.0 Developer’s guide, Chicago,
Illinois, 2005.
[32] G. Taguchi, “System of experimental design”, Krus
International, NewYork, 1986.
[33] Meral Yurtsever, I. Ayhan, and Sengil, “Biosorption of Pb(II) ions by modified quebracho tannin resin” , Vol. 163, pp.58–64, Journal of Hazardous Materials, 2009.
[34] T. Santhi ,S. Manonmani, T. Smitha, “Removal of malachite green from aqueous solution by activated carbon prepared from the epicarp of Ricinus communis by adsorption”,.Vol.179, pp.178-186, Journal of Hazardous Mater, 2010.
[35] Langmuir, I., “The adsorption of gases on plane surface of glass, mica and platinum”, Vol. 40, p-p.1361–1368, Journal of American Chemical Society, 1918.
IJSER © 2013 http://www.ijser.org
International Journal of Scientific & Engineering Research, Volume 4, Issue 8, August-2013 456
ISSN 2229-5518
[36] H.M.F. Freundlich, “Over the adsorption in solution”, Vol.57A, pp. 385–470. Journal of Physical Chemistry,
1906.
[37] M.J. Tempkin, and V. Pyzhev, “Kinetics of ammonia
synthesis on promoted iron catalyst”.Vol.12, pp. 217–222, Acta Physicochim Journal, 1940.
[38] M.Ozacar, and I.A.S. Engil, “Adsorption of reactive dyes
on calcined alunite from aqueous solutions, Vol.98, pp.
211–224, Journal of hazardous materials, 2003.
[39] M. Ozacar, and I.A.S. Engil, “Two-stage batch sorber design using second-order kinetic model for the sorption of metal complex dyes onto pine sawdust”, Vol.21, pp.39–45, Biochemical Engineering Journal, 2004.
[40] M. Ozacar, and I.A.S. Engil, “A kinetic study of metal
complex dye sorption onto pine sawdust”, Vol. 40, pp.565–
572, Process Biochemistry Journal, 2005.
[41] I. Ayhan Sengil Engil, and Mahmut Ozacar, “Competitive biosorption of Pb2+, Cu2+ and Zn2+ ions
from aqueous solutions onto valonia tannin resin”, Vol.166 p-p,1488–1494, Journal of Hazardous Materials, 2009.
IJSER © 2013 http://www.ijser.org