International Journal of Scientific & Engineering Research, Volume 6, Issue 2, February-2015 1116
ISSN 2229-5518
Assessment of the Coastal Area Water Quality in
Noakhali, Bangladesh.
***Muhammed Y. Miah, **F. N. Robel, *S. Bhowmik, *S. Bhattacharjee, *S. C. Paul, *M.J. Hossain,*M.Z. Hossain
Abstract: In this study, water quality assessment of different sources (surface water and ground water) in the coastal belt region of Noakhali was conducted. Physical parameters of the supplied samples like Color, Odor, Temperature, and Taste were identified. Beside this pH, Conductivity, Total dissolved solid (TDS), Hardness, Alkalinity, Chloride, cations, Arsenic(As), Cadmium (Cd), Lead (Pb), Mercury(Hg), Chromium(Cr), Dissolved Oxygen were measured to understand the physicochemical parameters, salinity and the presence of toxic metal ions in water. pH values for surface water were 6.3- 7.49and those of ground water were 7.33-8.5; Total hardness for surface water was
70-132 ppm and ground water was 180-296 ppm as CaCO3; Electrical conductivity (EC) for surface water was 576-1040µs and that of ground water was 5210-8170 µs . Ground water (deep) source contains highest level of Chloride and TDS which is 1683ppm and 1152ppm respectively. The alkalinity of the underground water was 2115 ppm & 518ppm which was higher than the surface water which was 68.5 ppm 112.5 respectively. The DO values were 2.4ppm & 3ppm for ground water and 4.05 & 4.95ppm for surface water. All the measured concentration of toxic metal ions (As, Cd, Pb, Hg, Cr) were below standard permissible limit.
Keywords: Water quality, Physical parameters, physicochemical parameters, Heavy metals, Surface water, Ground Water, Salinity.
1. INTRODUCTION
—————————— ——————————
Water is the source of life on earth. The water quality is the key to all of the roles that water plays in human life and natural environment. Surface and ground water are the main water resources for drinking, bathing, irrigation and household purposes for the coastal population of Bangladesh (Palaniappan et. al., 2010). But the water quality of the coastal region is deteriorating day by day because of anthropogenic activities (mining, untreated waste disposal, using pesticides, organic matter and nutrients etc.) and excessive presence of metal ions (Na, Ca, Fe, Pb, As, Cr etc.) (Ahmed et al., 2011).
In coastal area of Bangladesh, natural water sources, such as rivers and groundwater are contaminated by salinity and other metal ions because of saltwater intrusion from the Bay of Bengal, storm surges and upstream withdrawal of freshwater (Khan et. al., 2011).
It has been estimated that about 80% of all diseases and over one third of deaths in developing countries like Bangladesh are caused by the consumption of contaminated water (UNCED, 1992). As like other coastal zone contamination of water quality, depletion of water resources and loss of aquatic biodiversity are prominent features in the coastal areas of Noakhali.


*** Associate Professor, Department of Applied Chemistry & Chemical Engineering, Noakhali Science & Technology University, Bangladesh.
** Assistant Professor, Department of Applied Chemistry & Chemical Engineering, Noakhali Science & Technology University, Bangladesh.
* Student, Department of Applied Chemistry & Chemical
Engineering, Noakhali Science & Technology University,
Bangladesh.
As this contaminated water is used by a large number of
people of this coastal area, they are severely affected by
hypertension, heart failure, kidney failure, skin diseases,
carcinogenic diseases and other water borne diseases.
Therefore, a detailed study of water quality in this coastal region is essential.
The present study aimed to determine the extent of physicochemical parameters, salinity and toxic metal ions in coastal belt region of Noakhali so that the warning signal can be given to the mass people. These data can be utilized
to establish local and national policies and for taking mitigation measures to minimize the water contamination. The study can also provide information about the possible causes of water pollution to increase the public awareness.
2. STUDY AREA DESCRIPTION
The coastal area of Bangladesh is 47201 sq. km which covers 19 districts. The coastline is 710 km long that lies parallel to the Bay of Bengal (CZPo, 2005). About 36.8 million people is accommodating in the coastal zone (MoWR, 2006). Noakhali is a district in South-eastern coastal zone of Bangladesh which geographically stands on
22°50’N 91°06′E/22.83°N 91.10°E coordinates (LGED
Noakhali, 2011). The average annual temperature varies
from district to a maximum of 34.3 ° C and a minimum of
14.4 ° C, annual rainfall is 3,302 mm. The main rivers are the Meghna and Bamni.
This southern coastal belt of the country is facing huge challenges in meeting freshwater demand due to limited water supply, presence of salinity and other water quality problems (Adhikary et al., 2011).
The sampling area of this study is the coastal area of
Noakhali which lies between 22°50′ to 22°83′ N latitude and
91°06′E to 91°10′ E longitude with an area of 4203 sq. km
(LGED Noakhali, 2011). Samples were collected from
different locations (shown by arrow with sample no in the
IJSER © 2015 http://www.ijser.org
International Journal of Scientific & Engineering Research, Volume 6, Issue 2, February-2015 1117
ISSN 2229-5518
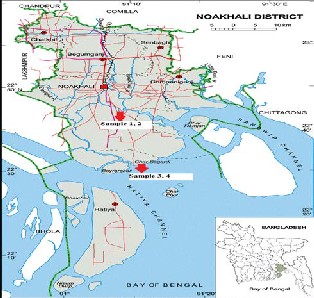
map) by using the standard sampling methodology.
Fig1: Map showing sample collection zones
3. EXPERIMENTAL & METHODOLOGY
3.1 . Sample collection:
Ground water samples were collected from tube wells after discarding the water for the first two minutes and surface water samples were collected about 0.1 m below water level. Five samples are collected from each location. All the samples were taken in the polyethylene terephthalate (PET) bottles during monsoon. Before filling the bottles were rinsed three times with sample water. The sample was collected from April - December of 2012.
Table 1: Sample no. and their source
• AAS (Model-AA-6800) Japan
• Micro pipettes (Model- GILSON BB60175)
• Weight Machine (Model-AGN220C)
• Filter paper (Model-Whitman 41) China,
• Thermometer (Model-N/F BS 1740), England.
3.4. Reagents:
All the chemicals used were reagent grade.
3.5. Labeling of samples:
The containers were labeled with the following information during sampling
a) Date
b) Sample number
c) Exact point of sampling
d) Temperature
3.6. Methodology
Electrical conductance (EC):
The conductivity of the water samples were measured as soon as possible after collection. A digital EC meter was used for this purpose.
Total dissolved solids (TDS):
The total dissolved solids (TDS) of the samples were recorded by TDS probe of EC meter.
pH:
pH in the field and in the laboratory samples was measured by a digital pH meter.
Total hardness:
Total hardness of water samples were measured by EDTA titration. Sample was taken in a conical flask. To it 1mL of ammonia buffer solution and 2-3 drops of Eriochrome black T were added, the solution was turn into wine red. The content was titrated with 0.01 M EDTA the color was changed to blue at the end point (Tripathi, et. al, 2001).
Alkalinity:
The alkalinity of water is due to dissolved hydroxide, carbonate and bicarbonate and determined by neutralization titration.
3.2. Research Location:
All of the experiment was carried out at Department of
Applied Chemistry & Chemical Engineering (ACCE)

Alkalinity= volume of H2SO4 ×Normality ×50 ×1000
Volume of Sample taken
as CaCO3 equivalent.
Determination of chloride:
= ppm
Laboratory of Noakhali Science & Technology University (NSTU). But the analysis of toxic metal ions was only carried out at Bangladesh Council of scientific and Industrial Research (BCSIR) Laboratory, Dhaka.
3.3. Equipment’s:
The equipment’s used for the purpose are as follows:
• Conductivity meter (Model-COND5021) China,
• pH meter (Model-Clida Instument Phs 25)
Chloride was measured volumetrically by silver nitrate titrimetric method using potassium chromate as indicator and was calculated in terms of mg/L
Determination of toxic metals:
This process is carried out by Atomic Absorption Spectroscopy at BCSIR Laboratory, Dhaka. To determine the concentration of metal ions, a calibration curve was made with the standard solutions. Then the metal ion of the
IJSER © 2015 http://www.ijser.org
International Journal of Scientific & Engineering Research, Volume 6, Issue 2, February-2015 1118
ISSN 2229-5518
sample was found out from the calibration curve.
Determination of DO:
This is done by Winkler method. This method is not useful when the sample contains sulphites, thiosulphates and high BOD.
Dissolved Oxygen
= (Volume of Sodium Thiosulphate × 0.2 × 1000)/ (Volume of Sample Taken) = ppm of DO
Determination of Correlation coefficient:
A measure that determines the degree to which two variable's movements is associated. The correlation coefficient will vary from -1 to +1. A -1 indicates perfect negative correlation, and +1 indicates perfect positive correlation.
Let x and y are the two variables, N is the total number of observation made and then the correlation coefficient (r) between the variable x and y is given by,
Correlation coefficient (r) =
(Ƹxy − ƸxƸy/N )/√({Ƹx2 − (Ƹx)2/N}{Ƹy2 − (Ƹy)2/N} )
If the values of correlation coefficient ‘r’ between two
variables x and y are fairly large, it implies that these two
variables are highly correlated
4. RESULTS & DISCUSSION:
4.1 Physical properties of Water:
Table 2: Summery of measured physical properties
found in Noakhali are within the standard limit required for the drinking as well as cultivation or sustaining of aquatic animals. Water having a pH range (Anderws, 1972) from 6.7 to 8.6 will generally support a good fish culture when other parameters are favorable. So the present values of pH also indicate that the ground and surface water in this area is not objectionable to fish culture, irrigation, domestic, and other purposes.
Table 3: Summery of measured pH values
Sample No | pH | Standard value |
Sample 1 | Maximum | 7.98 | 6.5-8.5 |
Sample 1 | Minimum | 7.33 | 6.5-8.5 |
Sample 1 | Mean | 7.655 | 6.5-8.5 |
Sample 1 | Std. Dev. | 0.459619 | 6.5-8.5 |
Sample 2 | Maximum | 8.13 | 6.5-8.5 |
Sample 2 | Minimum | 7.5 | 6.5-8.5 |
Sample 2 | Mean | 7.815 | 6.5-8.5 |
Sample 2 | Std. Dev. | 0.445477 | 6.5-8.5 |
Sample 3 | Maximum | 7.49 | 6.5-8.5 |
Sample 3 | Minimum | 7.09 | 6.5-8.5 |
Sample 3 | Mean | 7.29 | 6.5-8.5 |
Sample 3 | Std. Dev. | 0.282842 | 6.5-8.5 |
Sample 4 | Maximum | 6.5 | 6.5-8.5 |
Sample 4 | Minimum | 6.3 | 6.5-8.5 |
Sample 4 | Mean | 6.4 | 6.5-8.5 |
Sample 4 | Std. Dev. | 0.141421 | 6.5-8.5 |
Total Dissolved Solid (TDS):

Table 4: Summery of measured TDS values
Sample No TDS (ppm) Standard value (ppm)
4.2 Physicochemical Parameters of Water Quality:
pH:
The pH values of ground water and surface water samples vary from 7.33 to 8.13 and 6.3 to 7.49 respectively. Except river water, the pH concentrations of samples of different source were found in permissible range of 6.5-8.5 according to recommended values of WHO (2006) and Environmental Conservation Rule (ECR) Bangladesh (1997). The maximum value is 8.13, found in underground water and the minimum value is 6.3 which is found in Noakhali river. The pH value indicates the acidic or alkaline nature and the concentration of hydrogen ion in water.
Sample 1
Sample 2
Sample 3
Sample 4
Up to
1500
Up to
1500
Fresh water
Less than
1000
Fresh water
Less than
1000
The pH of the ground water and surface water that have
The maximum concentrations of TDS were 1152ppm,
IJSER © 2015 http://www.ijser.org
International Journal of Scientific & Engineering Research, Volume 6, Issue 2, February-2015 1119
ISSN 2229-5518
748ppm, 80ppm and 320ppm in Sample-1, Sample-2, Sample-3 and Sample-4 respectively. Respective minimum values were 1132ppm, 744ppm, 73ppm and 290ppm. Only the TDS values of deep underground water exceeds the recommended range (1000ppm) of WHO (2006) and ECR of Bangladesh (1997). Higher amount of TDS in Ground water may be due to the seawater intrusion in the coastal region. Surface water is better than ground water in respect to TDS. The highest and lowest values of surface water samples of this area are indicating that they are fresh water and are suitable for cultivation & hatchery. On the other hand, the ground water in this area are objectionable to irrigation purpose and fish culture in respect to high TDS value.
Water with high residue is normally less palatable and may
induce an unfavorable physiological reaction in the transient consumer and even may cause gastrointestinal irritation. Water containing high solid concentration may cause constipation effects. High level of TDS may aesthetically be unsatisfactory for bathing and washing. (K. Jothivenkatachalam et al., 2010).
Hardness: : Among the water samples the maximum hardness value is 296ppm which is obtained in the shallow ground water and the minimum value is 70ppm, found in pond water. The mean hardness value of pond water is almost 4 times greater than the value of underground water (200 ft depth). All hardness values of all samples are found below the acceptable limit according to ECR (1997) and WHO (2006), which is 200-500ppm and 500ppm respectively.
Table 5: Summery of measured Hardness values
surface water samples are classified as moderately hard. In general the ground water of the area is hard and associated with scale formation on boiler units, heating pipes etc. and need to be softened if used for industrial purpose. The surface water also needs to be softened if it is used for industrial purpose in terms of hardness
Conductivity:
Conductivity can be a measure of the total inorganic mineral content (i.e. TDS) of water. The maximum conductivity are 8170µs, 5330µs, 578µs and 1041µs in Sample-1, Sample-2, Sample-3 and Sample-4 respectively whereas the minimum values at those routes were 7970µs,
5210µs, 576µs and 1038µs respectively. It is seen that, pond
water has lower conductivity values than ECR of
Bangladesh (1997) permissible limits (600-1000µs). On the
other hand, the conductivity values of both shallow & deep
tube well water exceed the permissible limits drastically. Table 6: Summery of measured conductivity values
Alkalinity: Alkalinity is a measure of ability of water to resist rapid change in pH. Alkalinity rises sharply as pH raised (Sircus, 2011). Alkalinity of the surface water samples are below the WHO (2006) and ECR of Bangladesh (1997) guidelines which are 250ppm and 500ppm respectively. Mean alkalinity of Sample-3 and sample-4 are
68.5ppm and 112.5ppm respectively.
According to the following mentioned data, the tube well water samples are classified as hard. On the other hand,
Again alkalinity of both deep (maximum 2130 and minimum 2100) and shallow (maximum 520ppm and minimum 516ppm) ground water are higher than the
IJSER © 2015 http://www.ijser.org
International Journal of Scientific & Engineering Research, Volume 6, Issue 2, February-2015 1120
ISSN 2229-5518
standards. Alkalinity of deep ground water is more than 4 times greater than ECR of Bangladesh (1997) standard. Therefore the alkalinity of ground water in the study area expresses the unsuitability of water for drinking and irrigation purposes.
Table 7: Summery of measured Alkalinity values
Whereas the chloride content in the ground water is in excessive amount indicating that such water cannot be used directly for any purposes without treatment. So in order to use this water for the drinking, agricultural, household and industrial purposes is not recommended because the presence of excess salinity in water is harmful for both plants and human beings.
Amount of various Cation:
It is clear that the underground water (965 feet) is almost within the permissible limit except sodium ion. But the higher concentration of various cations in the river water is due the linking of Meghna River with the Bay of Bengal (as shown in the map). This higher concentration is an indication of less usefulness of the river water for industrial as well as for agricultural purposes without proper treatment.
Table 9: Summery of measured Cation values
Chloride:
Table 8: Summery of measured Chloride values
Sample No | Chloride (ppm) | Standard value (ppm) |
Sample 1 | Maximum | 1683 | Desirable limit: 250 Permissible limit:600 |
Sample 1 | Minimum | 1603 | Desirable limit: 250 Permissible limit:600 |
Sample 1 | Mean | 1643 | Desirable limit: 250 Permissible limit:600 |
Sample 1 | Std. Dev. | 56.57 | Desirable limit: 250 Permissible limit:600 |
Sample 2 | Maximum | 829.84 | Desirable limit: 250 Permissible limit:600 |
Sample 2 | Minimum | 801 | Desirable limit: 250 Permissible limit:600 |
Sample 2 | Mean | 815.42 | Desirable limit: 250 Permissible limit:600 |
Sample 2 | Std. Dev. | 20.42 | Desirable limit: 250 Permissible limit:600 |
Sample 3 | Maximum | 81.816 | Desirable limit: 250 Permissible limit:600 |
Sample 3 | Minimum | 69 | Desirable limit: 250 Permissible limit:600 |
Sample 3 | Mean | 75.408 | Desirable limit: 250 Permissible limit:600 |
Sample 3 | Std. Dev. | 9.062 | Desirable limit: 250 Permissible limit:600 |
Sample 4 | Maximum | 94.794 | Desirable limit: 250 Permissible limit:600 |
Sample 4 | Minimum | 85.7 | Desirable limit: 250 Permissible limit:600 |
Sample 4 | Mean | 90.247 | Desirable limit: 250 Permissible limit:600 |
Sample 4 | Std. Dev. | 6.430 | Desirable limit: 250 Permissible limit:600 |
Water containing less than 250 ppm chloride, is suitable for drinking, agricultural and industrial purposes (Anderson,
1966). In the view of the above facts, the chloride content of the surface water in this investigation lies within the level recommended for drinking, household and other purposes.
4.3 Toxic Metal Ions of Water:
The recommended and tolerance limits of arsenic in water
IJSER © 2015 http://www.ijser.org
International Journal of Scientific & Engineering Research, Volume 6, Issue 2, February-2015 1121
ISSN 2229-5518
samples are 0.01 to 0.05 ppm respectively (WHO). The recommended value for Bangladesh is 0.05 ppm. Therefore, almost all water samples in the study area are free from arsenic contamination. The concentration of cadmium in ground and surface water samples are less than 0.001ppm. National and international regulation agencies have recommended that the total Cd concentration should not exceed the maximum of 0.01 mg/L in drinking water supply (Hakanson, 1990)

Table 10: Summary of measured Toxic Metal ions of water samples
taste to drinking water. Ground water, a primary source of river flow during dry weather and base flow conditions, is naturally low in DO. Actually when inorganic and organic components increases in water it causes a rise in DO values. In the surface water the amount of organic components is higher than in the ground water. That`s why DO values of surface water is higher than ground water.
Table 11: Summary of measured DO values
| ple 1 | ple 2 | Parameter (ppm) | dard lue |
Met | Sam | Sam | | Sam | Sam | Stan Va |
Arsenic (As) | Less than 0.05 | Less than 0.05 | Less than 0.05 | Less than 0.05 | Up to 0.05 |
Cadmium (Cd) | Less than 0.001 | Less than 0.001 | Less than 0.001 | Less than 0.001 | Up to 0.01 |
Lead (Pb) | Less than 0.01 | Less than 0.01 | Less than 0.01 | Less than 0.01 | Less than 0.05 |
Chromium (Cr) | Less than 0.005 | Less than 0.005 | Less than 0.005 | Less than 0.005 | Up to 0.05 |
Cadmium is very toxic and poisonous and traces of it may cause adverse change in arteries of human kidneys. It can be concluded from the present work that surface and ground waters are free from alarming stage Cd concentration. It is observed that lead content in the ground and surface water samples of the studying zone are within the recommended values. Similarly the level of mercury and chromium of all of the samples are within the standard limit indicating that they do not cause any harmful effect on the human body.
4.4 Biological Parameter of Water (Dissolved
Oxygen):
Dissolved oxygen (DO) refers to oxygen gas that is dissolved in water. Fish "breathe" oxygen just as land animals do. The DO also contributes to provide the proper
4.5 Correlation between Various Parameters:
By considering maximum and minimum values of different parameters as a basis of calculation we get the following values of correlation coefficient(r). The correlation coefficient will vary from -1 to +1. A -1 indicates perfect negative correlation, and +1 indicates perfect positive correlation. Positive correlation means the one parameter increases or decreases with the increase or decrease of another parameter and vice-versa for the negative correlation.
The r value for pH and temperature indicates that the value of pH decreases with the increases of temperature and vice- versa. This is because with the increase of temperature the dissociation constant (H+ × OH- = Kw) of water increases which result in the increase in H + ion in water and hence decrease in pH values. But the correlation coefficient values between Conductivity & TDS, Conductivity & Hardness and Conductivity & Chloride ions gives a full positive values indicating that TDS, Hardness and Chloride increases with the Conductivity values. This can be ensured from the general concept that chloride ion present in water is also responsible for the increase in conductivity i.e. both conductivity and chloride ion values are positively
IJSER © 2015 http://www.ijser.org
International Journal of Scientific & Engineering Research, Volume 6, Issue 2, February-2015 1122
ISSN 2229-5518
correlated. This concept is also true for the conductivity and hardness correlation.
Table 12: Calculated Correlation Coefficient of various parameters.
Sample No | Correlation coefficient (r) |
Sample No | pH and Temperature | Conductivity and TDS | Conductivity and Hardness | Conductivity and Chloride ion |
Sample 1 | -1 | +1 | +1 | +1 |
Sample 2 | -1 | +1 | +1 | +1 |
Sample 3 | -1 | +1 | +1 | +1 |
Sample 4 | -1 | +1 | +1 | +1 |
5. CONCLUSIONS:
Water quality in the coastal region is mainly influenced by salinity due to seawater intrusion which reduces agriculture production and causes health hazards. According to WHO (2002), approximately 3.1% of all death worldwide, is due to unsafe water, inadequate water and hygienic problems. Inadequate amount of safe water is a serious threat to the inhabitants of coastal region of Noakhali. The assessment of four samples from different sources revealed that, pH of river is more acidic. TDS, Alkalinity, Conductivity and Chloride concentration of deep ground water is much higher than the acceptable limit. Again the amounts of cations in the deep water (250 feet) are also higher than the desirable limit. Higher amount of chloride ions and cations in water indicating that, the study area is facing huge salinity problem.
The study results can be used to increase the awareness
about health effect of salinity and carcinogenic disease
among the inhabitants of the people of this coastal area. The proper authority (government as well as NGEO’s) should come forward to supply safe and adequate drinking water
in this region. Measures should be taken for alternative safe source of water.
6. ACKNOWLEDGEMENTS:
We are grateful to the AAS technical staffs, BCSIR
Laboratory of Dhaka for helping us to analyze the metallic constituents. We are also grateful to the NSTU Laboratory
Technical Staffs for their assistance to determine the various water quality parameters. We are also grateful to University Grant Commission (UGC), Bangladesh for their financial support.
7. REFERENCES:
[1]. Palaniappan, M., Gleick, P.H., Allen, L., Cohen, M.J., Smith, J.C. and Smith, C. ‘clearing the waters: a focous on water quality solutions’, United Nations Environment Programme, 2010.
[2]. Ahmed, M.J., Haque, M.R. and Rahman, M.M.,
‘Physicochemical assessment of surface and ground water
resources of Noakhali region of Bangladesh’ International
Journal of Chemical Science and Technology, Vol.1, pp. 1-
10,2011.
[3]. Khan, A.E., Ireson, A., Kovats, S., Mojumder, S.K., Khusru, A., Rahman, A. and Vineis, P. ‘Drinking water salinity and maternal health in coastal Bangladesh: implications of climate change’, Environmental Health Perspective, pp. 1328-1332, 2011.
[4. ] UNCED (1992) ‘Protection of the Quality and Supply of Freshwater Resources: Application of Integrated Approaches to the Development, Management and Use of Water Resources’. The United Nations Conference on Environment and Development. Chapter 18, Agenda 21.
[5]. CZPo. (2005) ‘Coastal Zone Policy’, Ministry of Water Resources, Government of the People’s Republic of Bangladesh, Dhaka
[6]. MoWR (2006) ‘Coastal Development Strategy’, Water Resources Planning Organizations, Ministry of Water Resources, Government of People’s Republic of Bangladesh.
[7]. LGED Noakhali. (2011) ‘About Noakhali
[8]. Adhikary, S.K., Elahi, M.M.A. and Hossain, A.M.I.,
‘Assessment of shallow groundwater quality from six
wards of Khulna City Corporation, Bangladesh’, Int.
Journal of Applied Sciences and Engineering Research,
,Vol. 1, pp. 488-498, 2012.
[9]. Tripathi, B. D. and Govil, S. R. 2001. Water Pollution
(An Experimental Approach). CBS Publication. New Delhi.
IJSER © 2015 http://www.ijser.org
International Journal of Scientific & Engineering Research, Volume 6, Issue 2, February-2015 1123
ISSN 2229-5518
[10]. WHO (World Health Organization) (2006). Guidelines for drinking water quality, World Health Organization, Geneva, Switzerland.
[11]. Environmental Conservation Rules (ECR) (1997). “Ministry of Environment and Forest, Government of Bangladesh”.
[13]. Anderws, W.A.; Moore, D. K. and Lepoy, A. C. 1972, A Guide to the study of Environmental Pollution, Perntic- Hall inc. Englewood, Cliffs, N. Jersey, 250 pages, 1972.
[14]. K. Jothivenkatachalam*, A. Nithya And S. Chandra Mohan, “Correlation Analysis Of Drinking Water Quality In And Around Perur Block Of Coimbatore District, Tamil Nadu, India” Rasayan Journal, Vol.3, No.4 , 649-654, 2010.
[15]. Sircus, M. (2011) ‘Water alkalinity and pH’, available in IMVA Website.
[16]. Anderson, K. E. Water Well Hand Book, Missouri Water Drillers Association, 1966. USA. 205-217 pages. J. Environ. Sci. & Natural Resources, 5(2) : 275 - 280, 2012.
[17]. Hakanson, L. “An ecological risk index for aquatic
pollution control”. A sediment logical approach. Water Res.
14, 975-1001 pages, 1990.
IJSER © 2015 http://www.ijser.org