International Journal of Scientific & Engineering Research, Volume 4, Issue 6, June 2013
ISSN 2229-5518
2427
Assessment of Usable Groundwater Reserve in
Northern Kuwait
M. Al-Senafy, A. Fadlelmawla, H. Bhandary, A. Al-Khalid
T. Rashid, K. Al-Fahad, and B. Al-Salman
Abstract - As the need for secured strategic water reserves for emergencies became increasingly pressing, smaller accumulations of usable water that are spread over north Kuwait stood out as one of the most viable options. Having said that, in order to evaluate the potential of this resource, there is an obvious need for better knowledge of the spatial distribution of these waters as well as their recharge rate. To satisfy this need, this study was conducted to delineate these usable water accumulations and quantifying their replenishment rate. A total of 17 wells were drilled to provide a three dimensional description of groundwater salinity. The locations of these wells were determined using criteria that consider available data, hydraulic accessibility to the groundwater, and high runoff locations. The wells, which were designed to enable profiling groundwater salinity of the top 30m, have been logged using gamma and resistivity borehole logger. Additionally, and to increase the resolution of the data, a total of 48 TDEM soundings were conducted. Combining these measurements, four maps of salinity distributions at depth intervals of 0-15, 0-30, 15-30 m and more than 30m have been produced. The maps confirm the presence of sizable volumes of usable groundwater beneath the drainage channels. Using Arc-GIS, this volume was estimated at ≈125 x
109 m3. Recharge was estimated at the regional scale using hydrological modeling. The model estimated the average annual recharge, for the period of
2000-2009, to the groundwater of the whole northern watersheds at 3.2 x 10⁸ m3 (1.8 x 10⁸ for the north watershed and 1.5 x 10⁸ for the central watershed), which is equivalent to ≈ 4.8 mm/yr. This estimate is in good agreement with published recharge estimates (3-6 mm/yr) in other arid areas. To provide point estimates of the recharge, groundwater hydrographs were constructed. According to these hydrographs, recharge averaged 12.5 mm/yr. On the other hand, recharge point estimates ranged very widely between averages of 1.25 mm at the watersheds and 25 mm at the depressions. Based on these results it is recommended to investigate the potential of this reserve further by evaluating the economical feasibility of utilizing this resource. Such investigations will require, among other studies, a numerical modeling study to determine the volumes that are actually recoverable from this reserve under various scenarios.
Index Terms - Remote sensing, recharge, Arc-GIS, Strategic reserve, Chloride balance, salinity, watersheds.
The acute lack of natural water resources of the country has created a unique water sector in Kuwait, that is, about 90% of the potable water production is coming from the unconventional resource of seawater desalination. Although this unusual situation has been maintained for decades and probably will continue into the foreseeable future, the complete dependence on a highly industrialized source for freshwater has serious drawbacks, one of which is the lack of secured strategic water reserve. As such, the usable water accumulation in northern Kuwait stands out as a potential sizable emergency reserve.
The infiltration of the rainwater/runoff from the
occasional rainstorms of Kuwait is known to produce
freshwater lenses in the natural depressions of northern
Kuwait [1]. Nonetheless, freshwater accumulations are not
confined to the depressions, but extend however in lesser volumes, to the formations underlying the wadis that carry the surface base flows. During the early exploration efforts, potential usable water accumulations, i.e., total dissolved solids (TDS) <5000 mg/l, of different volumes have been reported in many parts of northern Kuwait (Parsons, 1964). While the main two depressions (Raudhatain and Umm Al- Aish) have been evaluated extensively, most of the other identified/potential usable water accumulations have been given next to no attention. This was mainly due to their irrelevance in the pursuit of freshwater bodies large enough for economical exploitation. However, in the context of
securing a strategic emergency reserve for the country, these relatively smaller accumulations are significant assets. The lack of information on the location, extent and TDS content of these accumulations as well as the recharge rates to the watershed are deficiencies that prevent preparation of emergency utilization plans for these resources. In this context to address these deficiencies, this study was conducted with the overall aim of exploring the potential of the shallow groundwater resources in northern Kuwait.
To fulfill its objectives, this study utilized many tools and methodologies that include geographical information systems (GIS) mapping and overlaying as well as interpolation capabilities, remote sensing, wells drilling, infiltration tests, standard penetration tests, hydrological modeling, borehole logging, time domain electromagnetic (TDEM) soundings, isotopic tracers, and groundwater hydrographs.
The remotely sensed digital elevation model (DEM)
was used to decipher the drainage network of the northern watersheds, which in turn was used to allocate the locations of high potential for recharge. These locations overlaid by the distribution of the hydraulic accessibility of the aquifer as determined by the depth, recharge, aquifer material, soil type, topography, impact of unsaturated zone and hydraulic Conductivity (DRASTIC) method, have
IJSER © 2013 http://www.ijser.org
International Journal of Scientific & Engineering Research, Volume 4, Issue 6, June 2013
ISSN 2229-5518
2428
provided the most probable locations for recharge; hence, drilling locations were selected.
A total of 17 wells were drilled according to the identified locations. These wells were designed to provide information on the salinity of the profile at the top 30 m of the aquifer. This was achieved by making sure that top of the 30-m screen was allocated at the top the water table. This setup ensured minimal vertical mixing within the well, which enabled measuring salinity at different depths using a multi-probe.
To have a better coverage of the study area, TDEM
soundings were utilized. A total of 48 soundings at 24
locations were conducted. The soundings provided
reasonable information on the lithology of the unsaturated
zone, however, the water table was not allocated due to the presence of low resistivity layers close to the water table that resulted in weakening the signal, on one hand, and the inability to distinguish between this layer, the water table on the other hand. Nonetheless, the TDEM provided lumped salinity estimates for the top 30 m of the groundwater. However, the uncertainty of these salinities was estimated at 50%.
A total of 17 wells were completed in the study area. The top of all wells' screens were located at a maximum of 5 m below the water table with the majority of the screens starting above the water table. This setup was necessary to prevent vertical mixing of groundwater within the casing, which usually takes place when a significant portion of the casing is below the groundwater table. Preventing vertical mixing is very important for measuring the vertical stratification of the TDS in the groundwater.
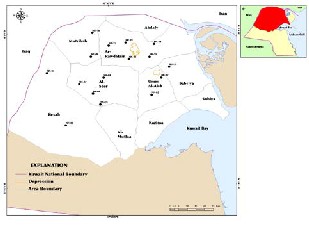
The installed wells were distributed over the study area as
per the criteria described in the methodology section. Fig. 1
shows the locations of the installed wells after taking into
consideration the on-site constraints. The figure shows that the majority of the wells (NK 1, 5, 6, 7, 8, 12, 13, 15 and 17) were distributed over the main watershed in fulfillment of the first criteria of targeting potential recharge locations. Also in fulfillment of the same criteria, wells NK 2, 3, 4, 14 and 16 were allocated in secondary watersheds. On the other hand, the rest of the wells NK 9, 10 and 11 are distributed north of the main watershed to provide information on the extent of the usable groundwater. The areas south of the main watershed were not covered by the NK wells, because they were well covered by wells from previous works.
The relationship between water resistivity, conductivity and salinity were derived from the hydrochemical
Fig. 1. Locations of the monitoring wells as determined by hydrological criteria and land use
analyses of the NK-wells and the existing wells at the Raudhatain and Umm Al-Aish depressions (Fig. 2). This relationship was used to calculate the salinity in TDS on the basis of the water conductivity determined by the TDEM sounding and the Archie equation [2]. Given the ambient groundwater temperatures in the wells of around 29oC, conductivities and resistivity in field conditions were 9% higher and lower, respectively, according to the correction by Jorgensen. Water resistivity vary from 0.7 to 15 Ohm; conductivities from 18000 to 500 µS/cm. Previous studies give little information on resistivity of the Dibdibba Formation. Porosities reported for the sands of the Fars Formation by [3] which are also part of the Kuwait Group aquifer near Kuwait city, varying from 16 to 33% due to cementation by calcite or gypsum. The Dibdibba sand and gravel layers in the Jal Az-Zor escarpment are cemented mainly by gypsum [4]. The consolidated and impermeable nature of the gatch layer at shallow depths reported by many authors indicated that porosities may even be lower than 16%. Based on KISR’s borehole logs and KISR’s water quality measurements, it was concluded that porosities in the formations of the Kuwait aquifer may range from 10 to
40%, even within small ranges of depths. Given the nature
of the cemented and non cemented sands and gravels,
values of 0.88 and 1.37 are attributed to constants a and m in the Archie equation. Formation factors of these materials are expected to vary between 21 and 3.1, respectively. [5] carried out vertical electric soundings (VES) soundings in the Umm Al-Aish depression. From this study, formation factors varying between 3.1 and 3.5 can be derived for the shallow fresh groundwater bearing sands in the Upper Dibdibba formation. These figures are indicative for unconsolidated clean sand or gravels with relatively high porosities. The cementation factor with the formation resistivity from the borehole logs and the water resistivity was calculated from the chemical analysis in the saturated zone and was assumed cementation with gypsum in the
IJSER © 2013 http://www.ijser.org
International Journal of Scientific & Engineering Research, Volume 4, Issue 6, June 2013
ISSN 2229-5518
2429
unsaturated zone (outside the depressions), because of the low resistivity in the logs and TDEM soundings. Given the range of values for water salinity and porosity, resistivity of formations with brackish groundwater (1500 mg/l < TDS
<12000 mg/l) may vary from 3 to 80 Ohm (from salinity
water resistivity can be calculated and then from porosity,
formation resistivity). The formations with fresh
groundwater in the depressions may vary between 12 and
300 Ohm. The resistivity of the unsaturated zone are difficult to determine, but are generally an order of magnitude higher than the resistivity of the saturated zone. They vary with the degree of cementation, clay content and moisture content (in the unsaturated zone or due to local perched water tables).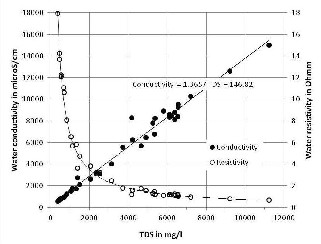
Fig. 2. Relation between TDS and water electrical conductivity of groundwater in northern Kuwait.
Zoning of the sediments in the study area, based on megascopic investigations of the drill cuttings samples, indicated the occurrence of six sediment types within the drilled sequence of Kuwait Group aquifer within the study area. These were identified on the basis of the relative abundance of gravel, sand and mud following Folk's classification [6]. They are sand, gravely sand, sandy gravel, muddy sand, mud and calcareous sandstone. It is believed that the gravely and coarse sandy clastics in the Dibdibba Formation were deposited during severe floods, and the muddy and fine sands layers were deposited under low flow conditions [7]. Gravely sand which consists of about
40% gravel and 60% coarse sand were the most dominant deposit within the drilled sites. These are massive friable grayish to pale brownish coarse sand and granular gravel size. Slight to partial stages of cementation by calcium carbonates were identified within the drilled sequence. The mud horizons exist, almost exclusively in the southern parts of the study area. Moreover, stages of certification and dolomitization were observed in the upper few meters
of the sequence at the western border of the study area. Due to the heterogeneity of the penetrated sediments and the nature of the drill cutting samples, the differentiation between the upper and the lower Dibdibba was not possible.
In total, eight boreholes were logged with a combined gamma ray-dual induction conductivity probe. The main purpose of these loggings was to provide calibration points for the interpretation of the TDEM soundings. The unsaturated zone showed resistivity varying between 3 and
300 Ohm. High resistivity in this zone are generally well in
line with the lithological descriptions provided by the drill
cuttings, which shows that low moisture sand is dominant.
Low resistivity, on the other hand, were less obvious. The
limited presence of clay, as indicated by high gamma count,
does not run synchronic with the low resistivity zones which rules out the classical interpretation of associating the low resistivity with clay particles. Alternatively, these low resistivity layers are probably sand and gravel layers densely cemented with gypsum, as most of the core cuttings show calcareous sand and gravel layers. The resistivity of gypsum is highly dependent on its moisture content. Dry gypsum can have resistivity up to 1000 ohm, while moist and swollen gypsum can go down below 10 ohm. This layer had been reported before [8] and is locally known as gatch. The presence and spatial distribution of this layer is of great hydrological significance as it allows little flush-through by percolating water in the unsaturated zone and probably indicative of conditions with little or no recharge at all. Special attention was given to mapping the spatial extent to this layer using the TDEM. The saturated zone was visible in resistivity logs in those parts where the resistivity appeared to be relatively consistent. These resistivity, combined with the salinity values within the vicinity of these wells, confirmed a poor cementation of the sediment. The logs also confirmed the relatively low contrast in resistivity just above and below the water table. This fact, along with the large range of resistivity values and resistivity contrasts above the groundwater table, complicated the distinction of the water table using the TDEM. In total, 48 TDEM soundings at 26 different locations were carried out. The allocation of the soundings was aimed at covering the areas between the borehole loggings and providing profiles/cross sections of the study area lithology.
Generally, groundwater in the study area are from two origins; the regional brackish to saline groundwater originating from Saudi Arabia, topped by fresh locally percolated rainwater. The analyses in Fig. 3 show that relatively fresh groundwater with TDS < 2000 mg/l, which
IJSER © 2013 http://www.ijser.org
International Journal of Scientific & Engineering Research, Volume 4, Issue 6, June 2013
ISSN 2229-5518
2430
is mostly within the depressions immediate vicinity, is dominated by sulphate. More mineralized groundwater has about equal quantities of chloride and sulphate. The dominant cations are sodium and calcium (Fig. 4). The groundwater in the Kuwait group aquifer outside the depressions which generally of higher salinity is dominated by the brackish to saline groundwater of the distant origin in Saudi Arabia. The salts in this groundwater is derived from the dissolution of the rock/formation matrix salts along the flow path towards northern Kuwait. The salts consist of the gypsum and calcite in the cemented sands and gravels in the Kuwait aquifer. The literature suggests two origins for the sulphate in the gypcretes and groundwater of the Kuwait aquifer (1) dust blown from the coastal sabkha deposits [9] and [10] and (2) dissolution and upward transport of gypsum from deeper layers [4].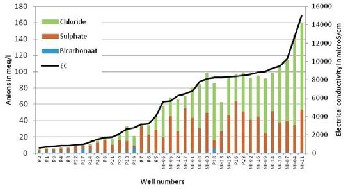
Fig. 3. Analyses of anions and electrical conductivity of groundwater samples. Samples are from wells in northern Kuwait.
parameters, ranged widely from the freshwater quality close to 370 mg/l to 11225 mg/l with an average concentration of 3870 mg/l. The sulfate concentrations ranged widely between 70 and 3000 mg/l with an average concentration of 1220 mg/l. The rest of the dissolved solids have statistics as follows: calcium ranged between 14.4 and
1200 mg/l with an average value of 382 mg/l; chloride
ranged between 16 and 3925 mg/l with a mean value of
1113 mg/l; sodium ranged between 45 and 2290 mg/l with a mean value of 834 mg/l; magnesium ranged between 1.2 and 391 mg/l with a mean value of 75. The maximum concentration for nitrate was 67 mg/l; while, the minimum concentration was 6.6 mg/l. No carbonates were detected in these samples, whereas bicarbonate varied between 53 and 381 mg/l with average value of 120 mg/l. The mean value for nitrate was 27.5 mg/l. The pH varied between 6.5 and 8.2 with an average value of 7.4.
Out of these parameters, nitrate seemed to be the most significant. This parameter was notably elevated with an
average of ≈25 mg/l that ranges above the drinking water standards, which may limit the potential of utilizing these waters. Naturally elevated nitrate in Kuwait's groundwater had been reported before [11], [12] and was attributed to the Kuwait group rock matrix. Comparison between the average nitrate in the groundwater of the old wells to the newly drilled wells would show that the new wells had about 1.5 times higher than the existing wells. This could be a result of the higher rate of fresh recharge to the Raudhatain/Umm Al-Aish vicinity, which dilutes the nitrate concentration. It is also noteworthy to mention that particularly elevated nitrate concentration was reported [13] in the vicinities of oil pits that were used in firefighting after the first Gulf War.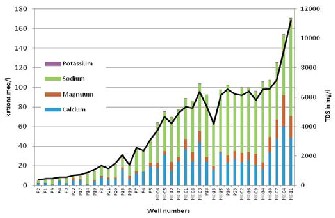
Fig. 4. Analyses of cations and TDS of groundwater samples.
Samples are from wells in northern Kuwait.
Table 1 shows the descriptive statistics of the chemical analysis results of the collected groundwater samples from the existing wells and newly drilled wells. The water types found in the study area are Na-SO4, Na-Cl, Na- HCO3, Ca- Cl, Ca-HCO3 and Ca-SO4. The TDS which may be considered as a collective indicator of the aforementioned
TABLE 1
DESCRIPTIVE STATISTICS OF GROUNDWATER WELLS SAMPLES
IJSER © 2013 http://www.ijser.org
International Journal of Scientific & Engineering Research, Volume 4, Issue 6, June 2013
ISSN 2229-5518
2431
The seventeen drilled wells were equipped with 30 m long screens, though, this is an unusual setup for non- production wells, long screens enabled the utilization of a multi-probe for profiling the salinity of the groundwater over the screen length. The produced profiles, though may suffer of some mixing within the well, show a clear trend of increased salinity with depth indicating the validity of the concept. The data produced by the multi-probe were utilized to produce depth-specific groundwater salinity maps. The multi-probe data were preferred over the laboratory analyzed samples due to (1) it is depth specific, which enables better reserve calculations, and (2) it represents the least fresh period (i.e., September) for the groundwater, which ensures a safety margin in the utilization plans. In addition to the direct measurements of salinity via the available wells, TDEM soundings along the profiles were interpreted to produce additional information on the groundwater salinity in the study area. The obtained data along with the previously existing data were mapped as contour lines representing the groundwater salinity over depth. Fig. 5 presents the contour map for the groundwater salinity at the study area averaged over the depth of 0 to 15 m below water table. The figure clearly shows the presence of fresher groundwater beneath the drainage network extending from the south- western corner of the study area to the depressions of Raudhatain and Umm Al-Aish. Although this observation was suggested before, it remained a hypothesis with this map representing the first data that confirms such a hypothesis. Nevertheless, there are uncertainties associated with this map. More specifically, two sources of uncertainties such as the use of old data was necessary to cover the area (i.e., these data were produced from wells that are no longer functional), although the accuracy of these data were never questioned, the fact that these information is, in some cases, more than
30 yr old suggests that water quality may have changed
over this long period of time, and despite the tremendous
reduction in gaps after drilling the new wells, some significant gaps would have remained between the data points, especially northeast of the study area. Despite these uncertainties, it is believed that this map remains reasonably accurate based on the arguments as follows: the pattern of freshness is in line with the potential recharge areas as identified by the density of the drainage channel, with the processes that may impact the salinity of the groundwater overtime are limited to change in recharge and dissolution of salts from the formation matrix, this is a very long process that operates at totally different time scale than the time residence of the groundwater within the study area, the TDS values are not expected to change significantly over the last 30 yr, and under the undisturbed groundwater conditions, which is the case in the remote areas where the coverage gaps occur, the spatial correlation of salinity is high thereby, reducing the uncertainty
stemming from interpolation. The other depth intervals (i.e., 15-30 m and deeper than 30 m), on the other hand, had significantly less data points, which makes the interpolation over the entire study area suffer unacceptable level of uncertainty. As such, interpolation of the available data points was confined to the immediate vicinities of the data points. As one would expect, the figures are showing higher salinity with increasing depth. Nonetheless, Fig. 6 also reveals that there is a potential of usable waters (i.e., less than 5000 mg/l TDS) at the depth of 15-30 m extending beneath the drainage channel. Fig. 7 shows significant fresh water than what is expected at the south western corner of the study area.
Fig. 5. Spatial distribution of groundwater salinity for depth range of
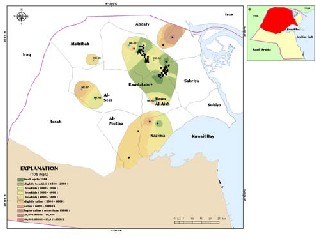
0-15 m below water table.
Fig. 6. Localized interpolation of the available groundwater salinity data at depth 15 to 30 m below water table.
IJSER © 2013 http://www.ijser.org
International Journal of Scientific & Engineering Research, Volume 4, Issue 6, June 2013
ISSN 2229-5518
2432
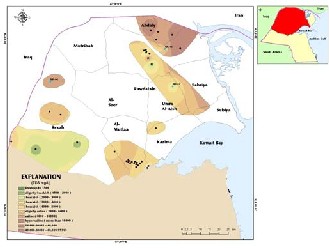
Fig. 7. Localized interpolation of the available groundwater salinity data at depth deeper than 30 m below water table.
Recharge to the groundwater in the study area, with the exception of the main depressions and their immediate vicinity, has been considered negligible. However, the evidence produced from the isotopic analysis of the groundwater shows that recharge is indeed taking place at the watershed scale. Fig. 8 is the isotopic ratio of groundwater 18O and 2H. The figure also shows the range for modern water. A wide range of ratios are observed on the figure indicating different water sources and different levels of mixing between these sources. These sources are essentially, the regional brackish/saline groundwater, which is originating from Saudi Arabia, and the local recharge from rainfall. The wide range of the isotopic ratio is a reflection of the various recharge rates at the study area.
Fig. 8. The wide range of 2H/18O isotopic ratios that, in turn indicates the wide range of mixing between regional and recharge waters.
Fig. 9 shows a comparison between salinity measurements at the end of the dry season (during September 2010) and in the middle of the rainy season (January 2011). The results show that the dry season salinities are, on the average,
≈25% higher than the rainy season with a standard
deviation of ≈5%. This quality change is important to be
taken into consideration if this water reserve is to be
utilized for emergency purposes.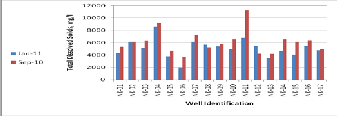
Fig. 9. Seasonal salinity variations.
A catchment-based, continuous, semi distributed hydrologic model had been used to quantify the spatial and temporal distribution of surface runoff and potential groundwater recharge. The model used was a modified (SWAT) that provides a continuous simulation of the overland flow, channel flow, transmission losses, evaporation on bare soils and (ET) on vegetated canopy, and potential recharge to the shallow alluvial aquifers [14] and [15]. With the exception of infiltration rates, the SWAT model was set up using data generated from remote sensing datasets. The model sensitivity towards field measured versus remotely sensed parameters was tested by conducting two runs as follows: with infiltration rates based on the standard for the desert sand with paleo- drainage, and based on a set of field-measured infiltration rates. The results of the two runs are presented in Table 11 and 12, respectively. It was observed that the model in the northern watershed after incorporation of infiltration values showed a slight reduction in recharge quantities for the year 2009 indicating that the recharge was 22.36% less than computed from the initial run, and the net recharge of
2000-2009 was underestimated by 2.49%. This high
variation in for year 2009 could be because of the fact that
the precipitation quantity was very low and under that
condition, the bulk of the precipitation was runoff and
transmission loss due to difference in the assumed filtration
rate and the measured filtration rate in the area. The assumed filtration rates were based on average rate of 40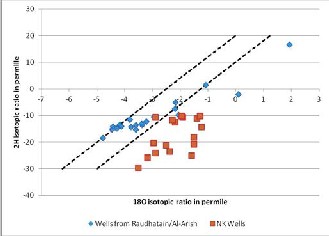
IJSER © 2013 http://www.ijser.org
International Journal of Scientific & Engineering Research, Volume 4, Issue 6, June 2013
ISSN 2229-5518
2433
cm/h in paleo-drainages while the measured rates were in
15 to 25-cm/h range.
TABLE 2
MODEL RESULTS BASED ON STANDARD PARAMETERIZATION OF
SWAT MODEL WITHOUT MEASURED INFILTRATION VALUES
![]()
Northern Area in km2 3696.4![]()
Annual (2009) (in Total (2000-2009) Precipitation 266840504.10 4521953976.00
Surface Runoff 200120378.10 3346245942.00
Transmission loss 52033898.30 993925483.90
Aquifer recharge 14676227.73 181782549.80![]()
Central Watershed Area in km2 2612.7![]()
Annual (2009) (in Total (2000-2009) Precipitation 154175427.00 3196220418.00
Surface Runoff 114089816.00 2365203109.00
Transmission loss 32114741.44 684310791.50
Aquifer recharge 7970869.58 146706517.20![]()
TABLE 3
MODEL RESULTS BASED ON STANDARD PARAMETERIZATION OF
SWAT MODEL
WITH MEASURED INFILTRATION VALUES
![]()
Northern Area in km2 3696.4
Annual (2009) (in Total (2000-2009) (in![]()
Precipitation 266840504.10 4521953976.00
Surface Runoff 199596697.10 3377899620.00
Transmission loss 55849717.51 966793760.10
Aquifer recharge 11394089.53 177260595.90![]()
Central Watershed Area in km2 2612.7
Annual (2009) (in Total (2000-2009) (in![]()
Precipitation 154175427.00 3196220418.00
Surface Runoff 115323219.40 2387576652.00
Transmission loss 32268916.87 683351925.40
Aquifer recharge 6583290.73 125291840.60![]()
In the case of the central watershed, the model after incorporation of infiltration values showed a decrease in recharge of about 17.41% for year 2009 and an underestimation of 14.60% for the period 2000-2009. This larger change in recharge value could be attributed to the same reasoning as for northern watershed. However, the decadal long values showed a lower estimate because the infiltration rates in this area changed from assumed values of 40 to 5-15 cm/h. The net recharge in the northern watershed had been estimated as 3.08 mm for year 2009
and an average recharge of 4.795 mm/yr during the period
2000-2009. The recharge to the central watershed during
year 2009 was estimated at 2.520 mm and the average
annual recharge in the central watershed during the period
2000-2009 was 4.795 mm. These recharge values correlate
well with the 3-6 mm/yr recharge estimated for similar
hydrological settings in Saudi Arabia ([16], [17], [18], [19],
and [20]) The conclusion of the model suggested that the
average recharge in the watershed was between 3-5% of the total precipitation, with the precondition that no recharge was possible with precipitation less than 50 mm. The estimated recharge values are in line with the observations made by [21] who suggested recharge to shallow aquifers at
3-4% of the precipitation under similar hydrographic and
climatic settings. [22] estimated recharge in Al-Aqia, Khurais, Wijj, Turabah, Abha and Jizan wadi systems and suggested that recharge rates to these aquifers ranged from
0.4 to 7% of average annual rainfall. They argued that this large variation in recharge rates is mainly due to rainfall
variation and intensity, aquifer properties and climatic conditions. These observations are similar to the observations made during this study. In case of higher rainfall, the recharge can reach up to 8-10% ([23]; [24]). This quantity is possible if there are heavy rain events that are closely spaced.
Localized Recharge Estimates. In addition to the efforts
made in estimating the recharge at the regional scale,
localized recharge estimations, as well, have been given
their due attention. The fact that recharge is a very spatially
heterogeneous process necessitating point estimations of
the recharge for localized groundwater utilization schemes. For such a purpose, two methods were applied: (1) volumetric computation based on water level fluctuations, (2) chloride profiling and (3) chloride mass balance.In applying the water level fluctuations method, a total of eight loggers were installed in the wells. A season long data from these loggers along with existing data from Al- Raudhatain and Umm Al-Aish were used to produce hydrographs of the groundwater.
Two main trends are easily observable in the hydrographs:
(1) the hydrographs show significant short time periods water level oscillations, and (2) an overall seasonal trend of increasing during the rainy season followed by decreasing towards the end of the season (Figs. 10 and 11).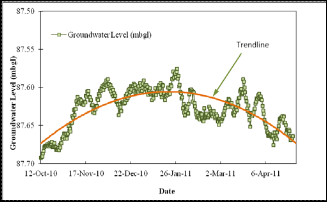
IJSER © 2013 http://www.ijser.org
International Journal of Scientific & Engineering Research, Volume 4, Issue 6, June 2013
ISSN 2229-5518
2434
Fig. 10. An example of the hydr0ographs produced by the loggers and used to estimate recharge.
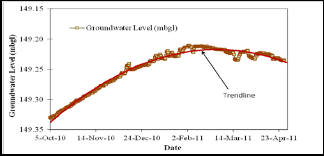
Fig. 11. Hydrograph for well NK-3 where practically no effects are observed from pumping.
The complete dependence of Kuwait on highly industrialized water resource, i.e., desalination, for its domestic water is raising concerns about the consequences of shutdowns in the desalination plants due to technical problems, environmental pollution, or even sabotage. The fact that Kuwait has very little storage capability makes these concerns even more pressing. One potential source for increasing such a reserve is the usable groundwater (TDS<5000 mg/l) that are potentially existing under the watersheds of north Kuwait. For such waters to be considered as a reserve, much more information is needed. To cover this knowledge gap, this study was conducted to provide data on the presence of this water, their distribution and replenishment rates.
To fulfill its objectives, this study utilized many tools and methodologies that include the following:
drilling locations were selected. A total of 17 wells were drilled according to the identified locations. These wells were designed to provide information on the salinity profile of the top 30 m of the aquifer. That was achieved by making sure that the top of the 30-m screen was allocated at the top of the water table. This setup ensured minimal vertical mixing within the well, which enabled measuring salinity at different depths using a multi-probe. To enhance the density of the information over the study area, TDEM soundings were utilized. A total of 48 soundings at 24 locations were conducted. The soundings provided reasonable information on the lithology of the unsaturated zone but was not able to allocate the water table due to the presence of low resistivity layers close to the water table that weakened the signal, on one hand, and the inability to distinguish between these layers of the water table. Nonetheless, the TDEM provided lumped salinity estimates for the top 30 m of the groundwater. However, the uncertainty of these salinities was estimated at 50%. Spatial groundwater salinity distribution maps were produced for the intervals of 0-15, 15-30 and 0-30 m below the groundwater table. The maps generally showed a clear trend of fresher groundwater beneath the drainage network that extends from the southwestern corner of the study area (Wadi Al-Batin) to the depressions of Raudhatain and Um Al-Aish. Based on these maps, and using GIS capabilities, the usable water (less than 5000 mg/l TDS) volumes at the study area was estimated at ≈39 x 109 m3. The hypothesis of rechargeable groundwater away from the depressions of Raudhatain and Umm Al-Aish was confirmed by the presence of fresher groundwater beneath the drainage network as well as the evidence provided by the isotopic ratio of 18O and 2H. Recharge was estimated at the regional scale using hydrological modeling. The model used was a modified (SWAT). The model was based mostly on remotely sensed data with heavy dependence on the data from the ASTER satellite. The model estimated the annual recharge to the groundwater of the whole northern
− GIS mapping, overlaying and interpolation
watersheds at 3.2 x 10⁸
m3 (1.8 x 10⁸
for the north watershed
and 1.5 x 10⁸
for the central watershed). These estimates are
capabilities
− Remote sensing
− wells drilling
− infiltration tests
− standard penetration tests
− hydrological modeling
− borehole logging
− TDEM soundings
− isotopic tracers
− groundwater hydrographs
The remotely sensed Digital Elevation Model (DEM) was used to decipher the drainage network of the northern watersheds, which in turn, was used to allocate the locations of high potential for recharge. These locations overlaid by the distribution of the hydraulic accessibility of the aquifer as determined by the DRASTIC method, have provided the most probable locations for recharge; hence,
in good agreement with published recharge estimates (i.e., per m2) in other arid areas. As the SWAT model produces only overall recharge values for the watershed, it was necessary to provide point estimates of the recharge to give an impression on the distribution of recharge estimates made by the SWAT model. For this purpose, groundwater hydrographs were prepared using data from loggers installed in six wells. Based on a season-long water level fluctuations and an average specific yield of 0.15, the recharge estimate ranged between 12 and 15 mm with an average of 12.5 mm/yr. This rather high estimate, i.e., compared to watershed average of 4.8 mm/yr obtained from hydrological modeling, was attributed to the fact that the wells where recharge was estimated are carefully allocated in the locations where the highest recharge is expected. Localized recharge was also estimated using the chloride balance method. The results show a clear
IJSER © 2013 http://www.ijser.org
International Journal of Scientific & Engineering Research, Volume 4, Issue 6, June 2013
ISSN 2229-5518
2435
distinction between the recharge estimates of the north Kuwait wells that are distributed over the watersheds and those of the P wells that practically all of them are in or within the vicinity of the main depressions. The earlier averaged 1.24 mm whereas the latter averaged 25.7 mm. It is concluded that the chloride balance method is underestimating the recharge for the watershed wells due to the inability to collect samples that are not affected by mixing with the regional groundwater, which has high chloride concentrations. Recharge estimates within the main depressions and their vicinities, on the other hand, though much higher than rest of the study area remain justifiable by the fact that this recharge is inclusive of vast areas of the watershed that drains to the depressions. Hence, it is not unlikely to be several folds of recharge at the wadis. Based on the aforementioned results, the northern watersheds do have significant volumes of groundwater with salinity levels that may be considered as usable (less than 5000 mg/l) during emergency conditions. Accordingly, the main recommendation of this study is to consider these waters as a potential water reserve for Kuwait. This implies the necessity of the following:
− Conducting further studies to further investigate the potential of this reserve. Such investigations should include additional detailing of the resource and its potential through hydrological assessment. More specifically, up-scaling of the estimated recharge value to the basin scale. For this purpose, the international trend in this regard is to utilize GIS capabilities to establish statistical correlations between the point estimates of the recharge and the different features of the basin/aquifer (i.e., soil, topography, depth to groundwater, material of the unsaturated zone, etc.) to enable regionalizing the point estimates of recharge.
− These recharge estimates should be supported by a study on the impacts of the global climatic changes on the precipitation rates at the study area. This study should utilize Global Climate Models to predict the futuristic precipitation rates as well as downscaling techniques to bring down these predictions to basin scale. Hydrological modeling will be also needed in this study.
− Studying the dynamics of groundwater flow and solute transport at the northern watersheds using suitable numerical modeling package. The output of this study would be a set of production schemes (i.e., location of wells, depths of production zones and rate of production) according to sustainable production or reserve mining utilization scenarios. This exercise will provide the volumes of recoverable groundwater and their quality.
− Conceptual engineering design and cost estimation of the infrastructure needed for utilization of the resource. Such investigations will include the design and cost estimate of the desalination units
needed if this water is to be utilized as drinking water.
The authors would like to extend their appreciation to the Kuwait Foundation for the Advancement of Sciences (KFAS) for partaking in the funding the project. The unlimited support and encouragement of the Kuwait Institute for Scientific Research (KISR) management was pivotal in carrying out the various tasks of the project and kept the morale of the team at a high level.
[1] Parsons Corporation. 1964. Groundwater Resources of Kuwait. Volumes
I, II and III, Ministry of Electricity and Water, Kuwait.
[2] Archie, G. E. 1950. Introduction to petrophysics of reservoir rocks.
American Association of Petroleum Geologists Bulletin 34(5):943-961.
[3] Mukhopadhyay, A.; A. Al-Haddad; M. Al-Otaibi; and M. Al-Senafy.
2007. Occurrence of hydrogen sulfide in the ground water of Kuwait. Environmental Geology 52(6): 1151-1161.
[4] Al-Bakri D.; W. Kittaneh; and W. Shublaq. 1988. Sedimentological Characteristics of the Surficial Deposits of the Jal Az-Zor Area, Kuwait. Sediment. Geol. 59: 295-306.
[5] Al-Ruwaih, F. and A. Omer. 1986. Resistivity measurements for groundwater investigation in the Umm Al-aish area of northern Kuwait. Journal of Hydrology 88:185-198.
[6] Folk, R. 1974. Petrology of Sedimentary Rocks. Austin: Hemphill.
[7] Al-Sulaimi J. S.; A. Amer; N. Saleh; A. S. Salman; J. Ayyash; and M. I. Al-
Sayed. 1988. Delineation of Watersheds in Kuwait and their Geomorphological Characteristics. Kuwait Institute for Scientific Research, Report No. KISR2856, Kuwait.
[8] Kwarteng A.Y.; M. N. Viswanathan; M. N. AlSenafy and T. Rashid.
2000. Formation of fresh ground-water lenses in northern Kuwait. Journal of Arid Environments 46:137-155.
[9] Robinson B. W. and Al Ruwaih F., 1985. The stable-isotope composition
of water and sulfate from the Raudhatain and Umm Al Aish freshwater fields, Kuwait. Chemical Geology (Isotope Gescience Section) 58:129-136.
[10] Al-Sulaimi, J. and A. Mukhopadhyay. 2000. An Overview of the Surface and Near Surface Geology, Geomorphology and Natural Resources of Kuwait. Earth Science Reviews 50:227-267.
[11] Fadlelmawla, A.; K. Hadi; K. Zouari; and K. Kulkarni. 2008.
Hydrogeochemical investigations of recharge and subsequent
salinization processes at Al-Raudhatain depression in Kuwait. Hydrological Sciences Journal 53(1):204-223.
[12] Akber, A.; M. Al-Murad; A. Mukhopadhyay; T. Rashid; H. Al-Qallaf A.
Al-Haddad; H. Bhandary; F. Marzouk and B. Al-Salman. 2009. Long-
term monitoring and remediation strategy for hydrocarbon pollutants in
the groundwater of Raudhatain and Umm Al-Aish Fields. Kuwait
Institute for Scientific Research, Report No. KISR9902, Kuwait.
[13] Mukhopadhyay, A. and M. Al-Otaibi. 2005. Development, analysis and integration of hydrogeological data in Kuwait (WM010C) – Volume 2: Hydrogeological Maps of Kuwait. Kuwait Institute for Scientific Research, Report No. KISR7943, Kuwait.
[14] Arnold J. G. and N. Fohrer. 2005. Current Capabilities and Research
Opportunities in Applied Watershed Modeling. Hydrological Processes
19:563-573.
[15] Arnold J. G.; R. Srinisvan; R. S. Muttiah; and J. R. Williams. 1998. Large Area Hydrologic Modeling and Assessment, Part I: Model Development. Journal of American Water Resource Association 34:73-
89.
[16] BRGM. 1976. Hydrogeological investigation of Al-Wasia Aquifer in the
eastern province of Saudi Arabia, Regional Study. Final Report, Ministry of Agriculture and Water Riyadh, Saudi Arabia.
IJSER © 2013 http://www.ijser.org
International Journal of Scientific & Engineering Research, Volume 4, Issue 6, June 2013
ISSN 2229-5518
2436
[17] Caro R. and P. S. Eagleson. 1981. Estimation recharge due to rainfall.
Journal of Hydrology 53:185-211.
[18] MacDonalds. 1975. Riyadh additional water resources study Ministry of
Water and Agriculture, Riyadh, Saudi Arabia.
[19] Sogreah. 1968. Water and Agricultural Development Survey for Area IV Ministry of Agriculture and Water, Riyadh, Saudi Arabia.
[20] Subyani A. and Sen Z. 1991. Study of recharge outcrop relation of the Wasia Aquifer in Central Saudi Arabia. Journal of King Abdulaziz University (Earth Science) 4:137-147.
[21] Bazuhair A.S. and W. W. Wood. 1996. Chloride mass-balance method for estimating ground-water recharge in arid areas. Example from Saudi Arabia. Journal of Hydrology 186:153-159.
[22] Bazuhair A. S.; M. O. Nassief; M. S. Al-Yamani; M. A. Sharaf; T. H.
Bayumi; and S. Ali. 2002. Groundwater recharge estimation in some
wadi aquifers of the western Saudi Arabia. King Abdulaziz City for
Science and Technology Project No. AT-17-63:Riyadh, Saudi Arabia.
[23] Subyani A. and Sen Z. 2006. Refined chloride mass-balance method and its application. Hydrological Processes 20:4373-4380.
[24] Subyani A.M. 2004. Use of chloride mass-balance and environmental isotopes for evaluation of groundwater recharge in the alluvial aquifer, Wadi Tharad, Western Saudi Arabia. Journal of Environmental Geology
46:741-749.
IJSER © 2013 http://www.ijser.org