The research paper published by IJSER journal is about Appraisal and mapping of soil resources of selected blocks (Hooghly district) in the Bengal basin region of India using GIS and Remote Sensing
ISSN 2229-5518
Appraisal and mapping of soil resources of selected blocks (Hooghly district) in the Bengal basin region of India using GIS and Remote Sensing
Aditi Sarkar, Banasree Kar, Madhurima Das, Pabitra Banik
Abstract— The call of the day is to propagate subsistence agricultural development thereby ensuring adequate food supply for the presen t without compromising the necessities of future generation. To enable this process, the optimum knowledge about the existing land resources i.e., soil resources is essential. This would require the knowledge of soil productivity of the area which reflects the ability of soil to produce crop under a physically defined set of management practices. Along with this information the existing landuse pattern of the area too would give an overview of the farming practices of the region. This is eventually extracted with the help of Remote Sensing. Therefore to assess the soil productivity, its physical, chemical properties along with the climatic conditions too have to be considered. Geographic Information System directs the users to collect, manage, analyse and retrieve these spatially referenced data that have been collected from various sources. In the present study an attempt has been undertaken to assess the soil resources for a few administrative blocks of Hooghly district which is a typical region belonging to the Bengal basin of India and to establish how the assessme nt could be accomplished by applying the latest technologies like GIS and Remote Sensing in managing and mapping soil resources .
Index Terms— actual soil productivity, co-efficient of improvement, landuse-land cover, natural resource management, potential soil productivity, Riquier Index.
—————————— ——————————
T The growing pressure of population coupled with an in-
creasing demand being made on land resources has created enormous pressure on the available natural resources of the country. As a result, the productivity of the land is declining and the country cannot produce as much food as needed for the increasing population. Soil resources are considered to be one of the most important and dynamic natural resources for analysis of land productivity in general. Assessment of soil resources pertaining to the smallest of the administrative sub- division i.e. Block and categorizing the need for conservation practices would facilitate effective landuse planning process ideal for ensuring stable food supplies and environmentally sustainable agricultural production. Soil productivity reflects the ability of soil to produce crop under a physically defined set of management practices. Therefore, to assess soil produc- tivity, physical & chemical properties of soil, ground water availability, and climatic conditions are considered. In the opinion of S.K.Bhan et al. (1996) the areas of sustainable agri- cultural development has extensive dependency on land
————————————————
![]() Author: Aditi Sarkar is currently pursuing PhD program from Jadavpur University and is a Project Linked Personnel at Indian Statistical Institute, India, Ph: +9830621995. E-mail: aditi.iirs@gmail.com
Author: Aditi Sarkar is currently pursuing PhD program from Jadavpur University and is a Project Linked Personnel at Indian Statistical Institute, India, Ph: +9830621995. E-mail: aditi.iirs@gmail.com
![]() Author: Banasree Kar is employed, Kolkata, India. Ph: +9046975507. E-
Author: Banasree Kar is employed, Kolkata, India. Ph: +9046975507. E-
mail: banashree.kar@gmail.com
![]() Author: Madhurima Das is currently Project Assistant at Indian Statistic-
Author: Madhurima Das is currently Project Assistant at Indian Statistic-
al Institute, India, Ph: +9007212305. E-mail: mrima1986@gmail.com
![]() Author: Pabitra Banik is Associate Professor in Indian Statistical Institute, India, PH-03325753226. E-mail: pbanik@isical.ac.in
Author: Pabitra Banik is Associate Professor in Indian Statistical Institute, India, PH-03325753226. E-mail: pbanik@isical.ac.in
productivity. The priority is to meet the needs of mankind without exhausting the existing resources and saving them for future generations. Comprehensive, reliable and timely infor- mation on soil resources is essential for an agriculturally pro- ductive country like India, where agriculture is the mainstay of the national economy.
Managing and analysing huge volumes of spatial data requires the aid of Geographical Information System (GIS) for solving spatial problems. It is a system of hardware and soft- ware that allow the users to collect, manage, analyse and re- trieve huge volume of spatially referenced data collected from
various sources (Aronoff, 1991). GIS is an extremely powerful tool for management and analysis of data for land productiv- ity studies. In order to use the land optimally, information on the existing landuse/ land cover derived by using Remote Sensing technology is required along with the capacity to monitor the dynamics of landuse that are a natural outcome of the changing demands (Shetty et. al., 2005). Landuse/ land cover maps aim to provide information of both the natural features over earth as well as human induced changes over earth that are closely related to the natural features.
The present study exploited the analytical efficiencies of GIS in generating thematic maps on soil productivity. The existing landuse inventory was derived by using the Remote Sensing technique. This study was embarked on with an en- deavour to create digital soil database and to investigate soil productivity through assessment of Actual and Potential Soil Productivity and measure the Co-efficient of Improvement of soil to improve the productivity and finally analyse the soil productivity in relation to landuse/ land cover.
IJSER © 2012
The research paper published by IJSER journal is about Appraisal and mapping of soil resources of selected blocks (Hooghly district) in the Bengal basin region of India using GIS and Remote Sensing 2
ISSN 2229-5518
As The area of interest (Four blocks viz. Dhaniakhali, Polba, Pandua, Balagarh) is located in Hooghly district of West Ben- gal, India. The area lies between 87º57’55.05”E to 88º21’29”E longitude and 22º52’21.15” N to 23º06’39.22” N latitude. The total areal extent of 1064.75 sq km was covered in the study. The region is a flat, fertile stretch of land, made of layers of alluvial soil. The area provides a huge receptacle into which thousands of meters of thick layers of sediments have been deposited to form a wide valley plain consisting of alluvial formation and is a vast flat depositional surface at an elevation below 300 meters. The area comprises of low-lying alluvial plains with riverine aggregates and marshes. They occupy the lower basin areas and are prominent as rich paddy lands. In view of the high rainfall, the rice based cropping system is common. The soils in the area have very high erodibility. Rice and jute are main crops grown under rainfed condition.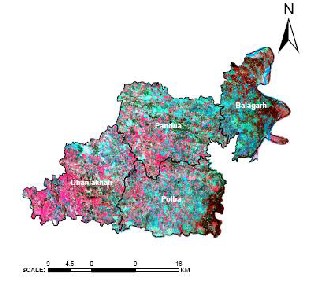
Figure 1: the Study Area vector overlaid on the FCC
The soil physical and chemical data pertaining to the study area were collected from NBSS & LUP. The landuse pattern was derived by classifying the IRS – LISS III Satellite data of Feb, 2009 period covering the study area.
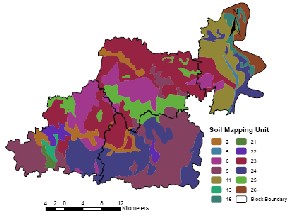
Once the soil characteristic data from NBSS & LUP pertaining to the study area was collected, the Digital Soil Database (Fig
2) pertaining to various aspects of soil of the study area was prepared by digitizing the NBSS & LUP soil map (1:50,000 scale) of the area.
Figure 2: Digital Soil Map
Actual productivity rating:
Actual soil productivity index is a measure of the conditions favourable for plant growth and crop production under good environmental conditions based on soil and site parameters influencing yield. Soil productivity of the study area has been assessed using the Riquier Index model (Riquier, 1974) wherein 8 soil parameters were used in computing the actual productivity index (PI).![]()
Where:
Each factor was rated from 0 – 100 and the actual percentages were multiplied by each other.
Potential productivity rating:
Potential productivity index is a measure of the favourable conditions for plant growth based on the potentialities of the soil and site parameters influencing yield. It is measured to know the scope to modify the actual soil productivity status. In this study a 20% improvement in the soil/site factors like drainage (D), base saturation (N), organic matter (0) and CEC (A) have been incorporated to raise the potentialities of the soil for better and improved productivity.
Co-efficient of Improvement:
Co-efficient of Improvement (CI) has been worked out based on potential productivity and actual productivity.![]()
![]()
![]()
The Co-efficient of Improvement shows the potenti- alities and constraints of a region with regard to its soil re- sources and is a useful tool for any agricultural planning. The higher the ratio, the better are the scopes to modify the pro- ductivity.
IJSER © 2012
The research paper published by IJSER journal is about Appraisal and mapping of soil resources of selected blocks (Hooghly district) in the Bengal basin region of India using GIS and Remote Sensing 3
ISSN 2229-5518
The productivity ratings of soil mapping units were calculated and database was generated in MS-EXCEL. The resultant productivity index was set against a scale placing the soil in one of the five productivity classes. The database was exported to Arc-MAP in text format. The attribute table was joined with the soil vector layer and the actual and potential soil productivity maps were prepared.
A subset from the entire The IRS LISS III February 2009 False Colour Composite imagery was clipped out to obtain the re- quired blocks by clipping it with available block coverage file. The imagery was reprojected to UTM Projection. A supervised classification was performed on the imagery using the Ground Control Points collected as the signatures, to obtain the lan- duse/ land cover.
The resultant productivity index was set against a scale plac- ing the soils in one of the five productivity classes ((Fig 3a and
3b). After affecting all the possible improvement factors, the actual productivity rating was worked out and grades were assigned (Riquier et al., 1970).
Actual soil productivity:
Organic matter was found to be the most limiting factor for crop production in soil mapping units 6, 9, 21, 22, 23, 24 and
25. Soil mapping units 6, 9, 23 and 25 were rated ‘average’ though 21, 22 and 24 were rated ‘poor’ for crop production. The CEC of clay minerals was the second most dominant lim-
iting factor affecting soil mapping units 2, 21 and 26. Whereas drainage condition and base saturation were found to be limit- ing factors for soil mapping unit 2. This soil was rated to be
‘poor’ in terms of soil productivity. As a result the soil map-
ping units 2, 21, 22 and 24 are rated ‘poor’ being affected by
more than one limiting factor.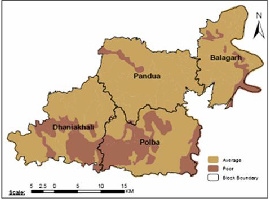
Figure 3a: Actual Soil Productivity Map
Potential soil productivity:
Organic matter was found to be the most limiting factor for crop production for soil mapping unit 6, 9, 21, 22, 23, 24 and
25. By addition of organic matter the potential productivity of soil mapping units 6, 9 and 25 was increased to the status of
‘good’, the potentiality of soil units 21, 22 and 24 was im- proved to ‘average’ and by addition of fertilisers the potential- ity of soil mapping unit 5 was elevated to ‘good’.
Drainage was found to be the most limiting factor for crop production for soil mapping unit 2. By improving the soil drainage condition the potential productivity was increased to the status of ‘average’.
The following groups of required improvement (in addition to current, sound agricultural practices) were con-
ceived:
![]() D (drainage): excess water removal by reclamation, ridging.
D (drainage): excess water removal by reclamation, ridging.
![]() O (organic matter): increase and maintenance of or-
O (organic matter): increase and maintenance of or-
ganic-matter content by manuring, green manuring, crop rotation etc.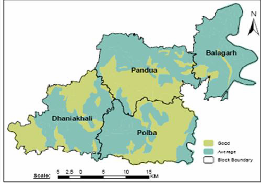
If we consider increasing the organic matter and base satura- tion by 20 % of the actual and improving the drainage system from the previous level to the next level by improving the canal and agricultural practices then actual productivity will leap up to the next level of improved class. Even with all these possible management measures, the productivity class of soil mapping units 11, 13, 15, 23 and 26 were not alleviated to a higher level.
Figure 3b: Potential Soil Productivity Map
IJSER © 2012
The research paper published by IJSER journal is about Appraisal and mapping of soil resources of selected blocks (Hooghly district) in the Bengal basin region of India using GIS and Remote Sensing 4
ISSN 2229-5518
Table 1: Actual and Potential Productivity Ratings and Classes
A Landuse- Land cover map (Fig 4) of the study area was pre- pared. 21.35% of total area was found to be under cultivated land, 0.17% area under shallow water, 59.21% under fallow land, 2.36% area under waterbodies and 15.91% area to be oc- cupied by settlements. The classification accuracy of 66.66% supports the fact that the enhanced data resulted in a moder- ately well classified map.
Table 3: Landuse area statistics
From the actual and potential productivity ratings, the co- efficient of improvement (CI) can be finally calculated. CI is the ratio between potential productivity and actual productiv- ity ratings.![]()
![]()
![]()
The Co-efficient of Improvement shows the potenti- alities and constraints of a region with regard to its soil re- sources and proves to be a useful tool for any agricultural planning. The higher the ratio is the more are the chances to modify soil productivity. But here we can see that except for the soil mapping unit 2 (Baligori series) the CI was very low varying from 1.25 to 1.48. It proves that the area does not have much scope for improvisation of the productivity as the actual productivity of soil is overall average.
Table 2: Co-efficient of Improvement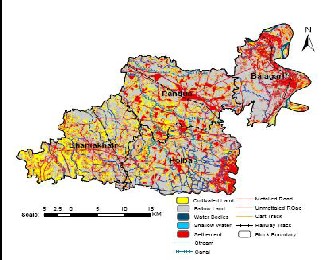
Figure 4: Landuse/ Land Cover Map
An analysis was performed to view the affect of actual productivity on each landuse-landcover class. Nearly 22.10% of total area under poor productivity class has been occupied by settlement, 54.78% under fallow land, 0.12 % under shallow water, 2.80% under deep water and 24.28% under cultivated land. In case of average soil productivity, 2.26% area under deep water, 61.28% under fallow land, 14.23% under settle- ment, 22.04% under cultivated land and 0.19 % under shallow water.
IJSER © 2012
The research paper published by IJSER journal is about Appraisal and mapping of soil resources of selected blocks (Hooghly district) in the Bengal basin region of India using GIS and Remote Sensing 5
ISSN 2229-5518
Table 4: Productivity class based area statistics
[1] Shetty, Amba, Nandagiri, Lakshman, Thokchom, Sangeeta, Rajesh, M.V.S. 2005. Landuse Land Cover Mapping Using Satellite Data for a Forested Watershed, Udupi District, Karnataka State, India. Journal of Indian society of Remote Sensing. 33(2): 233 – 236.
[2] Bhan, S.K., Saha, S.K., Pande, L.M., J.Prasad. 1996. Use of Remote
Sensing & GIS Technology in Sustainable Agricultural Management and Development – Indian Experience
[3] Aronoff, S. 1991. GIS: A management perspective, WDL publications, Ottawa, Canada
[4] Riquier, J. 1974. A summary of parametric methods of soil and land evaluation. In: Approaches to land classification, Soils Bulletin 22 (ed. FAO) FAO, Rome
[5] Riquier, J., Bramo, L. and Cornet, J. P. 1970. A new system of soil appraisal in terms of actual and potential productivity
A wise management with respect to choice of appropriate crops, rotation of crops, and the use of suitable cultural meth- ods can minimize inherent features of soil which normally are unfavourable one. A number of operations can be employed to maintain and enhance the crop producing power of soil. Soils containing excessive water automatically involve adequate aeration, lowering of temperature and limited root range. All these conditions are directly related to seed germination and crop growth, and the insufficiency of air and the reduced tem- perature act against the decomposition of organic matter. The consequent addition of humus to the soil has important effects on the soil texture, structure, micro-organic population and fertility of the soil. Organic matter could be introduced to the soil by green manuring and farmyard manure.
The present study proves that the area does not have
much opportunity for productivity improvisation as the actual
productivity of soil is average. Therefore, judicial use of fertil-
izer along with soil and water conservation measures would
ensure improved soil productivity.
The study confirms the capability of GIS in integrating spatial
and attribute data thereby offering a quick and reliable me-
thod of appraisal of natural resources. The spatial relationship
between different geographically referenced data can be estab-
lished using a GIS. The result depicts the potentialities and constrictions of the study area in respect to its soil resources. This will prove to be a useful device in planning and imple- menting any future agricultural schemes for the area under study.
IJSER © 2012