intestine, however, the submucosa of the appendix contains many masses of lymphoid tissue.
International Journal of Scientific & Engineering Research, Volume 5, Issue 2, February-2014 584
ISSN 2229-5518
Analysis with Integration of Reverse
Engineering & Additive Manufacturing of an Appendix
L.B.Raut, S.R.Jagtap
—————————— —————————
an inner layer of mucosa with submucosa, muscularis, and serosa layers surrounding it. Unlike the rest of the large
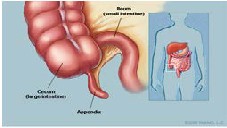
The appendix sits at the junction of the small intestine and large intestine. It’s a thin tube about four inches long. Normally, the appendix sits in the lower right abdomen.
The function of the appendix is unknown. One theory is that the appendix acts as a storehouse for good bacteria, rebooting the digestive system after diarrheal illnesses. Other experts believe the appendix is just a useless remnant from our evolutionary past. Surgical removal of the appendix causes no observable health problems.
Extending from the inferior end of the large intestine’s cecum, the human appendix is a narrow pouch of tissue whose resemblance to a worm inspired its alternate name, vermiform (worm-like) appendix. It is located in the right iliac region of the abdomen (in the lower right-hand abdominal area), measuring about four inches long and roughly a quarter of an inch in diameter.
————————————————
• Prof. L. B. Raut, currently working as ME cocoordinator,In Mechanical Engg. Dept, SVERI’s College of Enginrring Pandharpur, Solapur University, Maharashtra, India. PH-+919637238869. E-mail: lraut@rediffmail.com
Like the rest of the digestive tract, the appendix is made of
intestine, however, the submucosa of the appendix contains many masses of lymphoid tissue.
Fig 1: An appendix in human body
The presence of lymphoid tissue suggests that the appendix may play a role in the immune system in addition to the digestive system.
The appendix is not a vital organ and medical researchers still debate its exact function in our bodies. One hypothesis suggests that it is a vestigial remnant of a once larger cecum. This larger cecum would have been used by vegetarian ancestors to digest cellulose from plants. Supporters of this hypothesis therefore conclude that the appendix no longer serves any purpose for us.
Reverse engineering consists of 3D scanning of an appendix. 3D scanners are used for scanning purpose. With the help of these scanning images CAD model of an appendix is created by using mechanical designing packages. It is in STP, IGES or STL form. Analysis of
IJSER © 2014 http://www.ijser.org
International Journal of Scientific & Engineering Research, Volume 5, Issue 2, February-2014 585
ISSN 2229-5518
appendix is done by importing this file into various analysis packages.
The objective of the current simulation is to perform stress analysis of appendix under internal pressure of 0.5 MPa to study the response (stress/deformation) of the appendix to the pressure loading.
1. The material model for appendix or humane tissue is not readily available in the literature. For current analysis hyper elastic material model is used. The simulation in absence of exact material properties does not provide accurate results. However objective of present study was to observe the response/behaviour of appendix under pressure, hence in the context of objective of study current analysis holds good. However further stress study of appendix with accurate material model is recommended.
2. The Self weight of the appendix is not considered in the current analysis. The internal fluid pressure applied on the inner wall of appendix is assumed, this is the pressure enough to burst/cause stress close to failure limit of the current material model of the appendix. The fluid pressure is required to be modified for accurate material properties of the appendix.
3. The end constraint applied on the appendix is approximate. The appropriate model will be to model appendix as an integral part of large intestine, or to join appendix and large intestine with tie constraints.
The finite element analysis (FEA) is a computing technique that is used to obtain approximate solutions to the boundary value problems in engineering. It uses a numerical technique called the finite element method (FEM) to solve boundary value problems. FEA involves a computer model of a design that is loaded and analysed for specific results. The finite element analysis was first developed by Richard Courant in 1943. He used the Ritz method of numerical analysis and minimization of variation calculus for getting approximate solutions to vibration systems. Later, the academic and industrial researchers created the finite element method for structural analysis.
There are varieties of commercial FEA software packages available in market. However, no software has the capability to meet the complete analysis requirements of a design. Therefore, some firms use one or more CAE software depending on their requirements. Some
companies also develop their own customized version of commercial software to meet their requirements provided by the commercial software. Some of the most popular and commercially available FEA software are as follows:
1. ANSYS 2 Adina 3 Abaqus 4 Hypermesh 5 NX Nastran 6
Cosmos 7 NISA 8 Marc 9 Ls-Dyna 10 MSC/Dytran 11 Star-
CD
In this work, for analysis of an appendix, we are using
Abaqus FEA software.
Following are the advantages and limitations of FEA.
1. It reduces the amount of prototype testing; thereby, saving the cost and time involved in performing design testing.
2. It gives graphical representation of the result of analysis.
3. The finite element modelling and analysis are performed
by the pre-processor phase and the solution phase, which if
done manually, will consume a lot of time and, in some
cases, may be impossible to do.
4. Variables such as stress, temperature can be measured at
any desired point in the model.
5. It helps optimize the design.
6. It is used to simulate the designs that are not suitable to
prototype testing such as surgical implants (artificial
knees).
7. It helps you create more reliable, high quality, and competitive designs.
1. It provides approximate solutions.
2. FEA packages are costly.
3. Qualified personnel are required to perform the analysis.
4. The results give solutions but not remedies.
5. Features cannot be accommodated to the model. This
may lead to approximation and errors in the result
obtained.
6. For more accurate result, more computer space and time
are required.
The finite element analysis consists of following three steps. It consists of pre-processing, solution and post processing.
Appendix is extension to the large intestine, supported on large intestine against its self-weight and fluid pressure
IJSER © 2014 http://www.ijser.org
International Journal of Scientific & Engineering Research, Volume 5, Issue 2, February-2014 586
ISSN 2229-5518
acting on the inner walls of the appendix. For FE model large intestine is not modeled, instead end nodes of the appendix connecting to the large intestine are constrained to represent the fixity of appendix on the large intestine. The Self weight of appendix is neglected and internal fluid pressure of 0.5 MPa is applied on the inner wall of the appendix. Commercial finite element code ‘Abaqus’ was utilized for the stress analysis of appendix. The appendix is modeled with reduced integration element formulation. The reduced integration elements in the abaqus are better suited to avoid volumetric locking in the rubber like materials. Though these elements poses problems of hour glassing, abaqus in general provide good control over hour glassing and will not change the results significantly.
The pre-processor is a program that processes the input data to produce the output that is used as input to the subsequent phase (solution). It consists of the following contents.
Analysis is of different types. This topic consists of structural analysis of an appendix.
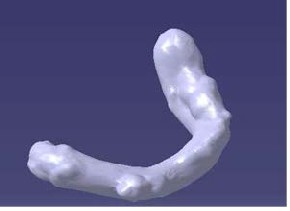
Reverse engineering consists of 3D scanning and CAD modelling of an appendix.3D scanning of an appendix gives scanning images. With the help of scanning images, the geometrical model of an appendix is created. The geometrical model of an appendix is imported to designing packages. It will be in STL, STP or IGES format. The IGES file of an appendix is imported, is shown in the following figure.
Fig 2: IGES file of an appendix.
While geometrical modelling, there are some of the assumptions which are listed below.
1. Material properties will remain in the linear region and nonlinear behaviour of the material property cannot be accepted. Due to this, the stress levels exceeding the yield point or excessive displacement will cause a component failure.
2. Material properties are not affected by the load rate.
3. The component is free from surface imperfections that
can produce stress risers.
4. All simulations will assume room temperature, unless
otherwise specified.
5. The effects of relative humidity or water absorption on material used will be neglected.
6. No compensation will be made to account for the effect of chemicals, corrosives, wears or other factors that may have an impact on the long term structural integrity.
In human body, an appendix is there, which is made up of hyper-elastic material. Hyper elastic materials are quite common in many engineering applications. These materials are incompressible or almost incompressible and undergo large strains when subjected to loads. In the last six decades, many constitutive models are developed for hyper elastic materials, which can be used in computational model according to the application. Never the less, computational modelling poses challenges owing to incompressibility. For example, the displacement based finite element methods, which are widely used for various applications and materials, are not efficient for almost incompressible materials. The common problems with these methods, when Poisson’s ratio approaches 0.5, are the incorrect stresses, the ill conditioning of stiffness matrix, and the locking. A huge amount of work has been done by many researchers in the past to deal with the problems due to the condition of incompressibility in solids. A great deal of research work has been devoted to the mixed vibrational finite element methods for the analysis of incompressible and almost incompressible materials. In the mixed method, the displacements and the stresses (or hydrostatic pressures) are separately defined and are subject to
variation. An appendix inside the human body is generally
IJSER © 2014 http://www.ijser.org
International Journal of Scientific & Engineering Research, Volume 5, Issue 2, February-2014 587
ISSN 2229-5518
of hyper elastic material. Hence the hyper elastic material is selected for the current analysis.
The ‘Yeoh’ hyper elastic material model is used for the present study. The material constants for this material model are listed below, where ‘C’ is Modulus of rigidity,
‘D’ is diameter and ‘T’ is temperature.
1. C10- 0.7999941, 2. C20 - 0.0470588, 3. C30 -
0.0270712, 4. D1- 0.214382, 5.D2- 0, 6. D3. -0, 7.T-27
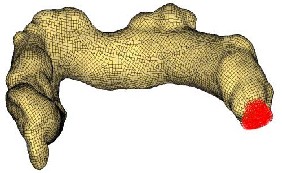
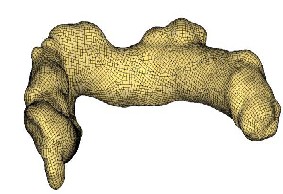
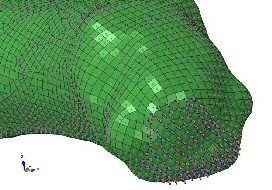
The meshing models of an appendix are shown in the following figures. The meshing is done by importing CAD model (STL, STP or IGES file) of appendix into mechanical designing packages. The surface of an appendix is divided into number of parts which is called as discretization technique. Accuracy is totally depends upon the number of parts. More number of parts will increase in more accuracy. During meshing of an appendix, as shown in the figure, the right side end of an appendix is fixed. As shown in the following figure, an appendix is fixed at one of its right end which is shown by red colour.
Fig 3: Meshing of an appendix.
Loading conditions are very important while conducting any analysis. In current analysis of an appendix, the right hand side end of an appendix is fixed. The internal pressure on appendix of 0.5 MPa is considered during this analysis. In this analysis, we are using hyper elastic material of appendix. Hence poisons ratio for this material is 0.5. These are the loading conditions, used for this structural analysis of an appendix. There are some assumptions related to loading conditions. Firstly, Displacements will be small so that the magnitude, orientation, and distribution of the load remain constant throughout the process of deformation. Frictional loss in the system is considered to be negligible. All interfacing components will be assumed rigid. The portion of the structure being studied is assumed a separate part from the rest of the system, therefore so that any reaction or input from the adjacent features is neglected.
Solution phase is completely automatic. The FEA software generates the element matrices, computes nodal values and derivatives, and stores the result data in files. These files are further used by the subsequent phase that is postprocessor
to review and analyse the results.
5.4 POSTPROCESSOR
The output from the solution phase is in the numerical form and consists of nodal values of the field variable and its derivatives. The postprocessor processes the result data and displays them in graphical form to check or analyse the
IJSER © 2014 http://www.ijser.org
International Journal of Scientific & Engineering Research, Volume 5, Issue 2, February-2014 588
ISSN 2229-5518
result. The graphical output gives the detailed information
about the required result data. The postprocessor phase is
automatic and generates the graphical output in the form specified by the user.
Figure 4A shows pressure distribution diagram which shows pressure at different stages of an appendix. This image is captured from abaqus software which is FEA analysis software. As shown in the figure, pressure is distributed on entire surface of appendix.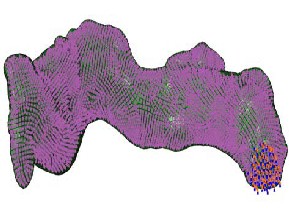
Figure 4B shows that it is a right end enlarge portion pressure distribution diagram of an appendix. As shown in the figure, pressure is distributed on entire surface of appendix.
Fig 4A and 4B: Pressure distribution diagram
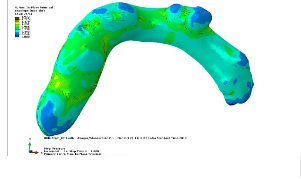
Figure 5 shows maximum stress distribution diagram of an appendix. This is captured from an abaqus. This figure shows s-maximum plane principal stress when the boundary condition is 0.5 MPa. After applying material condition into solution stage, we get bitmap image of s-max stress. The different colour coding is shown in the following bitmap image which shows the colour coding of stress distribution. Such that stress distribution shown by blue colour is nil. It ranges up to 0.739 MPa. Stress distribution shown by green colour ranges from 0.739 MPa to 1.232 MPa. The yellow colour shows stress distribution range from 1.232 MPa to 1.479 MPa. Whereas, the brown colour shows the maximum stress distribution having value of 1.972 MPa.
Fig 5: Maximum principal stress distribution of an appendix
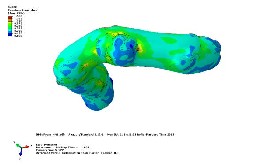
The various stress distribution images are shown in the following figure 6.
IJSER © 2014 http://www.ijser.org
International Journal of Scientific & Engineering Research, Volume 5, Issue 2, February-2014 589
ISSN 2229-5518
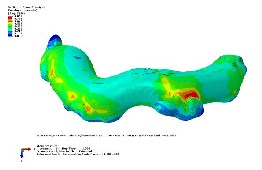
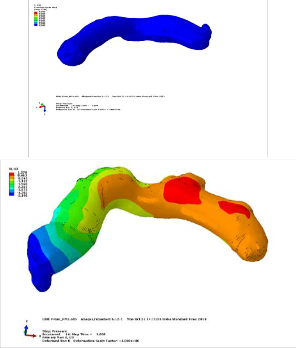
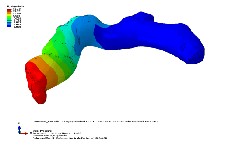
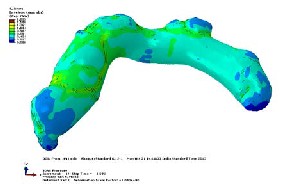
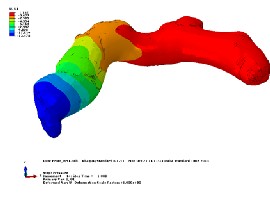
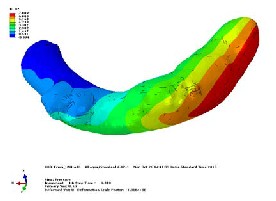 Fig 6: stress distribution images of an appendix.
IJSER © 2014 http://www.ijser.org
International Journal of Scientific & Engineering Research, Volume 5, Issue 2, February-2014 590
ISSN 2229-5518
6 CONCLUSIONS
The development of bio-medical imaging is a great advancement in the medical field, because it reduces the rate of medical misdiagnosis of illnesses. Although bio- medical images improved the ability of doctors to diagnose and treat patients.
In this paper, the study is carried on the analysis of an appendix under internal pressure loading. The maximum stress on the appendix under pressure loading of 0.5 MPa is
1.85 MPa which is close to current material failure limit of
1.9 MPa. It helps doctors for easy treatments and diagnosis of their patients. It will surely help the doctors in optimizing the time and cost for the diagnosis and treatment of appendices patients.
[1] Hobler, K. (Spring 1998). "Acute and Suppurative Appendicitis: Disease
Duration and its Implications for Quality Improvement". Permanente
Medical Journal 2 (2).
[2] Appendicitis epidemiological data VoxHealth medical information based on CDC medical records. Retrieved on 12-24-2012.
[3] Barrett ML, Hines AL, Andrews RM. Trends in Rates of Perforated Appendix, 2001–2010. HCUP Statistical Brief #159. Agency for Healthcare Research and Quality, Rockville, MD. July 2013.
[4] Wier LM, Hao Y, Owens P, Washington R. Overview of Children in the Emergency Department, 2010. HCUP Statistical Brief #157. Agency for Healthcare Research and Quality, Rockville, MD. May 2013.
[5] Lozano, R (Dec 15, 2012). "Global and regional mortality from 235 causes of death for 20 age groups in 1990 and 2010: a systematic analysis for the Global Burden of Disease Study 2010.". Lancet 380 (9859): 2095–128.
[6] "Health Care as a 'Market Good'? Appendicitis as a Case Study".
JournalistsResource.org, retrieved April 25, 2012.
[7] Hsia, Renee Y.; Kothari, Abbas H.; Srebotnjak, Tanja; Maselli, Judy (2012). "Health Care as a 'Market Good'? Appendicitis as a Case Study". Archives of Internal Medicine.
[8] Charalambides M.N. and Olusanya A., NPL Report CMMT(B)131, April
1997.
[9] ABAQUS/Standard User’s and Theory Manuals, Version 5.8, Hibbit, Karlsson & Sorenson Inc., USA, 1998.
IJSER © 2014 http://www.ijser.org