International Journal of Scientific & Engineering Research, Volume 4, Issue 4, April-2013 747
ISSN 2229-5518
An Efficient Image Segmentation of Contrast
Enhanced MR Images of Brain Tumor
R.Nithiya (M.Tech) , S.Ananadalatchoumy M.Tech.,(Ph.d), R.Vithiya (M.Tech), A.Sundaravadivelan (M.E)
Abstract--Segmentation of brain tissues in gray matter, white matter and tumor on medical images is not only of high interest in serial treatment monitoring of “disease burden” in oncologic imaging, but also gaining popularity with the advance of image guided surgical approaches. In this paper, we present a fast and robust practical for segmentation of solid tumors with minimal user interaction to assist clinicians and researchers in radio surgery planning and assessment of the response to the therapy. Particularly, cellular automata (CA) based seeded tumor segmentation method on contrast enhanced T1 weighted magnetic resonance (MR) images, which standardizes the volume of interest (VOI) and seed selection, is proposed. As the change in necrotic and enhancing part of the tumor after radiation therapy becomes important, we also applied the Tumor-cut segmentation to partition the tumor tissue further into its necrotic and enhancing parts. We presented a database from Harvard tumor repository and another from a clinical database of tumors that underwent radio surgery planning at Radiation Oncology Department of ASM. The performance over particularly datasets of highly heterogeneous tissue content demonstrated an overlap in the range 80%–90%, however, with a desired low surface distance error, average median surface distances of
1.0–1.5 mm, respectively.
Index Terms— Brain tumor segmentation, cellular automata, contrast enhanced magnetic resonance imaging (MRI), necrotic tissue segmentation, radio surgery, radiotherapy, seeded segmentation, shortest paths.
—————————— ——————————
1 INTRODUCTION
In recent years, magnetic resonance imaging (MRI) has become important in brain tumor diagnosis. Using this modal- ity, physicians can locate specific pathologies by analyzing differences in tissue character presented in different types of MR images. The task in this problem is to automatically detect the presence of tumors in MR images of the brain, and seg- ment the abnormal pixels from the normal pixels. Traditional- ly, the task has tried to segment the metabolically active en- hancing area of the tumor, which appears hyper-intense in T1 weighted images after the injection of gadolinium. Several recent methods have focused on additionally segmenting non- enhancing regions, as well as tumors that may only partially enhance or do not enhance at all. Several recent methods have also focused on the related task of segmenting edema (swell- ing) associated with tumors.
A key problem in medical imaging is automatically seg- menting an image into its constituent heterogeneous process- es. Automatic segmentation has the potential to positively im- pact clinical medicine by freeing physicians from the burden of manual labeling and by providing robust, quantitative measurements to aid in diagnosis and disease modeling. One such problem in clinical medicine is the automatic segmenta- tion and quantification of brain tumors. In this paper, we re- examine the CA algorithm to establish the connection of the CA-based segmentation to the graph-theoretic methods to show that the iterative CA framework solves the shortest path problem with a proper choice of the transition rux, as our ap- plication is in the clinical radio surgery planning, where man- ual segmentation of tumors are carried out on contrast en- hanced T1-MR images by a radio- oncology expert, we modi- fy the CA segmentation towards the nature of the tumor properties undergoing radiation therapy by adapting relevant transition rules. Finally, a smoothness constraint using level set active surfaces is imposed over a probability map
constructed from resulting CA states.
MRI contrast agents are a group of contrast media used to improve the visibility of internal body structures in magnetic resonance imaging (MRI). The most commonly used com- pounds for contrast enhancement are gadolinium-based. MRI contrast agents alter the relaxation times atoms within body tissues where they are present after oral or intravenous ad- ministration. MRI scanners sections of the body are exposed to a very strong magnetic field, a radio frequency pulse is ap- plied causing some atoms (including those in contrast agents) to spin and then relax after the pulse stops. This relaxation emits energy which is detected by the scanner and is mathe- matically converted into an image. The MRI image can be weighted in different ways giving a higher or lower signal.
Most clinically used MRI contrast agents work through
shortening the T1 relaxation time of protons located nearby.T1 shortens with an increase in rate of stimulated emission from high energy states (spin anti-aligned with the main field) to low energy states (spin aligned). Thermal vibration of the strongly magnetic metal ions in the contrast agent creates os- cillating electromagnetic fields at frequencies corresponding to the energy difference between the spin states (via E = he), re- sulting in the requisite stimulation. MRI contrast agents may be administered by injection into the blood stream or orally, depending on the subject of interest. Oral administration is well suited to G.I. tract scans, while intravascular administra- tion proves more useful for most other scans. A variety of agents of both types enhance scans routinely.
To quantify the necrotic cells and also enhance the tissue
of tumor in brain using CA based seeded tumor segmentation
IJSER © 2013 http://www.ijser.org
International Journal of Scientific & Engineering Research, Volume 4, Issue 4, April-2013 748
ISSN 2229-5518
ity of its energy to capture underlying statistics of images and
method. A fast A fast and robust practical tool for segmenta- tion of solid tumors with minimal user interaction to assist clinicians and researchers radio surgery planning and assess- ment of the response to the therapy. Particularly, cellular au- tomata (CA) based seeded tumor segmentation method on contrast enhanced T1 weighted magnetic resonance (MR) im- ages, which standardizes the volume of interest (VOI) and seed selection is proposed. we establish the connection of the CA-based segmentation to the graph-theoretic methods to show that the iterative CA framework solves the shortest path problem.
The popular trend in the area, as in the aforementioned ap-
proaches, is to be able to combine information from different sources to obtain a better segmentation. However, attempts to develop better algorithms from the image processing perspec- tive that work on a particular MRI protocol continue in paral- lel not only to obtain proper information from each channel to be combined, but also due to the practical need to routinely quantify tumors in a clinical environment. Therefore, in this study, we focused on an efficient and robust segmentation of brain tumors on contrast enhanced T1 weighted MR images with minimal user interaction. Region-based active contour models are widely used in image segmentation. In general, these region-based models have several advantages over gra- dient-based techniques for segmentation, including greater robustness to noise. However, classical active contours had the problem of being “only as good as their initialization,” even when using level-set surfaces in 3D. Because the tumor class does not have a strong spatial prior, many small structures, mainly blood vessels, are classified as tumor as they also en- hance with contrast. Ho et al. used fuzzy classification of pre- and post-contrast T1 images to obtain a tumor probability map to evolve a level-set surface.
Liu et al. have adapted the fuzzy connectedness framework
for tumor segmentation by constructing a rectangular volume
of interest selected through identifying the first and last slice of the tumor and specifying a set of vowels in the tumor re- gion. Interactive algorithms have become popular for image segmentation problem in recent years. Graph based seeded segmentation framework has been generalized such that graph-cuts (GC), random walker (RW), shortest paths, and power watersheds have been interpreted as special cases of a general seeded segmentation algorithm, which solves a mini- mization problem involving a graph’s edge weights con- strained by adjacent vertex variables or probabilities. In the connection between GC, RW, and shortest paths was shown to depend on different norms: (GC); (RW); (shortest paths), in the energy that is optimized.
Geodesic distances between foreground and background
seeds were also incorporated into other shortest path-based segmentation algorithms. Although it was reported that the shortest paths and RW produce relatively more seed- dependent results, it can be argued that the global minimum of an image segmentation energy is worth as good as the abil-
a local minimum may produce a solution closer to the ground truth than that of a global minimum. Hence, with good prior information provided as in the case of a seeded image seg- mentation problem, efficiently finding a good local minima becomes meaningful and worthwhile. On the other hand, cel- lular automata (CA) algorithm motivated biologically from bacteria growth and competition, is based on a discrete dy- namic system defined on a lattice, and iteratively propagates the system states via local transition rules. It was first used by Vezhnevets et al. [19] (Grow-cut) for image segmentation, which showed the potential of the CA algorithm on generic medical image problems.
However, Grow-cut was not designed for specific structures, such as tumors, which display heterogeneous content such as necrotic and enhancing tissue. Moreover, anatomic structures typically have relatively smooth boundaries, however, Grow- cut tends to produce irregular and jagged surface results, and only an adhoc way of smoothing was introduced. In this pa- per, we re-examine the CA algorithm to establish the connec- tion of the CA-based segmentation to the graph-theoretic methods to show that the iterative CA framework solves the shortest path problem with a proper choice of the transition rule. Next, as our application is in the clinical radio surgery planning, where manual segmentation of tumors are carried out on contrast enhanced T1-MR images by a radio-oncology expert, we modify the CA segmentation towards the nature of the tumor properties undergoing radiation therapy by adapt- ing relevant transition rules. Finally, a smoothness constraint using level set active surfaces is imposed over a probability map constructed from resulting CA states. Following a brief background on seeded segmentation methods, we present our framework for brain tumor segmentation and demonstrate its performance via validation studies on both synthetic, and ra- diation therapy planning expert-segmented data
2 BACKGROUND
To quantify the necrotic cells and also enhance the tissue of tumor in brain using CA based seeded tumor segmentation method. A fast and robust practical tool for segmentation of solid tumors with minimal user interaction to assist clinicians and researchers radio surgery planning and assessment of the response to the therapy. Particularly, cellular automata (CA) based seeded tumor segmentation method on contrast en- hanced T1 weighted magnetic resonance (MR) images, which standardizes the volume of interest (VOI) and seed selection is proposed. we establish the connection of the CA-based seg- mentation to the graph-theoretic methods to show that the iterative CA framework solves the shortest path problem.
2.1 Automatic Segmentation
A key problem in medical imaging is automatically seg-
IJSER © 2013 http://www.ijser.org
International Journal of Scientific & Engineering Research, Volume 4, Issue 4, April-2013 749
ISSN 2229-5518
menting an image into its constituent heterogeneous process- es. Automatic segmentation has the potential to positively
Impact clinical medicine by freeing physicians from the bur- den of manual labeling and by providing robust, quantitative measurements to aid in diagnosis and disease modeling. One such problem in clinical medicine is the automatic segmenta- tion and quantification of brain tumors. Modalities which give relevant information on tumor and edema/infiltration such as Perfusion Imaging, Diffusion Imaging, or Spectroscopic Imag- ing provide lower resolution images compared to T1 or T2 weighted sequences, and the former are generally not prefera- ble for geometric measurements. One of the main reasons to use multimodality images such as T2 weighted MRI is to seg- ment edema/infiltration region which is generally not observ- able in T1 images. Although the glial tumors infiltrate beyond the enhanced margin and edema/infiltration region might be of interest to fractionated radiotherapy in general, it is not possible to distinguish edema and infiltration, so usually this region is not included in primary target planning of radio sur- gery, particularly in Cyber knife.
In the brain, spinal cord, and proximal cranial and spinal nerves, the intact blood-brain barrier will prevent leakage of contrast material. Interstitial enhancement is related to altera- tions in the permeability of the blood-brain-barrier, whereas intravascular enhancement is proportional to increases in blood flow or blood volume. Intra vascular and interstitial enhancement may be seen simultaneously. When rapid dy- namic images are obtained, as in angiography, most of the observed enhancement is intravascular. When imaging is de- layed for 10–15 minutes after a bolus infusion, most of the ob- served enhancement is interstitial. At intermediate times, or with a continuous drip infusion of contrast material, en- hancement is a composite variable mixture of both intravascu- lar and interstitial compartments.
Several features of the MR imaging protocols alter the obser- vations of contrast material enhancement. Most pulse se- quences are subject to the “flow void phenomena,” whereby rapidly flowing fluids have low signal intensity .As a result, vascular shunt lesions, such as vein of Galen malformation and arterio venous malformation, appear dark on MR images. In addition, interstitial enhancement on MR images requires both free water protons and gadolinium. If a tissue is “dry” (ie, without water or free water), gadolinium enhancement will not be observed on routine T1-weighted MR images.
In the brain, spinal cord, and proximal cranial and spinal nerves, the intact blood-brain barrier will prevent leakage of contrast material. Interstitial enhancement is related to altera- tions in the permeability of the blood-brain-barrier, whereas intravascular enhancement is proportional to increases in blood flow or blood volume. Intra vascular and interstitial
enhancement may be seen simultaneously. When rapid dy-
namic images are obtained, as in angiography, most of the observed enhancement is intravascular. When imaging is de- layed for 10–15 minutes after a bolus infusion, most of the ob- served enhancement is interstitial. At intermediate times, or with a continuous drip infusion of contrast material, en- hancement is a composite variable mixture of both intravascu- lar and interstitial compartments.
Several features of the MR imaging protocols alter the obser- vations of contrast material enhancement. Most pulse se- quences are subject to the “flow void phenomena,” whereby rapidly flowing fluids have low signal intensity .As a result, vascular shunt lesions, such as vein of Galen malformation and arteriovenous malformation, appear dark on MR images. In addition, interstitial enhancement on MR images requires both free water protons and gadolinium. If a tissue is “dry” (ie, without water or free water), gadolinium enhancement will not be observed on routine T1-weighted MR images
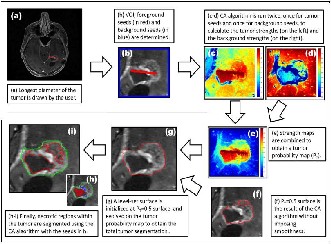
Fig.2.1.Tumour Segmentation Method
2.1.1 VOLUME OF INTEREST IN TUMOR
The skull and dura mater usually show vivid enhancement of the falx and tantrum on contrast-enhanced, but they do not routinely demonstrate similar enhancement on MR images. Normal dura mater, which is extra axial non neural connective tissue, does not have a blood-brain barrier, but it lacks suffi- cient water to show the T1 shortening required for enhance- ment on MR images. Various physiologic and pathologic con- ditions (which may either be unrelated or secondary to the primary lesions under investigation) produce abnormal con- trast enhancement. New blood vessels (angiogenesis), active inflammation (infectious and noninfectious), cerebral ische- mia, and pressure overload (ecclampsia and hypertension) are all associated with alterations in permeability of the blood- brain barrier.
IJSER © 2013 http://www.ijser.org
International Journal of Scientific & Engineering Research, Volume 4, Issue 4, April-2013 750
ISSN 2229-5518
In addition, reactive hyperemia and neo vascularity often have increased blood volume and blood flow (compared with that in normal brain tissue) and typically will show a shortened mean transit time. These features of abnormally increased ca- pillary permeability and altered blood volume and flow result in abnormal contrast enhancement on static gadolinium- enhanced MR images, static iodine-enhanced CT scans, and conventional angiograms. Similarly, results of perfusion and flow studies will be abnormal, regardless of whether flow is measured at MR imaging, CT, or angiography. CT and MR imaging can help measure relative cerebral blood flow (rCBF), relative blood volume (rCBV), and mean transit time (MTT).
2.1.2 DURA-ARACHNOID ENHANCEMENT
The vessels within the dura mater do not produce a blood- brain barrier. Endogenous and exogenous compounds, such as serum albumin, fibrinogen, and hemosiderin, readily leak into (and out of) the normal dura mater. Normal dural enhance- ment is well seen on CT scans in the dural reflections of the falx cerebri, tantrum cerebelli, and falx cerebelli. However, enhancement of the dura mater against the cortical bone of the inner table of the skull is usually inconspicuous and not rec- ognized because it appears “white on white.” On T1-weighted MR images. the normal dura mater and dinner table bone are uniformly hypointense. After the administration of gadolini- um-based contrast material, the normal dura mater shows only thin, linear.
2.1.3 REGION BASED METHOD
In general, these region-based models have several ad- vantages over gradient-based techniques for segmentation including greater robustness to noise. However, classical ac- tive contours had the problem of being “only as good as their initialization,” even when using level-set surfaces in 3D. Be- cause the tumor class does not have a strong spatial prior, many small structures, mainly blood vessels, are classified as tumor as they also enhance with contrast. Ho et al. used fuzzy classification of pre- and post-contrast T1 images to obtain a tumor probability map to evolve a level-set surface.

Fig2.2: Extra axial Enhancement
Region On the other hand, cellular automata (CA) algorithm motivated biologically from bacteria growth and competition,
is based on a discrete dynamic system defined on a lattice, and iteratively propagates the system states via local transition rules. It was first used by Vezhnevets et al. (Grow-cut) for im- age segmentation, which showed the potential of the CA algo- rithm on generic medical image problems. However, Grow- cut was not designed for specific structures, such as tumors, which display heterogeneous content such as necrotic and enhancing tissue.
2.2 SEEDED SEGMENTATION
Three popular seeded image segmentation algorithms are Graph Cut Random Walk and the Geodesic segmentation. They are based on energy functional which is minimized via discrete optimization. It is shown in that these three methods minimize a similar energy function while under different Lq norm (q = 1, 2,∞). The Graph Cut method treats the fore- ground/ background as source/sink, and uses a “maxflow/ min-cut” algorithm to find a set of edges that separates the source and the sink with the minimum total weights. The cut across the found edges is returned as the segmentation boundary.

2.2.1 Random walk method
The Random Walk method computes for each unseeded pixel the probability that a random walker starting at that pix- el first reaches the foreground or background seeds. Classifies each pixel into the corresponding group according to the max- imal probability. In this project, we will show that Random Walk can be viewed as a special case under our diffusion- based segmentation framework, in which the diffusion is con- ducted only along the directions of the two coordinate axes. Our proposed anisotropic diffusion method improves the Random Walk method by allowing diffusion along arbitrary directions which respect the local geometric structure of the image. The Geodesic algorithm classifies the unseeded pixels according to their geodesic distances to the “foreground” and “background”. It intrinsically belongs to the L∞−norm ap- proach. As have been shown in the Graph Cut method is sen- sitive to seed quantity and has the problem of “small cut” be- havior because it tries to minimize the total edge weights in the cut, the Random Walk tends to give the “average” cut re- sult, and the L∞−norm approach is strongly influenced by the position of the seeds.
2.2.2 Graph cut method
IJSER © 2013 http://www.ijser.org
International Journal of Scientific & Engineering Research, Volume 4, Issue 4, April-2013 751
ISSN 2229-5518
Graph Cut is a combinatorial optimization technique, which was applied by to the task of image segmentation. The image is treated as a graph - each pixel is a graph node. For the case of two labels (i.e. object and background) the globally optimal pixel labeling (with respect to defined cost function) can be efficiently computed by maxflow/min-cut algorithms. This technique can be applied to N-dimensional images. Given user-specified object and background seed pixels, the rest of the pixels are labeled automatically.
Medical images have their own unique properties. In many cases they are gray level and objects that should be segmented are very different in their structure and appearance from the objects that are common in photo editing. Probably that is why much research effort was applied for developing specific and efficient segmentation methods for the medical images domain. Nevertheless, some segmentation techniques like Graph Cuts can successfully be applied to medical images also. Some specific ‘medical’ segmentation techniques are re- viewed further.
2.2.3 Watershed-based method
Marker-based watershed transformation uses watershed transform, supported by user-specified markers (seeds) for segmenting gray level images. Watershed transform treats the image as a surface with the relief specified by the pixel bright- ness, or by absolute value of the image gradient. The valleys of the resulting ‘landscape’ are filled with water, until it reaches the ‘mountains’. Markers placed in the image specify the ini- tial labels that should be segmented from each other.
Random walker given a small number of pixels with user- defined seed labels (labels number can be grater than 2), ana- lytically determines the probability that a random walker starting at each unlabelled pixel will first reach one of the pre- labeled pixels. By assigning each pixel to the label for which the greatest probability is calculated, image segmentation is obtained. This method provides unique segmentation solution into connected segments, with some robustness against ‘weak’ boundaries. A confidence rating of each pixel’s membership in the segmentation is also estimated.
2.2.4 MRI brain tumor and registration
MRI contrast agents are a group of contrast media used to improve the visibility of internal body structures in magnetic resonance imaging (MRI). The most commonly used compounds for contrast enhancement are gadolinium- based. MRI contrast agents alter the relaxation times atoms within body tissues where they are present after oral or intravenous administration. MRI scanners sections of the body are exposed to a very strong magnetic field, a radio fre- quency pulse is applied causing some atoms (including those in contrast agents) to spin and then relax after the pulse stops. MRI contrast agents may be administered by injection into the
blood stream or orally, depending on the subject of interest.
Oral administration is well suited to G.I. tract scans, while intravascular administration proves more useful for most oth- er scans.
2.2.5. SEED SELECTION BASED ON TUMOR
In “Response Evaluation Criteria In Solid Tumors” (RE- CIST), which is a widely used procedure to evaluate the treatment response of the solid tumors, tumor progress is clas- sified by measuring the longest in plane tumor diameter. In one dimension (axial, coronal, sagittal). Our seed selection algorithm employs the same idea to follow the familiar clinical routine to which the clinicians are used to: the volume of in- terest (VOI), the tumor seeds and the background seeds are determined by using the line already drawn by the user to measure the longest diameter of the solid tumor. Similarly, focusing on tumor segmentation problem, the seed selection procedure starts with a single line drawn by the user along the longest visible diameter of the tumor.
In order to determine the optimal choice for parameter. Smoothing weighting pair for tumor segmentation applica- tion, the algorithm is run for each parameter value varying between 0.4 to 1.2 whereas the smoothing weighting varies from 0.0 to 0.8. Using manual expert segmentations as ground truth, average Dice overlaps obtained by each parameter and smoothing level pair are plotted in Fig.2.3
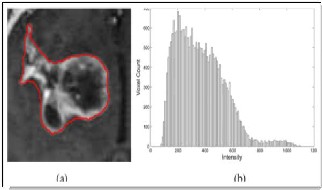
Fig.2.3. MRI Intensity Histogram of the 3D tumor volume
Instead of using simple thresholding, connectedness was imposed by using the CA algorithm with two thresholds as follows: Initially the vowels lower than a necrotic threshold are labeled as necrotic seeds and higher than an enhanced threshold are labeled as enhanced seeds as in Fig 2.4. Howev- er, there, the motivation and emphasis was on fast hardware implementation of the CA algorithms, due both increasing availability of low-cost graphical hardware (GPUs), and CA algorithm’s suitability to run on parallel processors
2.4 CELLULAR AUTOMATA ALGORITHM
IJSER © 2013 http://www.ijser.org
International Journal of Scientific & Engineering Research, Volume 4, Issue 4, April-2013 752
ISSN 2229-5518
Steps of the proposed cellular automata based tumor segmentation algorithm have the following steps. (a) the user
draws a line over the largest visible diameter of the tumor; (b) using this line, a VOI is selected with foreground(red)- background(blue) seeds; (c)–(d) tumor CA algorithm is run on the VOI for each two sets of seeds (for the foreground and background) to obtain strength maps for foreground (c) and background. (d) at each voxel; (e) two strength maps are combined to obtain the tumor probability map. (f) a level set surface is initialized at and the map is used to evolve the surface which converges to the final segmenta- tion map.
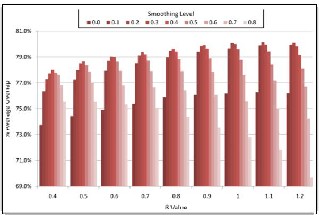
Fig.2.4. Effect of different Smoothing levels
Finally, (g) and(i) the necrotic regions of the tumor is segmented using a CA-based method with the chosen en- hanced and necrotic seeds.
2.4.1. Cellular Automata Segmentation
We take an user interaction scheme - user specifies cer- tain image pixels (we will call them seed pixels) that belong to objects that should be segmented from each other. The task is to assign labels to all other image pixels automatical- ly, preferably achieving the segmentation result the user is expecting to get. The task statement and input data is simi- lar to the segmentation instrument differs.
Our method uses cellular automaton for solving pixel labelling task. The method is iterative, giving feedback to the user while the segmentation is computed. Proposed method allows (but not requires) human input during la- belling process, to provide dynamic interaction and feed- back between the user and the algorithm. This allows to correcting and guidance of the algorithm with user input in the areas where the segmentation is difficult to compute,
yet does not require additional user effort where the seg- mentation is reliably computed automatically.
We take an intuitive user interaction scheme - user speci- fies certain image pixels (we will call them seed pixels) that
belong to objects that should be segmented from each oth- er.
3. RESULTS
3.1. SIMULATION RESULT
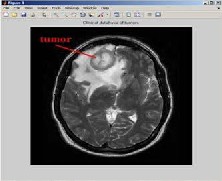
Fig 3.1.Clinical Database of Tumors as input image
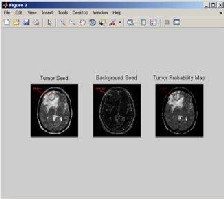
Fig 3.2: Tumor seed, Background seed, Tumor probability map
The input image is converted into gray scale image before pre-processing.Here we converted our image of brain tumor into a gray scale image and it is given as a input image taken from clinical database of tumors.
IJSER © 2013 http://www.ijser.org
International Journal of Scientific & Engineering Research, Volume 4, Issue 4, April-2013
ISSN 2229-5518
753
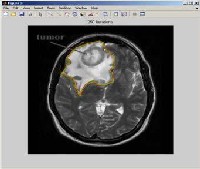
Fig 3.3. 250 iterations ofbrain tumor
IJSER lb)2013
http://www.ijserorq
International Journal of Scientific & Engineering Research, Volume 4, Issue 4, April-2013 754
ISSN 2229-5518
Generate the structuring element to find out the background seed and tumor seed. Then apply image subtract to subtract background from the original image to obtain tumor probability map. The tumor probabil- ity map is used to measure the distance from background to foreground of the image and also level set surface is calculated from the image.
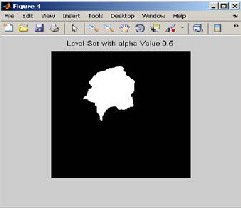
Fig 3.4 .Level set with alpha value 0.5
We have to apply cellular automata algorithm to the image of brain tumor to calculate the 250 iterations and with the help of these iterations. We calculate the tumor place accurately with the help of this algorithm and draw the seed point of tumor.
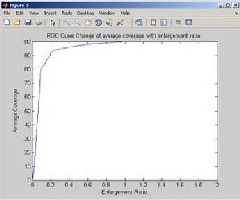
Fig 4.5. ROC curve change of average coverage with enlargement ratio
Initialize the alpha value to 0.5 to obtain the number of iterations and the use CA algorithm the brain tumor image is segmented only the tumor part. The tumor is segmented the affected part of tumor region with the help of seeded point of this algorithm.
Region of curvature (ROC) is obtain from the change of aver- age coverage with enlargement ratio. The enlargement ratio is two times of bigger the image than currently being presented. So
100% coverage is obtained from the ROC curve change of average with enlargement rate.
REFERENCES
[1] A.HAMAMCI et al.: tumor-cut: segmentation of brain tumors on contrast enhanced mr images for radio surgery applications .IEEE transactions on medical imaging, vol. 31, no. 3, march 2012.
[2] X. Bai and G. Sapiro. Geodesic Matting: A Framework for Fast Interactive Image and Video Segmentation and Matting. International Journal of Computer Vision, 82(2):113–132, 2009.
[3] D. Singaraju, L. Grady, and R. Vidal. P-Brush: Continuous Val ued MRFs with Normed Pairwise Distributions for Image Seg- mentation. In Proc. of CVPR 2009. IEEE Computer Society, IEEE, June 2009.
[4] S. Vicente, V. Kolmogorov, and C. Rother. Graph cut based im age segmentation with connectivity priors. In CVPR, 2008.
[5] X. Bai and G. Sapiro. A Geodesic Framework for Fast Interactive
Image and Video Segmentation and Matting. In Proc. of ICCV
2007. IEEE Computer Society, IEEE, Oct 2007.
[6] D. Tschumperl´e and R. Deriche. Vector-Valued Image Regulari zation with PDE’s: A Common Framework for Different Appli- cations. IEEE Trans. on Pattern Analysis and Machine Intelli- gence, 27(4):506–517, April 2005.
[7] Y.Boykov and G. Funka-lea. Graph Cuts and Efficient N-D Im age Segmentation. Int. J. Comput. Vision, 70(2):109–131, No- vember 2006.
[8] Y. Boykov and M.-P. Jolly. Interactive Graph Cuts for Optimal Boundary and Region Segmentation of Objects in N-D Images. In Proc. of ICCV 2001, pages 105–112. IEEE Computer Society, IEEE, July 2001
[9] T. F. Chan and J. Shen. Image Processing and Analysis. SIAM, Philadelphia, 2005.
[10] L. Grady. Random Walks for Image Segmentation. IEEE Trans. on Pattern Analysis and Machine Intelligence, 28(11):1768–
1783, Nov. 2006.
[11] P. Perona and J.Malik. Scale-space and edge detection
using anisotropic diffusion. IEEE Trans. on Pattern Analysis and Machine Intelligence, 12:629–639, 1990
IJSER © 2013 http://www.ijser.org


