International Journal of Scientific & Engineering Research, Volume 6, Issue 2, February-2015 190
ISSN 2229-5518
Air Stirring System for Adsorption of Hexavalent
Chromium onto Chitosan
Mamdouh M.Nassar(1), Abd EL Hakim Daifullah(2), Joseph Y. Farah (3)* and H.Kelany(1)
Abstract - The adsorption of hexavalent chromium from aqueous solutions onto chitosan was investigated. The chitosan was characterized by Fourier transform infrared spectroscopy (FT-IR) and Scanning Electron Microscopy (SEM). The physical properties of chitosan were als o investigated.
The effect of chitosan mass, initial chromium concentrations and air flow rate on the removal of chromium in batch reactor using air stirring technique have been studied The experimental kinetic data were tested using Pseudo-first order, Pseudo-second order, Elovich and Modified Freundlich models. Three error functions were used to identify the best fit model with the experimental data. The error analysis showed that, compared with other models, the , Pseudo-second order model resulted in the lowest values for the error function and thus fitted the data better than the other models.
Keywords - Bubble column adsorber ; Hexavalent chromium ; Chitosan ; Kinetic modelling; Error analysis.
—————————— ——————————
HE industrial discharge of the heavy toxic metal ions into water recourses is a serious pollution problem affecting water quality. Among the heavy metal ions, chromium holds a distinct position due to its high toxic nature to biological systems. Chromium exists in the +III and +VI oxidation states in aqueous medium but Cr(VI) is 500 times more toxic than Cr(III)[1]. The toxicity of Cr(VI) is associated with lung cancer as well as kidney, liver and gastric damage
[2,3].
Conventional methods applied for Cr (VI) removal are mainly chemical precipitation, oxidation/reduction, filtration, ion exchange, membrane separation and adsorption [4]. At present, one of the most promising treatment approaches for wastewater polluted by Cr (VI) is based on adsorption of Cr (VI) onto different adsorbents [5], as this method offers advantages including low cost, flexibility and simplicity of design, ease of operation, insensitivity to toxic pollutants and avoiding the formation of secondary pollutants [6].
Gas stirring is widely employed in many industrial applications as in reactors or gas-liquid contactors. The bubble columns have the advantages of being geometrically simple, easily manufactured, free of moving parts, superior for gas- liquid interfacial mass and heat transfer, easily operated and cost effective [7-9].
Few authors use gas stirring in the adsorption column to
————————————————
1. Chemical Engineering Department, Faculty of Engineering , EL-Minia
University ,EL-Minia, Egypt.
2. Hot Laboratory and Waste Mangement Centre ,Atomic Energy
Authority,Egypt.
3. Chemical Engineering and Pilot Plant Department National Research
Centre
*Co-Author E-mail: josephyfarah@hotmail.com
remove pollutants from waste water. In the present study, we use air stirring system to remove hexavalent chromium from water [10-12].
All the chemicals used in our experiments were of analytical grade, chitosan [(C6 H 11 NO4 )n ] which has molecular weight 100,000 – 300,000 and supplied from Acros Organics – New York, USA. Potassium dichromate ( K2 Cr2 O7 , 99.5% Assay – M.W.294.18) was obtained from LOBA CHEMIE PVT. LTD. INDIA.
Stock solution of Cr(VI) (130 mg/dm3) was prepared by dissolving K2 Cr2 O7 salt in double distilled water and the concentration of Cr(VI) in the stock solution was measured. Experimental solutions at the desired concentrations were then obtained by successive dilutions. Before adding the sorbents, the pH of each test solution was adjusted to the required value with 0.1 M HNO3 and 0.1 M NaOH. The concentration of free chromium ions in the stock solutions and unadsorbed Cr(VI) in the reaction medium was determined spectrophotometrically at 540 nm in a spectrophotometer using 1,5 diphenylcarbazide ( OXFORD Laboratory Reagent – C13 H14 ON4 – M.W. 242.28) as the complexing agent [13,14] .
The Fourier transform infrared spectroscopy (FT-IR) study was carried out using Perkin Elmer FTIR – 1600 series infrared spectrometer. FTIR spectra was recorded in the range of 400-
4000 cm-1 with KBr pellet technique.
The specific surface area was determined by nitrogen gas adsorption at 77 K using Surface Area Anlyzer ( Nova 2200,
IJSER © 2015
International Journal of Scientific & Engineering Research, Volume 6, Issue 2, February-2015 191
ISSN 2229-5518
Quantachrome- USA). The measurements were made after degassing under vacuum for 6 h. The specific surface area (SBET) was calculated by BET method [15].
The surface morphology of chitosan was observed under a scanning electron microscope (JSM T20 JOEL, JAPAN). The sample was gold coated prior to SEM observation
Experimental set up is shown in Fig. 1. The apparatus consisted mainly of vertical cylindrical jacketed glass column (30 cm height and 4.5 cm inside diameter). The column was fitted with a G1 sintered-glass distributor with average diameter pores 5-10 microns. Next to gas distributor, a ball valve and rotametr were fixed to control air flow rate. Temperature was adjusted by passing hot water, thermostatically controlled, in the jacket around the column.
Where q t (mg/g) is the amount of adsorbed chromium at time t; v the volume of the solution (dm3) , Co and Ct are the initial and the final chromium concentrations at time t respectively (mg/dm3) and M is the mass of adsorbent( g).
In order to investigate the adsorption kinetic of the adsorption of chromium on chitosan and optimized the design of a sorption system, it is important to establish the most appropriate correlation for the kinetic curves. There are many theories relating to adsorption kinetic and among the used models are Pseudo-First order, Pseudo – Second order, Elovich and Modified Freundlich models
Lagergren [16 ] suggested a rate equation for the sorption of solutes from liquid solution. The pseudo first-order equation in generally expressed as follow:
Before each run, the column was filled with 0.4 dm3 of fresh
𝑑𝑞𝑡 = 𝑘 (𝑞
− 𝑞 ) (2)
chromium solution at a certain concentration, followed by![]()
𝑑𝑡
1 𝑒 𝑡
addition of a known mass of chitosan (M ,g) , adjusting the air flow rate(F, cm3/ min) at temperature (T,0C). The air flow rate was measured with a calibrated rotameter.
Integrating Eq. ( 2) and applying the boundary conditions q t =0
at t=0 and q t =q t at t=t, gives:
ln(qe − qt ) = ln qe − k1 t (3)
Where q e and q t are the amount of chromium adsorbed at
equilibrium and at time t (mg/g) respectively, and k1 is the rate constant of the pseudo first- order adsorption (1/min).
If the rate adsorption is a second-order mechanism, the Pseudo second order equation kinetic rate equation is expressed as [17]: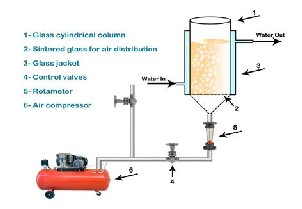
𝑑𝑞𝑡 = 𝑘 (𝑞
− 𝑞 )2 (4)
![]()
𝑑𝑡
2 𝑒 𝑡
Where k2 is the rate constant of sorption (g/mg.min)
Fig 1. Gas stirring system.
The effects of the adsorbent mass (0.035-0.235 g), initial chrome concentration (30- 130 mg/dm3) and air flow rates
Separating the variable in Eq. (4) and integrating by applying
the boundary conditions![]()
![]()
1 = 1 + 𝑘 𝑡 (5)
(240-800 cm3/min) were investigated. The samples were taken at time intervals, centrifuged and the amount of the chromium
𝑞𝑒 −𝑞𝑡
𝑞𝑒
adsorbed was calculated from the initial and final
Eq.( 5) can be rearranged to obtain a linear form:
concentrations of chromium in the liquid phases. The![]()
![]()
![]()
𝑡 1 𝑡
2
(6)
chromium uptake by chitosan was calculated by the following
equation.
𝑞𝑡
𝑘2𝑞𝑒
𝑞𝑒
𝑞𝑡 =
![]()
(𝐶𝑜−𝐶𝑡)𝑣
𝑀 (1)
The initial sorption rate, h(mg/g min), at t =0 is defined as
ℎ = 𝑘 𝑞2 (7)
2 𝑒
IJSER © 2015 http://www.ijser.org
International Journal of Scientific & Engineering Research, Volume 6, Issue 2, February-2015 192
ISSN 2229-5518
Elovich model [18] is a rate equation based on the adsorption capacity as:![]()
dqt = αe−βqt (8)
dt
The integration of the rate equation with the same
boundary conditions as the Pseudo-first order, the Pseudo –
second order equations become
The physical properties of chitosan (total surface area, average pore diameter, bulk density and porosity used in this study are shown in Table 1.
Table 1: Physical characteristics of chitosan
1 1
![]()
![]()
𝑞𝑡 = 𝛽 ln(𝛼𝛽) + 𝛽 𝑙𝑛𝑡 (9)
Where α is the initial adsorption rate (mg/g.min) and the
parameter β is related to the extent of surface coverage and activation energy
The modified Freundlich model a originally developed by
Kuo and Lotse[19 ]
𝑞𝑡 = 𝑘𝑓 𝐶0 𝑡
1�𝑚
(10)
Where kf the apparent adsorption rate constant (dm3/g.min),
m is the Kuo-Lotse constant. The linear form of the modified
Freundlich equation is given as![]()
ln 𝑞 = 𝑙𝑛�𝑘 𝐶 � + 1 𝑙𝑛𝑡 (11)
𝑚
The traditional approach of determining the kinetic parameters by linear regression of kinetic equations appears to give very good fits to the experimental data as most of their respective regression correlation coefficients (R2) are close to unity. The use of R2 is limited to solve linear forms of kinetic equation, which measures the difference between experimental and theoretical data in linearized plots only, but not the errors in non-linear form of kinetic curves. So, the applicability of the kinetic model to describe the adsorption process was further validated using error functions [20]. The error functions studied were as follows.
1- The sum of the absolute errors (SAE)
The sum of the absolute of the errors method can be
represented by the following equation:
𝑁
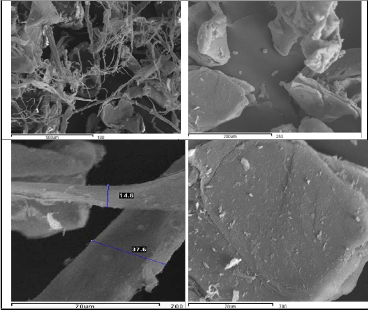
The SEM micrographs for chitosan are shown in Fig 2 at different magnifications (100, 250 and 700 ). It can be seen from Fig.2 that the chitosan display a rough surface and has irregular diameter in the range of 14.6 – 37.6 µm.
� �qt,cal − qt,exp �
𝑖=1 i
(12)
2- The sum of the square of the errors (SSE)
The sum of the squares of the errors method can be
represented by the following equation:
∑𝑁 1�𝑞𝑡,𝑐𝑎𝑙 − 𝑞𝑡,𝑒𝑥𝑝 � 2
(13)
Where N is the number of points on a fitted experimental
curve.
Fig 2 SEM for chitosan
IJSER © 2015 http://www.ijser.org
International Journal of Scientific & Engineering Research, Volume 6, Issue 2, February-2015 193
ISSN 2229-5518
The chitosan was characterized by FTIR spectroscopy for their
chemical constitution. The IR spectra for the chitosan are shown in Fig. 3.
300
250
200
150
100
50
0
C0 (mg/dm3)
30
50
75
100
130
0 20 40 60 80 100
time (min)
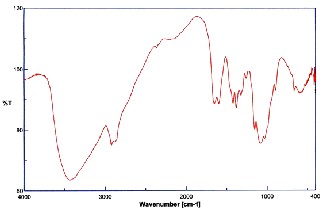
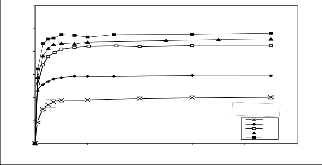
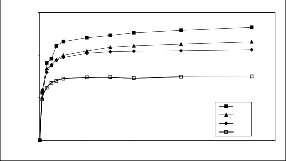
Fig.4 Effect of chromium initial concentration on the
adsorption onto chitosan.(M=0.118 g ,T=30+2оC ,F 240 cm3/min and pH 2.5)
Fig 3. FTIR plot for chitosan
Band in the region of 3400- 3500 cm-1, which must have been masked by the absorption, this band due to the OH group. The NH2 stretching (amide II) peak at 1567 cm-1 representing the glucosamine functional group, appeared in the spectrum of chitosan powder. Another significant change is observed in the region from 1000 cm-1 to 1200 cm-1, in this region chitosan presents a broad band centred at 1076 cm-1 associated with the stretching of C-O.In the region of 3000 cm-1 to 3700 cm-1 of the spectrum, chitosan exhibits a band corresponding to the stretching of OH groups. This band is broad because of the hydrogen bonds. The OH band overlaps the stretching band of NH as shown in Fig. 3.
The effect of initial chromium concentrations on the extent of adsorption on chitosan as a function of time is shown in Fig. 4. The amount of chromium adsorption increases with increasing initial chromium concentration. For instance the amount of chromium adsorbed at equilibrium increased from99.354 to 239.99 mg/ g when chromium concentration increased from 30 to 130 mg/ dm3. This may be attributed to an increasing concentration gradient acting as an increasing driving force to overcome all mass transfer resistances of the chromium molecules between the aqueous and solid phase, leading to an increasing equilibrium sorption until saturation is achieved.
The amount of adsorbent used in adsorption is particularly important because it determines the sorbent–sorbate equilibrium in the system and can also be used to predict the treatment cost of the adsorption process. The effect of adsorbent dosage on the chromium removal was studied and the results presented in Fig. 5. The chromium removal decreased with an increase in adsorbent dosage. For instance, the quantity of chromium uptake at equilibrium decreased from 265.348 to 149.855 mg/g when the adsorbent weight increased from 0.035to 0.235 g.
It was found that the mass transfer decreases by increasing
mass of adsorbent. This effect is probably due to the fact that
for small masses, small amount of external mass surface is available for the adsorption of the chromium. Hence, on one hand, there is a large driving force from the chromium per unit surface area of chitosan. On other hand, the decrease of uptake with increase in the adsorbent mass can be attributed to the effect of the concentration of solid upon magnitude on the driving force per unit area in the liquid phase. At greater solute gradients with smaller solid concentration and hence lower external surface area due to large contacts between the crowding solid particles which leads to decrease the amount of adsorbed Cr. The decrease of Cr uptake with the mass of chitosan can also, be understood mathematically through the relation: qRtR = (CR0R-CRtR) v /M (Eq. 1) by increase M at constant (CR0R
- CRtR), qRtR will decreased [21].
300
200
100
0
0 20 40 Time (min)
Mass (g)
0.035
0.118
0.165
0.235
60 80 100
IJSER © 2015 http://www.ijser.org
International Journal of Scientific & Engineering Research, Volume 6, Issue 2, February-2015 194
ISSN 2229-5518
Fig5 Effect of chitosan mass on the adsorption of chromium
(CRoR=100mg/dm3,T=30+2оC ,F 240 cm3/min and pH 2.5)
Figure 6 shows the plot of qt versus t for the adsorption of chromium onto chitosan using various air flow rates. As shown in Fig. 6, the removal of chromium is decreasing as the air flow rates increases. The amount of chromium adsorbed reach to 311 mg/g at 216 cm3/min, while at 800 cm3/min only
208 mg/g of chromium was removed from the solution.
It can be concluded that the effects of air flow rate on the
uptake of chromium are not significant for chromium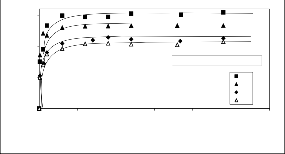
removal. As the air flow rate increases, the suspension may not become homogeneous due to the rapid agitation which can leads to decrease the adsorption due to decrease the contact between chromium and chitosan particles.. Similar results have been previously reported[22].
Table 2. Kinetic parameters of Pseudo-first order model Fitting chromium adsorption onto chitosan.
300
200
100
0
Air flow rate(cm3/min.)
240
400
550
800
0 50 100 150 200 250 300
Time (min)
Fig. 6 Effect of air flow rate on the adsorption of chromium onto chitosan (M=0.035 g, T=20+2оC, Co=100mg/dm3 and pH
2.5)
Several kinetic models including pseudo-first order of Lagergren, models were tested for simulation of the experimental data. pseudo-second-order, Elovich, pore diffusion and modified Freundlich The linear plots ln(qRtR–qReR) vs. t, t/qRtR vs. t, qRtR vs. ln t and ln qRtR vs. ln t,. allowed checking the validity of the different models ( Pseudo First order, Pseudo Second order, Elovich and Modified Freundlich models respectively) . The kinetic parameters calculated from Eqs. 3,6,9 and 11 for the adsorption of chromium at different initial chromium concentrations, adsorbent mass and air flow rates are given in Tables 2. From Tables 20 the pseudo-second- order seems to be the most appropriate, owing to the highest correlation coefficients recorded (always above 0.99) The other three models failed to described the experimental data well, as indicated by consistently lower R2 < 0.9, implying that the adsorption kinetics of the chromium followed a pseudo- second-order model.
IJSER © 2015 http://www.ijser.org
International Journal of Scientific & Engineering Research, Volume 6, Issue 2, February-2015 195
ISSN 2229-5518
Table 3 .Kinetic parameters of Pseudo-second order model
Fitting chromium adsorption onto chitosan.
Table 4 . Kinetic parameters of Elovich model Fitting
chromium adsorption onto chitosan.
Variables | K2 g/mg.min | q2 mg/g | qe,exp. mg/g | h mg/g.mi n | R2 | |
Mass (g) | 0.035 | 0.0024 | 270.27 | 265.35 | 172.41 | 0.99 |
Mass (g) | 0.118 | 0.0029 | 232.56 | 231.57 | 161.29 | 0.99 |
Mass (g) | 0.165 | 0.0057 | 212.77 | 212.85 | 256.41 | 0.99 |
Mass (g) | 0.235 | 0.014 | 149.25 | 149.86 | 312.5 | 0.99 |
Initial Concentration (mg/dm3) | 30 | 0.0047 | 101.01 | 99.33 | 48.31 | 0.99 |
Initial Concentration (mg/dm3) | 50 | 0.0031 | 156.25 | 154.4 | 75.19 | 0.99 |
Initial Concentration (mg/dm3) | 75 | 0.0021 | 204.08 | 203.31 | 87.72 | 0.99 |
Initial Concentration (mg/dm3) | 100 | 0.0029 | 232.56 | 231.57 | 161.29 | 0.99 |
Initial Concentration (mg/dm3) | 130 | 0.0032 | 238.09 | 239.86 | 178.57 | 0.99 |
Air flow rate (Cm3/min) | 240 | 0.0033 | 312.5 | 311 | 322.58 | 0.99 |
Air flow rate (Cm3/min) | 400 | 0.0114 | 270.27 | 267.5 | 833.33 | 1 |
Air flow rate (Cm3/min) | 550 | 0.0049 | 227.27 | 226 | 256.41 | 0.99 |
Air flow rate (Cm3/min) | 800 | 0.0045 | 212.77 | 216 | 204.08 | 0.99 |
IJSER © 2015 http://www.ijser.org
International Journal of Scientific & Engineering Research, Volume 6, Issue 2, February-2015 196
ISSN 2229-5518
Table 5 . Kinetic parameters of Modified Freundlich model
Fitting chromium adsorption onto chitosan.
Table 7 Values of error analyses of kinetic models for adsorption of chromium onto chitosan at different initial
concentration of chromium
Concentration | Pseudo First order | Pseudo Second order | Elovich | Modified Freundlich |
Co = 30mg/ dm3 | ||||
SSE | 4.4x10⁴ | 52.6 | 390.68 | 1096.24 |
SAE | 619.55 | 15.99 | 51.65 | 91.99 |
Co = 50mg/ dm3 | ||||
SSE | 1.34x10⁵ | 65.46 | 5311.09 | 933.99 |
SAE | 1155.7 | 18.21 | 163.16 | 78.77 |
ARE | ||||
Co = 75mg/ dm3 | ||||
SSE | 3.21x10⁵ | 487.33 | 507.91 | 1415.67 |
SAE | 1874 | 51.93 | 58.5 | 97.71 |
Co = 100mg/ dm3 | ||||
SSE | 3.25x10⁵ | 70.87 | 1465.95 | 2679.3 |
SAE | 1797 | 22.05 | 98.626 | 144.16 |
Co = 130 mg/dm3 | ||||
SSE | 3.9x10⁵ | 359.6 | 1011.26 | 1615 |
SAE | 1969.9 | 2529.9 | 82.24 | 111.76 |
Table 8. Values of error analyses of kinetic models for adsorption of chromium onto chitosan at different air flow rates
From results of calculated correlation coefficients (Tables 6-8) ,
it seems that the Pseudo Second order model is the most suitable model to satisfactorily describe the studied sorption system. Indeed the highest R2 values and the lowest SSE and SAE values were found when modelling the kinetic data.
Table 6 Values of error analyses of kinetic models for
adsorption of chromium onto chitosan at different chitosan mass
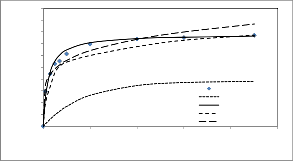
The models prediction for the change in chromium concentration with the time are compared with the
experimental data in Figs 7,8. Its observed that the Pseudo second-order equation provides the best correlation for all of the sorption process. The pseudo first-order equation does not fit to the experimental data for the adsorption of chromium.
IJSER © 2015 http://www.ijser.org
International Journal of Scientific & Engineering Research, Volume 6, Issue 2, February-2015 197
ISSN 2229-5518
200
180
160
140
120
100
80
60
40
20
0
Experimental Lagergren First order HO Second order Elovich
Modified Freundlich
0 20 40 60 80 100
Time (min)
References
[1] Sarin, V., Pant, K.K., Removal of chromium from industrial waste by using eucalyptus bark. Bioresour. Technol. 97, 15–20, 2006.
[2] Mohan, D., Singh, K.P., Singh, V.K., Removal of hexavalent chromium from aqueous solution using low-cost activated carbons derived from agricultural waste materials and activated carbon fabric cloth. Ind. Eng. Chem. Res. 44, 1027–1042, 2005.
[3] Levankumar, L., Muthukumaran, V., Gobinath, M.B., Batch adsorption and kinetics of chromium (VI) removal from aqueous solutions by Ocimum
Fig. 7. Comparison experimental and calculated kinetic
profile using several kinetic models. (C o =50mg/dm3 ,M=0.118 g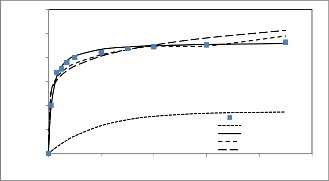
,T=30+2оC ,F 240 cm3/min and pH 2.5)
300
250
200
150
100
Experimental Lagergren First order HO Second order Elovich
0 Modified Freundlich
0 20 40 60 80 100
Time (min)
Fig 8. Comparison the experimental and the calculated kinetic profile using several kinetic models. (Co =100mg/dm3, M= 0.118 g, T=30+2оC ,F 240 cm3/min and pH 2.5)
This suggest that the adsorption systems studied belong to the second-order kinetic model, based on the assumption that the rate limiting step may be chemical sorption or chemisorptions involving valency forces through sharing or exchange of electrons between adsorbent and adsorbate.
Batch experiments were conducted to determine the adsorption ability of hexavalent chromium onto chitosan using air stirring techniques. This work confirms that, chitosan was found to be an effective adsorbent for the removal of Cr (IV) from aqueous solutions. The study showed that time, concentration of chromium, chitosan mass and air flow rate influence the adsorption process.The kinetic data indicated that the sorption kinetic of chromium onto chitosan using air stirring follows the pseudo-second-order model.
americanum L. Seed pods. J. Hazard. Mater. 161, 709–
713, 2009.
[4] D. Mohan, C.U. Pittman Jr., Activated carbons and low cost adsorbents for remediation of tri- and hexavalent chromium from water, J. Hazard. Mater. B137 , 762–811, 2006.
[5] J. Li, Q.-y. Yue, et al., Adsorption of chromium (vi)
from aqueous solution on bentonite modified by cationic polymers, Huanjing Kexue 30 ,1738–1743,
2009.
[6] A. Atia, Adsorption of chromate and molybdate by
cetylpyridinium bentonite, Appl. Clay Sci. 41 ,73–84,
2008.
[7] Guang L., Xiaogang Y. and Gance D., “ Simulation of
effects of the configuration of gas distribution on gas gas-liquid flow and mixing in a bubble column “ Chem. Eng. Sci. 64,5104-5116, 2009.
[8] Nassar M.M. Energy consumption and mass transfer
during adsorption using gas and mechanical stirring
system Wat. Res. 32: 3071-3079, 1998.
[9] Decker W.D. Bubble column reactors. Wiley, New
York, USA, 1992.
[10] Nassar, M M, Farrag T E and Joseph Y Farah, “ Gas
sparged adsorbed for decolourization dye effluent”
Eurasian Chem Tech Journal ,9,1:31-36, 2007.
[11] Jia Y., Wang R. and Fane A. G. ,Atrazine adsorption from aqueous solution using powder activated carbon
– Improved mass transfer by air bubbling agitation, Chem Eng Journal 116,53-59, 2006.
[12] M M.Nassar, M.S.El-Guendy and A A. Wahabi "Enhancing adsorption of dyes onto clay in Bubble Asorber" Adsorption Science & Technology, 30,. 7,
567-577, 2014.
[13] Snell, F.D. , Snell, C. T., Colorimetric Methods of
Analysis , third ed., vol. 2, D. Van Nostrand Company
, New York, Toronto, 1959.
[14] Arnold,E.Greenberg ; Lenore, S. Clesceri ; and
Andrew, D. Eaton, Standard Methods For The
IJSER © 2015 http://www.ijser.org
International Journal of Scientific & Engineering Research, Volume 6, Issue 2, February-2015 198
ISSN 2229-5518
Examination Of Water And Wastewater, 18th
Edition, 1992.
[15] S. Brunauer, P.H. Emmett, E. Teller, Adsorption of gases in multi molecular layers, J. Am. Chem. Soc. 60
,309–319, 1938.
[16] Lagergren, S. ,About the theory of so-called
adsorption of soluble substances. Kungliga Svenska
Vetenskapsakademiens Handlingar, Band. 24 (4): 1–
39, 1898.
[17] Y.S. Ho, G. McKay, Pseudo-second order model for sorption processes,Process Biochem. 34 , 451–465,
1999.
[18] Cheung, C.W., Porter, J.F., McKay, G., Elovich equation and modified second–order equation for sorption of cadmium ions onto bone char, J. Chem. Technol. Biotechnol. 75, 963–970, 2000.
[19] Kuo, S. and Lotse, E.G. “ Kinetics of phosphate
adsorption and desorption by hematite and gibbsite”, Soil Sci. Soc. Am. J. 116: 400–406 , 1973.
[20] Wang,Z., Yue,T., Yuan, Y., Cai,R., Niu,C. and Guo
C.” Kinetics of adsorption of bovine serum albumin on magnetic carboxymethyl chitosan nanoparticles” International Journal of Biological Macromolecules 58
,57– 65, 2013.
[21] Choy, K.K.H.; Ko, D.C.K; Cheung, C.W.; Porter J.F. and McKay G. ,Film and intraparticle mass transfer during the adsorption of metal ions onto bone char. J. Colloid Interface Sci. 271:284–295, 2004.
[22] Kabbashi,N.A., Atieh, M.A., Al-Mamun1,A., Mirghami1, M. E. S.,Alam, M, Z. and Yahya,N. “Kinetic adsorption of application of carbon nanotubes for Pb(II) removal from aqueous solution” Journal of Environmental Sciences 21, 539–544, 2009.
IJSER © 2015 http://www.ijser.org