International Journal of Scientific & Engineering Research Volume 4, Issue 1, January-2013 1
ISSN 2229-5518
Activity Based Cost Management: An
Effective Tool for Quality Performance
Measurement in Manufacturing Industries
Sailaja A*, P C Basak, K G Viswanadhan
Abstract— All industries world wide are facing intense competitions due to globalization and they are forced to adopt more flexible, integrated and highly automated methods for production in order to increase their productivity at reduced costs and with maximum customer satisfaction. This objective is to be achieved without any sacrifice in Quality, since the customer in this era is highly knowledgeable and ever demanding. Sustaining competitiveness is possible only when the processes and their associated costs are closely monitored, measured and analyzed for continual improvement. Cost of Quality (COQ) measurement and analysis is one of the most powerful management tools for ascertaining the performance of a firm. Different COQ models are there in practice worldwide. Since most of these COQ measurement methods are activity \ process oriented, the traditional accounting system is not fully supportive of an accurate cost calculation under these methods. Activity Based Costing is the alternative for overcoming the drawbacks of traditional cost accounting system. COQ approaches, integrated to ABC can be utilized as an effective tool for measurement of quality costs. This paper presents an application of Activity Based Cost Management of Cost of Quality in a manufacturing industry and compares the results with the traditional P-A-F model. The results highlight the weak points of traditional Cost of Quality model.
Index Terms— Activity Based Costing, Activity Based Management,Quality,Cost of Quality, PAF model, Process Cost model,Performanance measurement,Competitiveness, Non- value added costs.
—————————— ——————————
1 INTRODUCTION
N the current era of market globalization and cut throat competi- tion , organizations have to focus more on customer satisfaction strategies without adding any extra costs. They are forced to adopt more flexible, integrated and highly automated methods for produc- tion in order to increase their productivity at reduced costs and with maximum customer satisfaction [1]. Since today’s customers are highly knowledgeable and demanding about their requirements, highly quality conscience and also cost conscience , achieving cus- tomer satisfaction with highest quality, less cost and minimum lead time has become the objective of any successful organization to achieve competitive edge.[2] . Also organizations have to manage their resources effectively due to the limited resource availability. One of the effective strategies of managing the available resources is to reduce operational costs by reducing the defects, by avoiding de- lays in work through effective planning and scheduling processes and also by eliminating wastes. All these objectives can be met only if all the processes of the organization and their associated costs are closely monitored, measured and analyzed for continual improve- ment. Sustaining competitiveness is possible by the Plan-Do-Check- Act cycle of Quality Management (QM) [3]. Measuring and report- ing the Cost of Quality (COQ) is the primary step in a quality man- agement program [4]. COQ is a financial measure of the quality per-
formance of an organization. It can be used as a powerful manage-
ment tool for assessing the current quality level of the organization, performance of quality improvement programs and also to indicate the major opportunities for improvement in the quality system. [5] Most of the COQ measurement methods are activity or process ori- ented, whereas the traditional accounting establishes cost accounts as a category of expenses. Direct material and labor costs are the only over head costs that can be traced to cost objects under traditional costing [1]. Traditional cost accounting system was not designed to capture and account all quality related costs and typically identify only a fraction of quality related expenditures. [6] An accurate cost calculation mechanism is inevitable to sustain competitive- ness. [7]. Activity Based Costing (ABC) methods were de- signed as an alternative to overcome the limitations of tradi- tional cost accounting system, which could not fully support the industries as they are highly automated, less labour inten- sive and are having higher product variation and higher over head costs [8].
Activity-based costing transforms certain indirect costs into direct costs that are precisely allocated to activities. This ap- proach provides a much more accurate picture of production costs, since overhead costs are no longer allocated arbitrarily
but on the basis of cause and effect.
IJSER © 2013 http://www.ijser.org
International Journal of Scientific & Engineering Research Volume 4, Issue 1, January-2013 2
ISSN 2229-5518
2 OVER VIEW
2.1 Cost of Quality (COQ)
The prevailing highly competitive market conditions force every industry to invest more and more in quality improve- ment activities. Quantification of financial payback from these investments and the identification of quality improvement project which offers highest returns have become essential for industries to survive in the highly demanding global customer scenario. Cost of Quality is one of the best methods used worldwide for this quantification and analysis.
The Cost of Quality comprises the costs associated with quali- ty improvement methods for ensuring Quality and also the costs associated with managing poor Quality.
Different COQ models are in practice worldwide. Prevention-
Appraisal-Failure (PAF) model and Process Cost Model (PCM) are the two main approaches in measuring COQ. [9],[10],[11],[12].
In the traditional PAF model, cost elements are identified by examining operating procedures, accounting system records and monthly reports on functional department level and clas- sified into the four categories of Prevention (P), Appraisal (A), Internal Failure (IF) and External Failure (EF) costs. [13].Prevention costs are those costs associated with prevent- ing defects and imperfections from occurring. Appraisal or detection costs are those associated with measuring quality directly. Internal failure costs are those incurred as a result of unsatisfactory quality found before the product or service is delivered to the customer. External failure costs occur after poor-quality products or services reach the customer or stake- holder. [14].
Even though the PAF model is well accepted by the quality practitioners, many limitations are observed with this ap- proach. Some of the cost elements are not identified and quan- tified in this approach. Tracing various prevention cost ele- ments is difficult due to absence of any explicit cause and ef- fect relation between those cost elements to a particular prod- uct\department.[6] Some of the cost elements are not distin-
guishable to a P-A-F category. Cost elements such as loss due
to lost sale, loss of good will etc. cannot be quantified, since these are highly qualitative.[15]. Since the measurement and analysis is oriented on a department concept, chances of shift- ing responsibilities are more, which adversely affect the or- ganizational goal.
Process Cost Model (PCM), based on process concept is
emerged as an alternative to PAF model, which is more inte- grated, structured and systematic COQ approach. In PCM model, cost elements are identified at the process or sub- process level and are classified as Cost of Conformance (COC) and Cost of Non Conformance (CONC).The improvement areas in the processes are identified, planned and implement- ed based on the estimated COC and CONC data. This model is in line with the continuous improvement strategy of Total Quality management (TQM). [16]
Even though the PCM model explains the cost of quality in a better way, limitations are associated with this model also. [17], [18], [6].They are listed below
The overhead costs are not appropriately allocated in the COQ calculations. Either it is being allocated to direct cost of labor and materials on rework and scrap or most of the time not allocated at all.
The model is not intended to trace quality costs to their sources such as products, designs, venders, dis- tribution channels, customers and so on [6] and hence are not fully successful in identifying the actual areas for improvement [19].
The overhead allocations like indirect labor costs are also not being addressed adequately in these systems [20], [1].
In the earlier days, overheads were just a small portion of the
production costs. Hence the costing system was not distorted much due to that. But presently, owing to the high degree of automation and computerization, the cost distortion due to misappropriation of overhead allocation has become highly significant. Activity based Costing (ABC) is suggested as the alternative to improve the accuracy of product cost. [8].
IJSER © 2013 http://www.ijser.org
International Journal of Scientific & Engineering Research Volume 4, Issue 1, January-2013 3
ISSN 2229-5518
2.2 Activity Based Costing (ABC)
Activity Based Costing (ABC) is a two dimensional model with cost assignment view for assigning resource costs to cost objects and process view for performance measurement of activities. In cost assignment view, activity centers in an or- ganization are identified and resource costs are assigned to cost drivers based on the number of each activity used and mapped to cost objects using activity drivers. In process view, cost drivers are used to trace the cause of the activity cost and using performance measures, the results are analyzed to check whether it meets the customer requirements.
In traditional cost accounting, the assumption is that the cost objects consume resources whereas Activity Based costing (ABC) assumes that cost objects consume activities. Tradition- al cost accounting mostly utilizes volume related allocation bases while ABC uses drivers at various levels. Traditional costing is structure oriented, whereas ABC is process oriented [19]. ABC provides information on costs and information on process. It is based on the assumption that activities are causes of costs, while products create the needs for activities. Costs are traced from resources to activities and then from activities to products or customers. In ABC, activities are managed more efficiently to reduce cost and increase quality by more effica- cious performance of planning product activities, material handling activities, reducing number of parts, eliminating non-value added activities and improving value added ones and by taking care of customer satisfaction [21]. Whereas in traditional system, cost reduction measures are through mate- rial cost reduction, speeding up of machine operations and making direct work more efficacious [20] .
2.3 Activity Based Management (ABM)
Using Activity Based Costing (ABC) to improve a business is called Activity Based Management (ABM). ABM includes cost driver analysis, activity analysis and performance measure- ment.(Fig.1). Activity analysis is done with an objective to eliminate those activities that do not add value to the product and in turn, reduce product costs. ABC measures performance
of activities, determine the output costs and identify the possi-
bilities for making the process more efficient and effective [1]. Instead of focusing on resources, ABM bases management decisions on activities, thereby providing a completely new perspective on company operations. Rather than arbitrarily assigning resources to activities, ABM provides managers with the crucial ability to question the relevance of activities and hence optimize the resources allocated to them. ABM’s main advantage is that, by identifying company-specific per- formance measures, it focuses on cost management activity and also improves planning techniques and the tracking of established goals. [22].
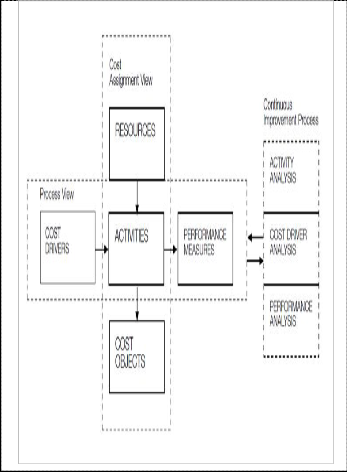
Fig. 1 ABM model
IJSER © 2013 http://www.ijser.org
International Journal of Scientific & Engineering Research Volume 4, Issue 1, January-2013 4
ISSN 2229-5518
3 ABM SYSTEM FOR COQ ANALYSIS
Cost of Quality measurement under Activity Based Manage- ment provides the strength of both PAF model as well as Pro- cess Cost model of COQ, since it is activity oriented in the cost assignment view and process oriented in the process view. Limitations of both the earlier COQ models are overcome in this integrated approach and helps to identify, quantify and allocate quality costs among products, and therefore manage quality costs more effectively to help continuous improvement in processes, activities and quality by eliminating non-value added activities [6],[19]. It enables managers to focus their quality improvement initiatives on those areas where non quality costs are highest, in order to quickly derive the great- est return. ABC is in accordance with Total Quality manage- ment methodology and product defining as a set of processes [6].
4 ILLUSTRATION: ABM BASED COQ SYSTEM
4.1 Methodology
The present study focuses on the manufacturing of Smart Cards by an organization in the electronic manufacturing sec- tor .All processes in the organization under study has been listed out and prioritized based on a feedback received from the managers of each functional department through adminis- tering a questionnaire. The detailed study of ABM based qual- ity costing analysis has been done on a selected process, man- ufacturing process, which is found to have the highest priority as per the feedbacks collected.
In the first stage of cost assignment view of ABC, the activities of these selected processes were identified and utilization of various resources by each activity is found using resource drivers and resource cost is traced to each activity. This gives the cost of each activity. In the second stage, activity drivers were listed out for each activity and using these drivers, activi- ties was traced to cost objects to determine the value of cost object. The two customers to whom these Smart cards are be-
ing supplied by the organization are taken as the cost objects
for this study.
Then the performance is measured through the process view of ABC, by performing the cause and effect analysis. Cost drivers which are the controlling factors of cost of activity is identified and checked against the performance of activities to assess how well the activity is performed. With this analysis, activities are grouped to value added and non-value added.. Finally non-value added activities are critically analyzed for checking the possibility of its elimination or reduction in cost.
4.2 Data Collection and Analysis
Data collected for a period of ten months from January 2012 to October 2012 against two customer requirements as cost object was taken for this cost of quality analysis. Labor cost, Machine cost and facility costs are the resource costs. Labor hours and machine hours are the resource drivers for labor cost and ma- chine cost respectively. These data are collected from the manufacturing time cards and standard man hour (SMH) cal- culations after time study of each operation is done by the In- dustrial Engineering department. Machine hour is collected from the machine job cards and machine cost worked from the procurement cost of machine, its guaranteed life time and op- eration and the depreciation factors from accounts. Other costs such as facility costs, tool costs, consumable costs etc. are di- rectly taken from the records. Detailed flow charting of the process, listing out of all activities in the process, tracing re- sources costs to activities using resource drivers and tracing activity costs to cost objects using activity drivers were done. Machine hours, number of reworks, number of tests carried out, units taken for packaging, number of loaded batches, maintenance hours etc are the activity drivers used for activity cost assignment to cost objects . Table 1a represents the results of activities identified, resources required, resource drivers and Table 1b represents tracing the resources to activity costs. Table 2 a shows activity drivers and corresponding quantities and Table 2 b represents the results of tracing the activity costs to cost objects using activity drivers.
IJSER © 2013 http://www.ijser.org
International Journal of Scientific & Engineering Research Volume 4, Issue 1, January-2013 5
ISSN 2229-5518
Table 1 a: Activities and Resources
ance which are non-value added costs.Further analysis made on these costs to identify the root cause.
Table 4 represents the result of this analysis.
Using Statistical tools, activities incurring highest cost are identified for further analysis. Figures 2, 3 and 4 shows the result of this analysis. Total product cost, total non value add- ed and Value added cost, total Cost of Quality and its percent- age to total product cost and the cost improvement areas were identified in this analysis. Costs traced are grouped to COQ related and COQ –unrelated costs to cost objects. In the COQ related costs, further analysis made to identify the Cost of Conformance and Cost of Non Conformance. Figures 5 shows the result of this analysis.
Table 1 b: Activity cost assignment
Table 3 shows the summery of the cost analysis. Total manu- facturing cost is the sum of the direct material cost, Total Ac- tivity Cost, Total product cost and idle hour cost.
Activity costs are then classified to Essential, Cost of Con- formance and Cost of Non Conformance based on the Process Cost model of Cost of Quality and further analyzed to Value added and Non-Value added as per customer perspectives. Essential costs are cost of those activities which are inevitable to run the process but not relevant to COQ. Planning and scheduling, Material handling cost and Machine cost are es- sential Non-Value added costs. Eventhough they are not add- ing any values they cannot be eliminated. Machining and packaging are essential value added costs.Inspection and maintenance are cost of conformanace, out of which inspection is Non-value added and Maitenance Value added. Rework,
Warranty repairs and Replacements are cost of non conform-
Cause and effect analysis made for identifying the factors in- fluencing the activity costs of high cost activities and further performance analysis made for determining the improvement plans for high cost activities\processes.
IJSER © 2013 http://www.ijser.org
International Journal of Scientific & Engineering Research Volume 4, Issue 1, January-2013 6
ISSN 2229-5518
Table 2 a: Activity Drivers
Table 2 b: Tracing the activity costs to cost objects
Activities | Total Activity cost(Rs) | Rs/Activity Driver | Activity Cost assignment(Rs) |
Activities | Total Activity cost(Rs) | Rs/Activity Driver | Cost Object A | Cost Object A |
Planning & Scheduling | 49635 | 1985 | 23825 | 25810 |
Material Handling | 161314 | 3226 | 80657 | 80657 |
Machining | 1148331 | 236 | 503249 | 645082 |
Inspection | 408877 | 8178 | 204438 | 204438 |
Maintenance | 29412 | 6 | 12889 | 16522 |
Machine Set up | 96700 | 12088 | 48350 | 48350 |
Re work | 327474 | 13099 | 222683 | 104792 |
Warranty repairs | 209539 | 17462 | 122231 | 87308 |
Packaging | 30034 | 0.0046 | 14562 | 15472 |
Repalcement | 16821 | 2403 | 7209 | 9612 |
Table 4 : Process performance analysis
Table 3 : Summery of Cost Analysis
Production Quantity | 3200000 | 3400000 | 6600000 |
Direct material Cost(Rs) | 4800000 | 5100000 | 9900000 |
Total Activity costs(Rs) | 1240093.2 | 1238043.7 | 2478136.9 |
Total product Cost(Rs) | 6040093.2 | 6338043.7 | 12378137 |
Idle Hours Cost(Rs) | | | 16958 |
Total cost of manufacturing(Rs) | | 12395094 |
Product Cost per Unit | 1.9 | 1.9 | 3.8 |
Total Value Added Cost(Rs) | 530700 | 677076 | 1207776.7 |
IJSER © 2013 http://www.ijser.org
International Journal of Scientific & Engineering Research Volume 4, Issue 1, January-2013 7
ISSN 2229-5518
Fig 2. COQ Elements of Cost Object A
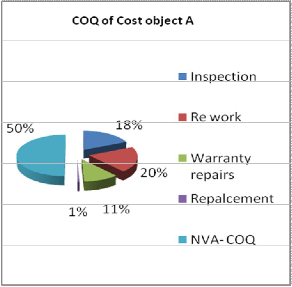
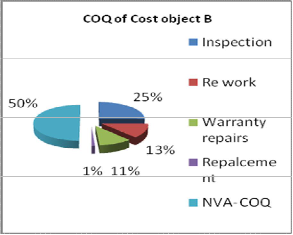
Fig 3. COQ Elements of Cost Object B
4.3 Findings
From this analysis, the following inference could be arrived
1. The cost of the inspection, re- work and warranty repairs are found as the major contributors of Cost of Quality for both the customers A & B. Inspection cost is the activity bearing high- est COQ with a contribution of 50% of the total COQ; Rework cost is next highest and then Warranty cost .
2. Out of these most important cost activities, the inspection cost is Cost of Conformance; rework costs and warranty costs are cost of Non-Conformance. All these are non value added activities, reduction or elimination of which provides the
greatest opportunity for improvement.
3. Non- value added COQ for both the customers are enor- mously higher than the value added COQ. This gives im- mense opportunity for improvement.(Fig 5).
4. From the cause and effect analysis, it is found that the in- spection activity cost can be considerably reduced if the raw material quality is improved. This points out to the require- ment of vendor education and vendor quality improvement.
5. It is also found that the supply to the first customer A in- curs more non value added quality costs than second custom- er channel B, due to the more rework and warranty repair costs for this channel.
6. Idle capacity costs are also identified in this analysis, which gives an insight to the authorities to deploy the unused re- sources
7. This integrated model enables resources and other associat- ed costs to be more accurately attributed to the products and the customers and identifies where high (and low) costs are being incurred. The reason for the same can also be traced out.
Fig 4. Elements of Total COQ
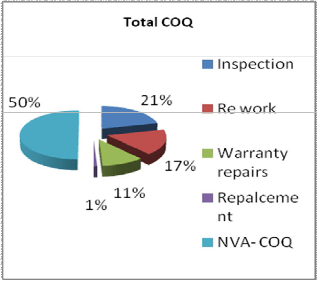
The analysis shows that COQ can be more effectively calculat- ed in the ABM system than the traditional PAF model, since it tracks all the resource costs to the activities including the costs of indirect labor and indirect machine which are not appropri- ately assessed in the PAF model.
4.4 Limitations and Draw backs
This study is limited only to a high priority process as selected
by taking the opinions of functional managers. Since the basis
of this selection is highly subjective, the risks of approximation
are also very high.
The process is time consuming and found to be comparatively
more difficult for setting up and establishing, if all the activi-
IJSER © 2013
http://www.ijser.org
International Journal of Scientific & Engineering Research Volume 4, Issue 1, January-2013 8
ISSN 2229-5518
ties are to be analyzed and used for costing.
Most of the data collection methods adopted is manual and
hence having risk of errors and poor data quality.
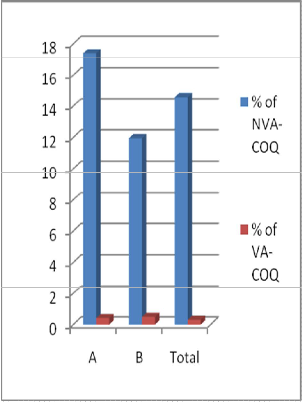
Fig.5 Value Added Vs Non Value Added COQ
5. SCOPE FOR FUTURE STUDY
Better mathematical approaches can be adopted for quantify- ing the highly subjective data.
This study can be further extended to other processes in the organization using an integrated approach of Supplier to Cus- tomer processes, instead of limiting to a selected process.
To overcome the difficulty and high time consumption in the data capturing and activity cost analysis, system integrated software programs can be devised
6. CONCLUSION
An attempt is made in this study to analyse the drawbacks of traditional methods of Cost of Qualty, advantages of Activity Based Costing methods over the traditional method and also the strengths of Activity Basd Cost of Quality system model. It is explicit that ABC oriented COQ system is an alternative to overcome the limitations of traditional mode, such as inap-
propriate resource allocation, difficulty in tracing COQ to its cost objects. Further a detailed case study on implementation of COQ with ABM model has been conducted.This study points out the requirement of an integrated data capturing system .
References:
[1] Derya Eren Akyol et al,” A comparative analysis of activ- ity-based costing and traditional costing”, World Acad- emy of Science, Engineering and Technology, 3, 2005
[2] Hassan Ali et al, “Classical Model Based Analysis of Cost of
Poor Quality in A Manufacturing Organization” , African
Journal of Business Management Vol. 6(2), pp. 670-680, 2012
[3] Zulnaidi Yaacob, “Quality Management as an Effective Strategy of Cost Savings”, African Journal of Business Management, Vol.4 (9), pp 1844-1855, 2010
[4] Retnari Dian M, Amrin Rapi, and Nilda, “The Measurement of Quality Performance with Sigma Measurement and Cost of Poor Quality as a Basis for Selection Process of Quality Im- provement”, IMECS 2010, Proceedings, Hong Kong, 2010
[5] Arthur B. Jeffery, “Managing Quality: Modeling the Cost of
FigQu5ality Improvement” Southwest Business and Economics
Journal/2003-2004
[6] Tsai, W.H. (1998), “Quality cost measurement under activity-
based costing”, International Journal of Quality and Reliability
Management, Vol.15, No.6, p.719
[7] Juran,” Juran’s Quality Control Handbook.”, 1951
[8] Cooper, R. and R.S. Kaplan, “Profit Priorities from Activ- ity-Based Costing”. Harvard Business Review, 1991.
[9] A. Schiffauerova, V. Thomson, “A review of research on cost of quality models and bestpractices”, International Journal of Quality & Reliability Management, vol. 23, pp. 647-669,2006
[10] G.H. Hwang, E.M. Aspinwall, “Quality cost models and their
application: a review”, Total Quality Management & Business
Excellence, vol. 7, pp. 267-282, 1996.
[11] N. M. Vaxevanidis, G. Petropouolos, J. Avakumovic, A.
Mourlas , “Cost Of Quality Models And Their Implementation In Manufacturing Firms’, International Journal for Quality re- search ,Vol. 3, No. 1, 2009
[12] Sailaja A ,P C Basak, K G Viswanadhan,”Cost of Quality models and practices in manufacturing industries: A Lit- erature review”, International Journal for Business and management Tomorrow, vo.2,No10,2012
[13] Sailaja A ,P C Basak, K G Viswanadhan , “A case study on Cost of Quality Practices in an Electronic manufacturing In- dustry”, Proceeding of International Conference on Quali- ty,Reliability ,Infotechnology and Management(ICQRITIM-
2012), November 2012
[14] A.V. Feigenbaum, “Total quality control”, Harvard Business
Review, vol. 34, pp. 93-101,1956
[15] Johnson, A.M., “The Development of Measures of The Cost of Quality for an Engineering Unit”, International Journal of Quality & Reliability Management, 12(2), 86-100.,1994
[16] oulden, C. and Rawlins, L. (1995), “A hybrid model for pro- cess quality costing”, International Journal of Quality & Relia- bility Management, Vol.12, No.8, p.32
[17] Total Quality Management by John S. Oakland
IJSER © 2013
http://www.ijser.org
International Journal of Scientific & Engineering Research Volume 4, Issue 1, January-2013 9
ISSN 2229-5518
[18] L.J. Porter, P. Rayner, “Quality costing for total quality management”, International Journal of Production Eco- nomics, vol. 27, pp. 69-81, 1992
[19] Gary Cockins, “Why Is Traditional Accounting Failing
Quality Managers? Activity-Based Costing Is the Solu- tion “ASQ’s 53rd Annual Quality Congress Proceedings.
[20] Peter B.B. Turney,”Activity-Based Costing: an Emerging
Foundation for Performance Management” SAS 2010.
[21] Blagoje Novićević, Ljilja Antić,” Total Quality Manage-
ment and Activity-Based Costing” Economics and Or- ganization Vol. 1, No 7, 1999, pp. 1 - 8
[22] M. Ozbayrak . M. Akgun., A.K. Turker “Activity-based cost
estimation in a push/pull advanced manufacturing system”, Int. J. Production Economics, 2003
*Sailaja A, Research Scholar, School of Management Stud- ies, IGNOU, New Delhi.
Prof. Dr. P C Basak, Professor, School of Management
Studies, IGNOU, New Delhi.
Dr. K G Viswanadhan, Associate Professor, Mechani- cal Engg. Dept., NSS College of Engineering, Kerala.
IJSER © 2013 http://www.ijser.org