International Journal of Scientific & Engineering Research, Volume 6, Issue 2, February-2015 516
ISSN 2229-5518
A Theoretical Comparative Study of Heat Load
Distribution Model of a Cold Storage
Dr. Nimai Mukhopadhyay, Mr. Bodhisattwa Maity
—————————— ——————————
INTRODUCTION
A major use of refrigeration is in the preservation, storage and distribution of perishable foods. Although the use of low temperatures for this purpose has been known and practiced for many thousands of years, it was not until the last century that Pasteur and others determined the bacteriological nature of food spoilage and the beneficial effect of cooling. An immediate advantage was to make it possible to provide the extra food required by the growing urban populations. A large international trade has built up on this, starting with the transport of frozen meats to Europe in 1873 and 1876.
Cold Storage is a special kind of a room, the temperature of which is kept sufficiently low with the help of machines and precision instruments. Cold storage plays an important role in the preservation of perishables especially fruits and vegetables. It helps in scientific preservation of perishables, stabilizes prices by regulating marketing period and supplies. It also helps the primary producer from distress sale and encourages farmers to produce more. In view of the fall in prices of fruits and vegetables immediately after harvest and to avoid spoilage of fruits and vegetables worth cores of rupees, it has become necessary to create cold storage facility in the producing as well as consuming centres to take care of the existing and projected production of fruits and vegetables.
Energy crisis is one of the most important problems the world is facing nowadays. With the increase of cost of electrical energy operating cost of cold storage storing is
increasing which forces the increased cost price of the
commodities that are kept. So it is very important to make cold storage energy efficient or in the other words reduce its energy consumption. Thus the storage cost will eventually comes down. In case of conduction we have to minimize the leakage of heat through wall but in convection maximum heat should be absorbed by refrigerant to create cooling uniformity thought out the evaporator space. If the desirable heat is not absorbed by tube or pipe refrigerant then temp of the refrigerated space will be increased, which not only hamper the quality of the product which has been stored there but reduces the overall performance of the plant. That’s why a mathematical modeling is absolutely necessary to predict the performance.
In this paper we have proposed a theoretical comparative study of heat load distribution model of a cold storage using computer programming. Velocity of air (V), Temperature difference (dT), Relative Humidity (RH) are the basic variables and three ranges are taken each of them in the model development. Graphical interpretations from the model justifies the reality.
MODEL DEVELOPMENT
In this study, analysis of heat load calculation has been done using a designed sample data of a cold storage , Jalpaiguri, West Bengal, India. Using the technique of heat
IJSER © 2015 http://www.ijser.org
International Journal of Scientific & Engineering Research, Volume 6, Issue 2, February-2015 517
ISSN 2229-5518
load calculation we can calculate the total heat of the designed cold store. With the help of the obtained data machineries are being installed for running the store. The process of heat load calculation is the summation of different heat loads which are being calculated on different factors considered in the running, designing and fabrication of the cold store. Managerial aspects are also taken in consideration of heat load calculation.
{Area*thermal coefficient of insulation(U)*temperature difference*hours*3.51}/(12660*working hours of compressor)
(5%of total capacity of the chamber
*0.86*4.186*temperature difference*3.51)/(12660*working hours of compressor)
respiration process. This heat load plays a very important
role among all the other different heat loads calculated for the design purpose. Design factor includes the loading rate as per the chamber capacity, respiration rate of the product at the desired temperature, working hours of the compressor required to extract the heat generated. Production respiration load is given by:
(5%of the loading rate*respiration rate of the product*3.51)/(12660*working hours of the compressor)
(volume inside of chamber *74.5* number of air changes*0.3*3.51)/(12660*working hours of compressor)
(Number of workers * average heat load of a human body
*working hours*3.51)/12660
IJSER © 2015 http://www.ijser.org
International Journal of Scientific & Engineering Research, Volume 6, Issue 2, February-2015 518
ISSN 2229-5518
(Number of rows or column *number of fans *kilowatt of each motor*3.51)/12660
kilowatt of each light*number of lights*hours of lighting
CONDITIONS | DATA |
Storage size – chamber 1 & 2 | 87.478m*34.138m*16.764m |
Outside surface area (including floor) –Ch. 1 & 2 | 10050.19m² |
Volume of chamber 1& 2 | 50062.74m³ |
Insulation | EPS (expanded polystyrene) |
Ambient condition | 25ºC and 70%RH |
Temperature difference at storage | 3 ºC |
Humidity range at storage | (85-95) % |
Storage capacity | 14600MT |
Loading weight per day | 5% of chamber capacity per day |
Air change per day during loading | 2 air changes per day |
Air change per day during pull-down | 2 air changes per day |
Air change per day during holding | 1 air changes per day |
[{Area (10050.19 m²)*U (1.1)*TD (33-15)*hours (24)*3.51}/ (12660*24hr)] = 55.17KW
[{5%of the total capacity (14600000kg)*0.86*4.186*TD (25-
10)*3.51}/ (12660*24hr)] = 303.59KW
[{5%of the loading rate (14600mt)*respiration rate(12206)*3.51}/(12660*24hr)] = 102.94KW
(As at temp. 25°C respiration rate for potato is
12206kj/tons/day and at temp. 3°C respiration rate for potato is 812kj/tons/day)
[{volume (500620.74 m²)*74.5*2 air changes*0.3*3.51}/ (12660*24hr)] = 258.5KW
{(28 workers*1000kj/hr*8hours*3.51)/12660} = 62.1KW
Air handling unit = {14nos*12nos of fans*0.5hp*(3112kj/hp)*3.51}/12660 =72.47KW
Internal lights = 0.018(kw)*400*18hrs=129.6KW
In this study heat transfer from evaporating space to refrigerant (which are in tube or pipe) only being considered. The transfer heat evaporating space to refrigerant are calculated in terms of velocity of air (V), temp. Difference (dT) & relative humidity (RH). The three values of air velocity (V) of evaporator space are 0.74m/s,
1.25m/s and 1.76m/s respectively. The three values of temperature difference (dT) of evaporator space are 2, 5 & 8 centigrade respectively. The three values of relative humidity (RH) of evaporative space are 0.85, 0.90 & 0.95 respectively are taken measured values.
Basic equation for heat transfer: QT = Qconv + Qcondensation.
Qconv=Ahc dT & Qcondensation =Ahm( RH)hfg.
IJSER © 2015 http://www.ijser.org
International Journal of Scientific & Engineering Research, Volume 6, Issue 2, February-2015 519
ISSN 2229-5518
Here Qconv=heat transfer due to convection & Qcondensation =heat transfer due to condensation & QT =Total heat transfer or absorb heat into refrigerant.
And hc /hm =cp (Le)2/3 & hc L/K=Nu=0.026(Re)0.8(Pr)0.3
Hera A=surface area of tubes in evaporator space 1872 m2.hc =convective heat transfer co-efficient. hm =convective mass transfer co-efficient.hfg =latent heat of condensation of moisture.
First, the values of V and T remain constant
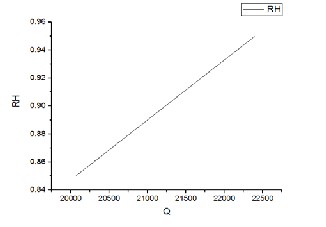
Enter the value for RH within the range of 0.85 to 0.95
RH=.85
Keeping V=1.25 and T=5 and incrementing the value of RH
by 0.01,the corresponding values of Q are:
Last, the values of T and RH remain constant
Enter the value for V within the range of 0.74 to 1.76
V=0.74
Keeping T=5 and RH=0.90 and incrementing the value of V
by 0.1,the corresponding values of Q are:
Now, the values of V and RH remain constant
Enter the value for T within the range of 2 to 5
T=2
Keeping V=1.25 and RH=0.90 and incrementing the value of
T by 0.5,the corresponding values of Q are:
IJSER © 2015 http://www.ijser.org
International Journal of Scientific & Engineering Research, Volume 6, Issue 2, February-2015 520
ISSN 2229-5518
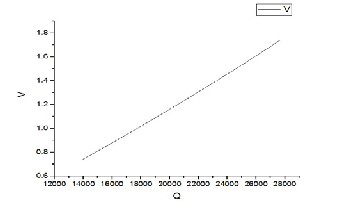
Figure: variation of heat transfer v/s air velocity
The graph indicates heat absorption increase with velocity of air increases.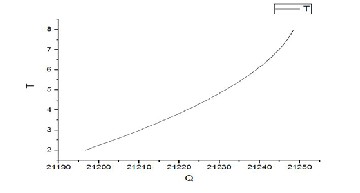
Figure: variation of heat transfer v/s temperature difference.
The graph indicates that heat absorption increase with temperature difference increase and at lower temperature difference it is more affected than the higher temperature difference.
Figure: variation of heat transfer v/s relative humidity. The graph indicates that heat absorption increase with
increase in relative humidity.
Here the work is concerned with the theoretical comparative study of heat load of a cold storage and we have seen that practical heat load more than theoretical heat load, but the difference is minor. So we can consider this model. Analysis of the heat load calculation has been done using real time sample data; programming has been done on C, while the graphs have been plotted using origin. With increasing the velocity of air, temperature difference and relative humidity heat absorb by the refrigerant is increased.
1. ISHRAE Publications, Air conditioning and Refrigeration
2. Mass and heat transfer, R.K.Rajput. (Book)
3. B.Kundu- international communications in heat and mass transfer, 2002.(An analytical study of the effect of dehumidification of air on the performance and optimization of straight tapered fins.)
4. B.J. Huang, J.M. Chang, V.A. Petrenko, K. B. Zhuk, ―A solar ejector cooling system using refrigeration R141b,‖ Solar Energy, vol.64, No.4-6, 1998, pp223-226(journal)
5. http://en.wikipedia.org/wiki/Heat_transfer(online collection)
6. Williscroft PMP, NZ Rural Press Limited, Auckland, 2007
IJSER © 2015 http://www.ijser.org
International Journal of Scientific & Engineering Research, Volume 6, Issue 2, February-2015 521
ISSN 2229-5518
7. International OPEN ACCESS Journal Of Modern Engineering Research (IJMER) | IJMER | ISSN: 2249–6645 | www.ijmer.com | Vol. 4 | Iss. 6| June. 2014 | 77| Theoretical heat conduction model development of a Cold
storage using Taguchi Methodology Prof. N. Mukhopadhaya1, Raju Das2
8. International Journal of scientific research and management
(IJSRM) ||Volume||2||Issue||10||Pages||1511-
1514||2014|| Website: www.ijsrm.in ISSN (e): 2321-3418
Dr.Nimai Mukhopadhyay1 IJSRM volume 2 issue 10 October
2014 [www.ijsrm.in] Page 1511
Optimization of a Cold storage using Taguchi Methodology
Dr.Nimai Mukhopadhyay1, Santanu Dey2
9. Dr. N. Mukhopadhyay Int. Journal of Engineering Research and Application www.ijera.com ISSN : 2248-9622, Vol. 5, Issue
1, ( Part -6) January 2015, pp.13-17 www.ijera.com 13 | Page
Theoretical Convective Heat Transfer Model
Developement of Cold Storage Using Taguchi Analysis.
Dr.N.Mukhopadhyay1, Suman Debnath2,
IJSER © 2015 http://www.ijser.org